

fig8
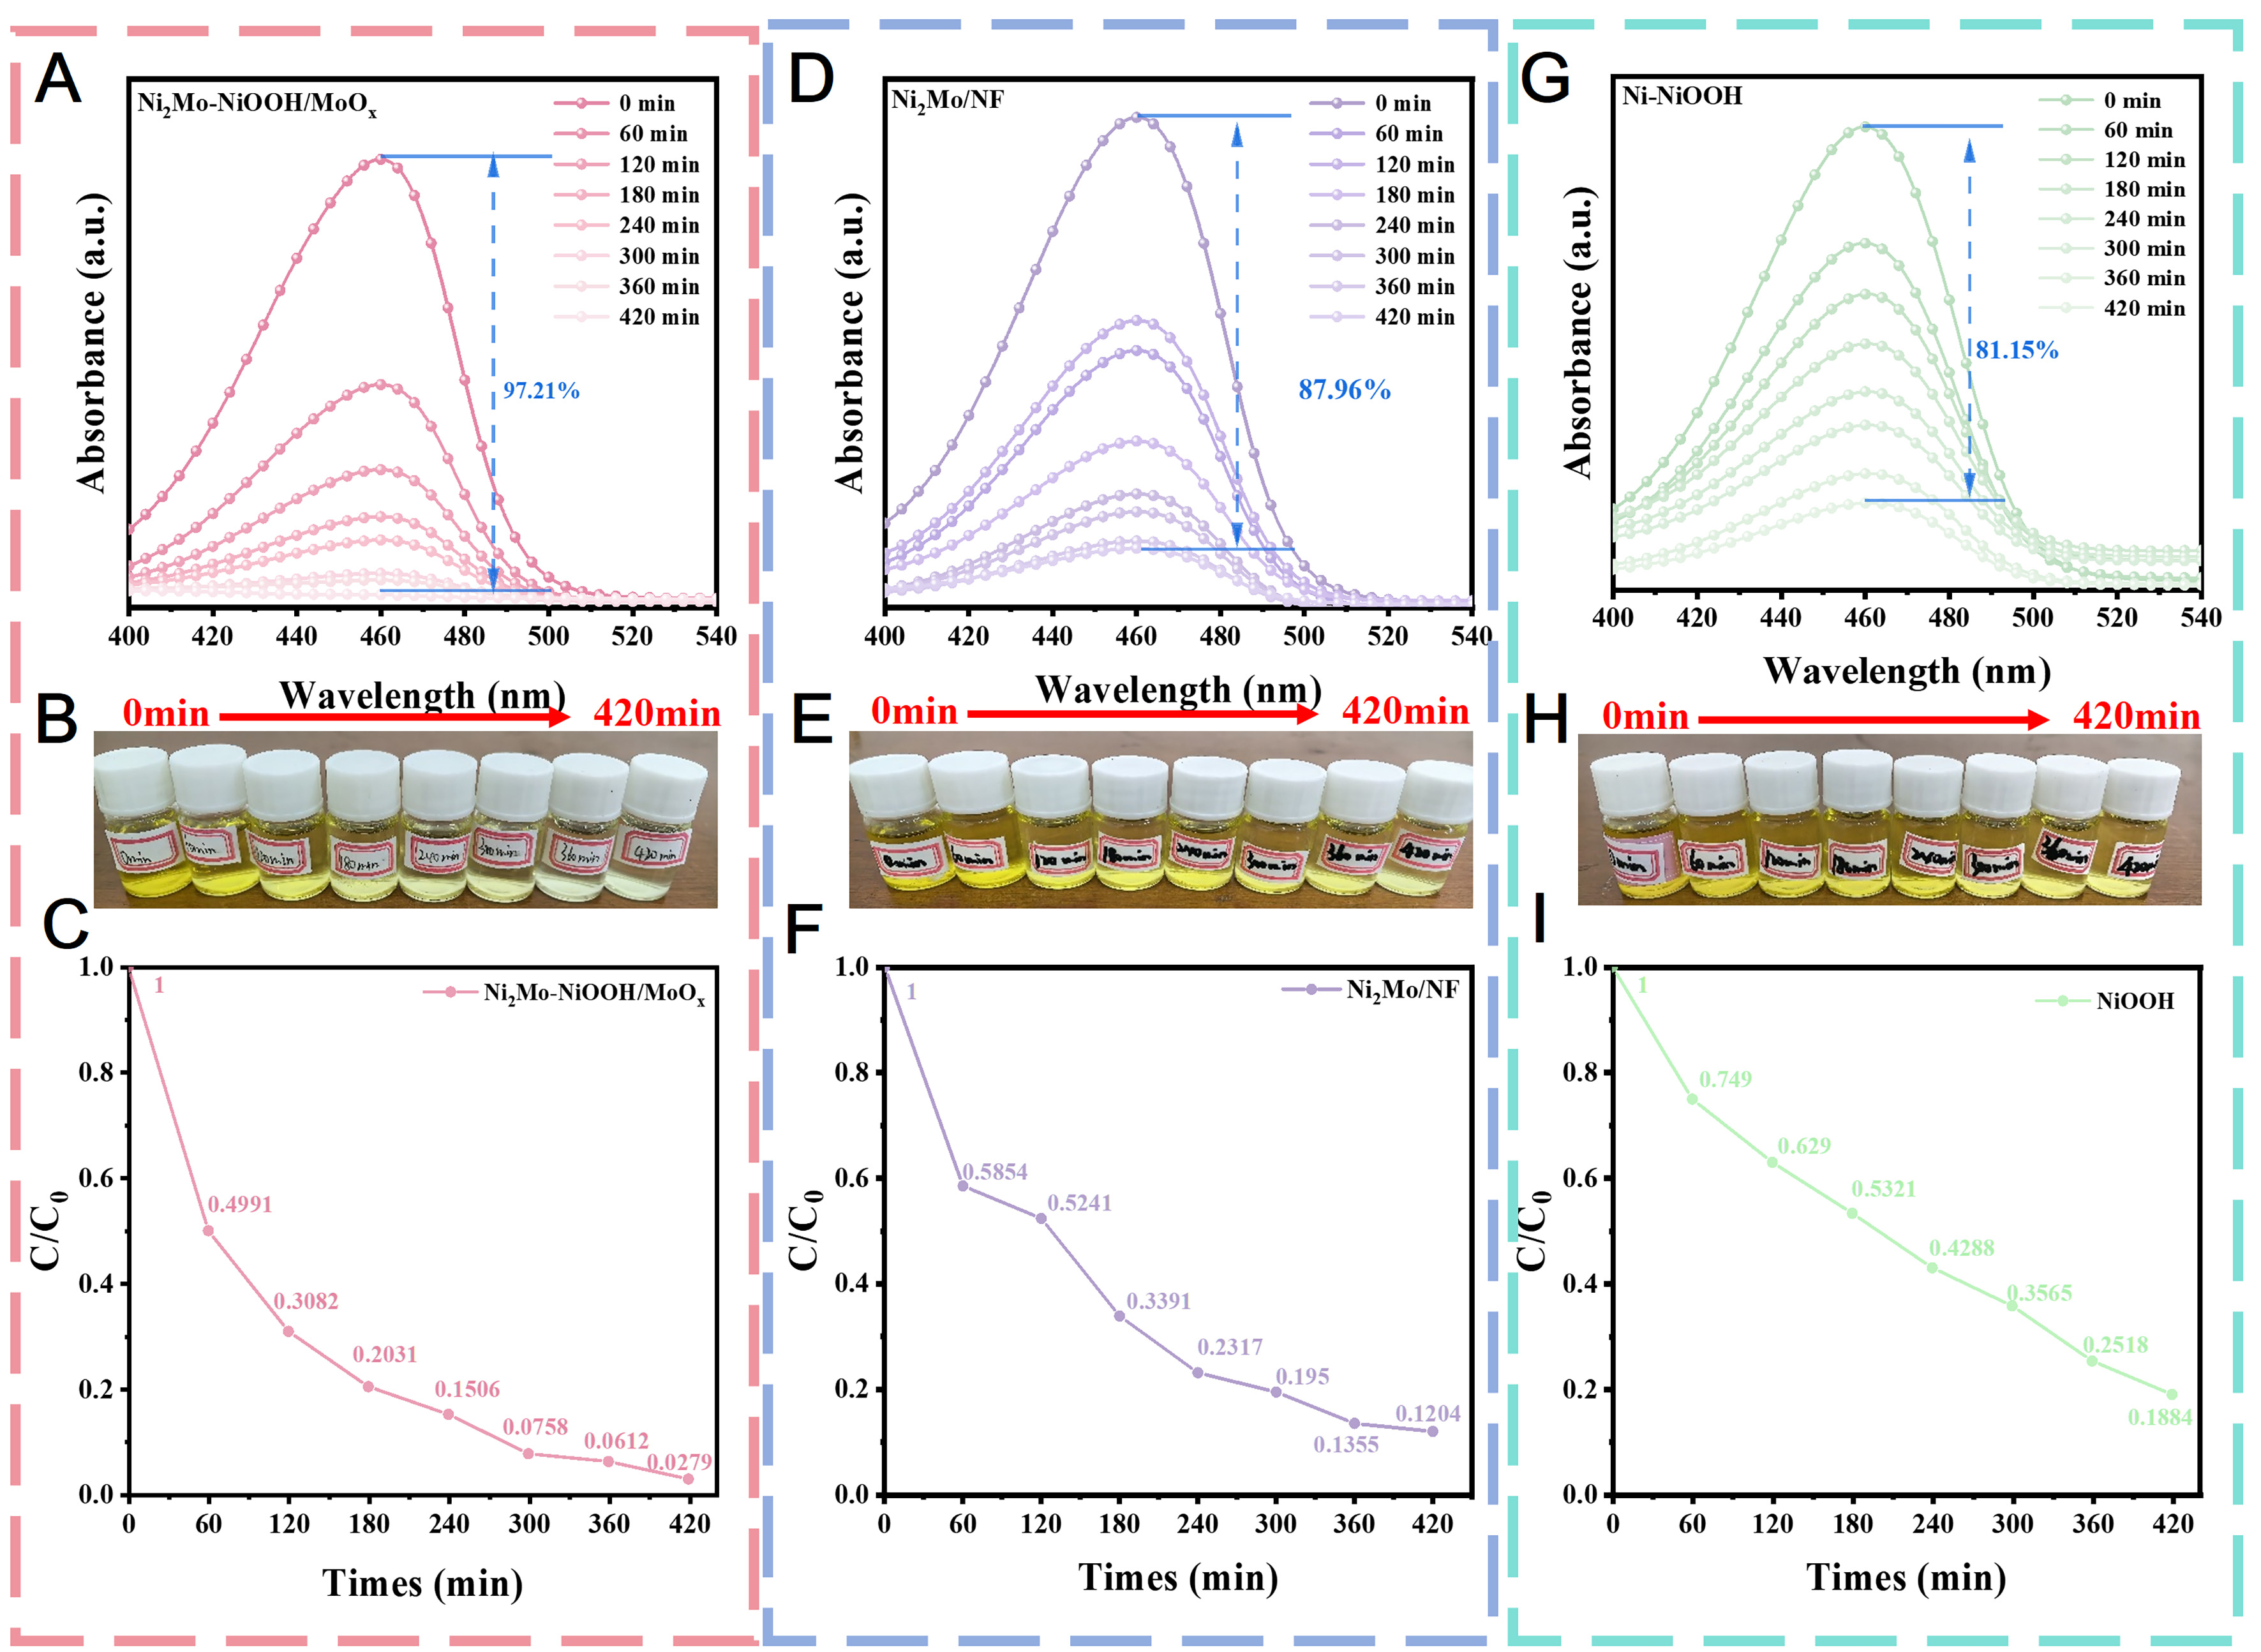
Figure 8. Urea degradation performance characterization of different catalytic electrodes. (A, D, G) UV-Vis absorption spectra at different reaction times; (B, E, H) Photographs of solution color evolution during the reaction; (C, F, I) Variation curves of relative urea concentration C/C0 as a function of reaction time; where (A)-(C), (D)-(F), and (G)-(I) correspond to the test results of Ni2Mo-NiOOH/MoOx, Ni2Mo/NF, and Ni-NiOOH catalysts, respectively. NF: Nickel foam.

