

fig7
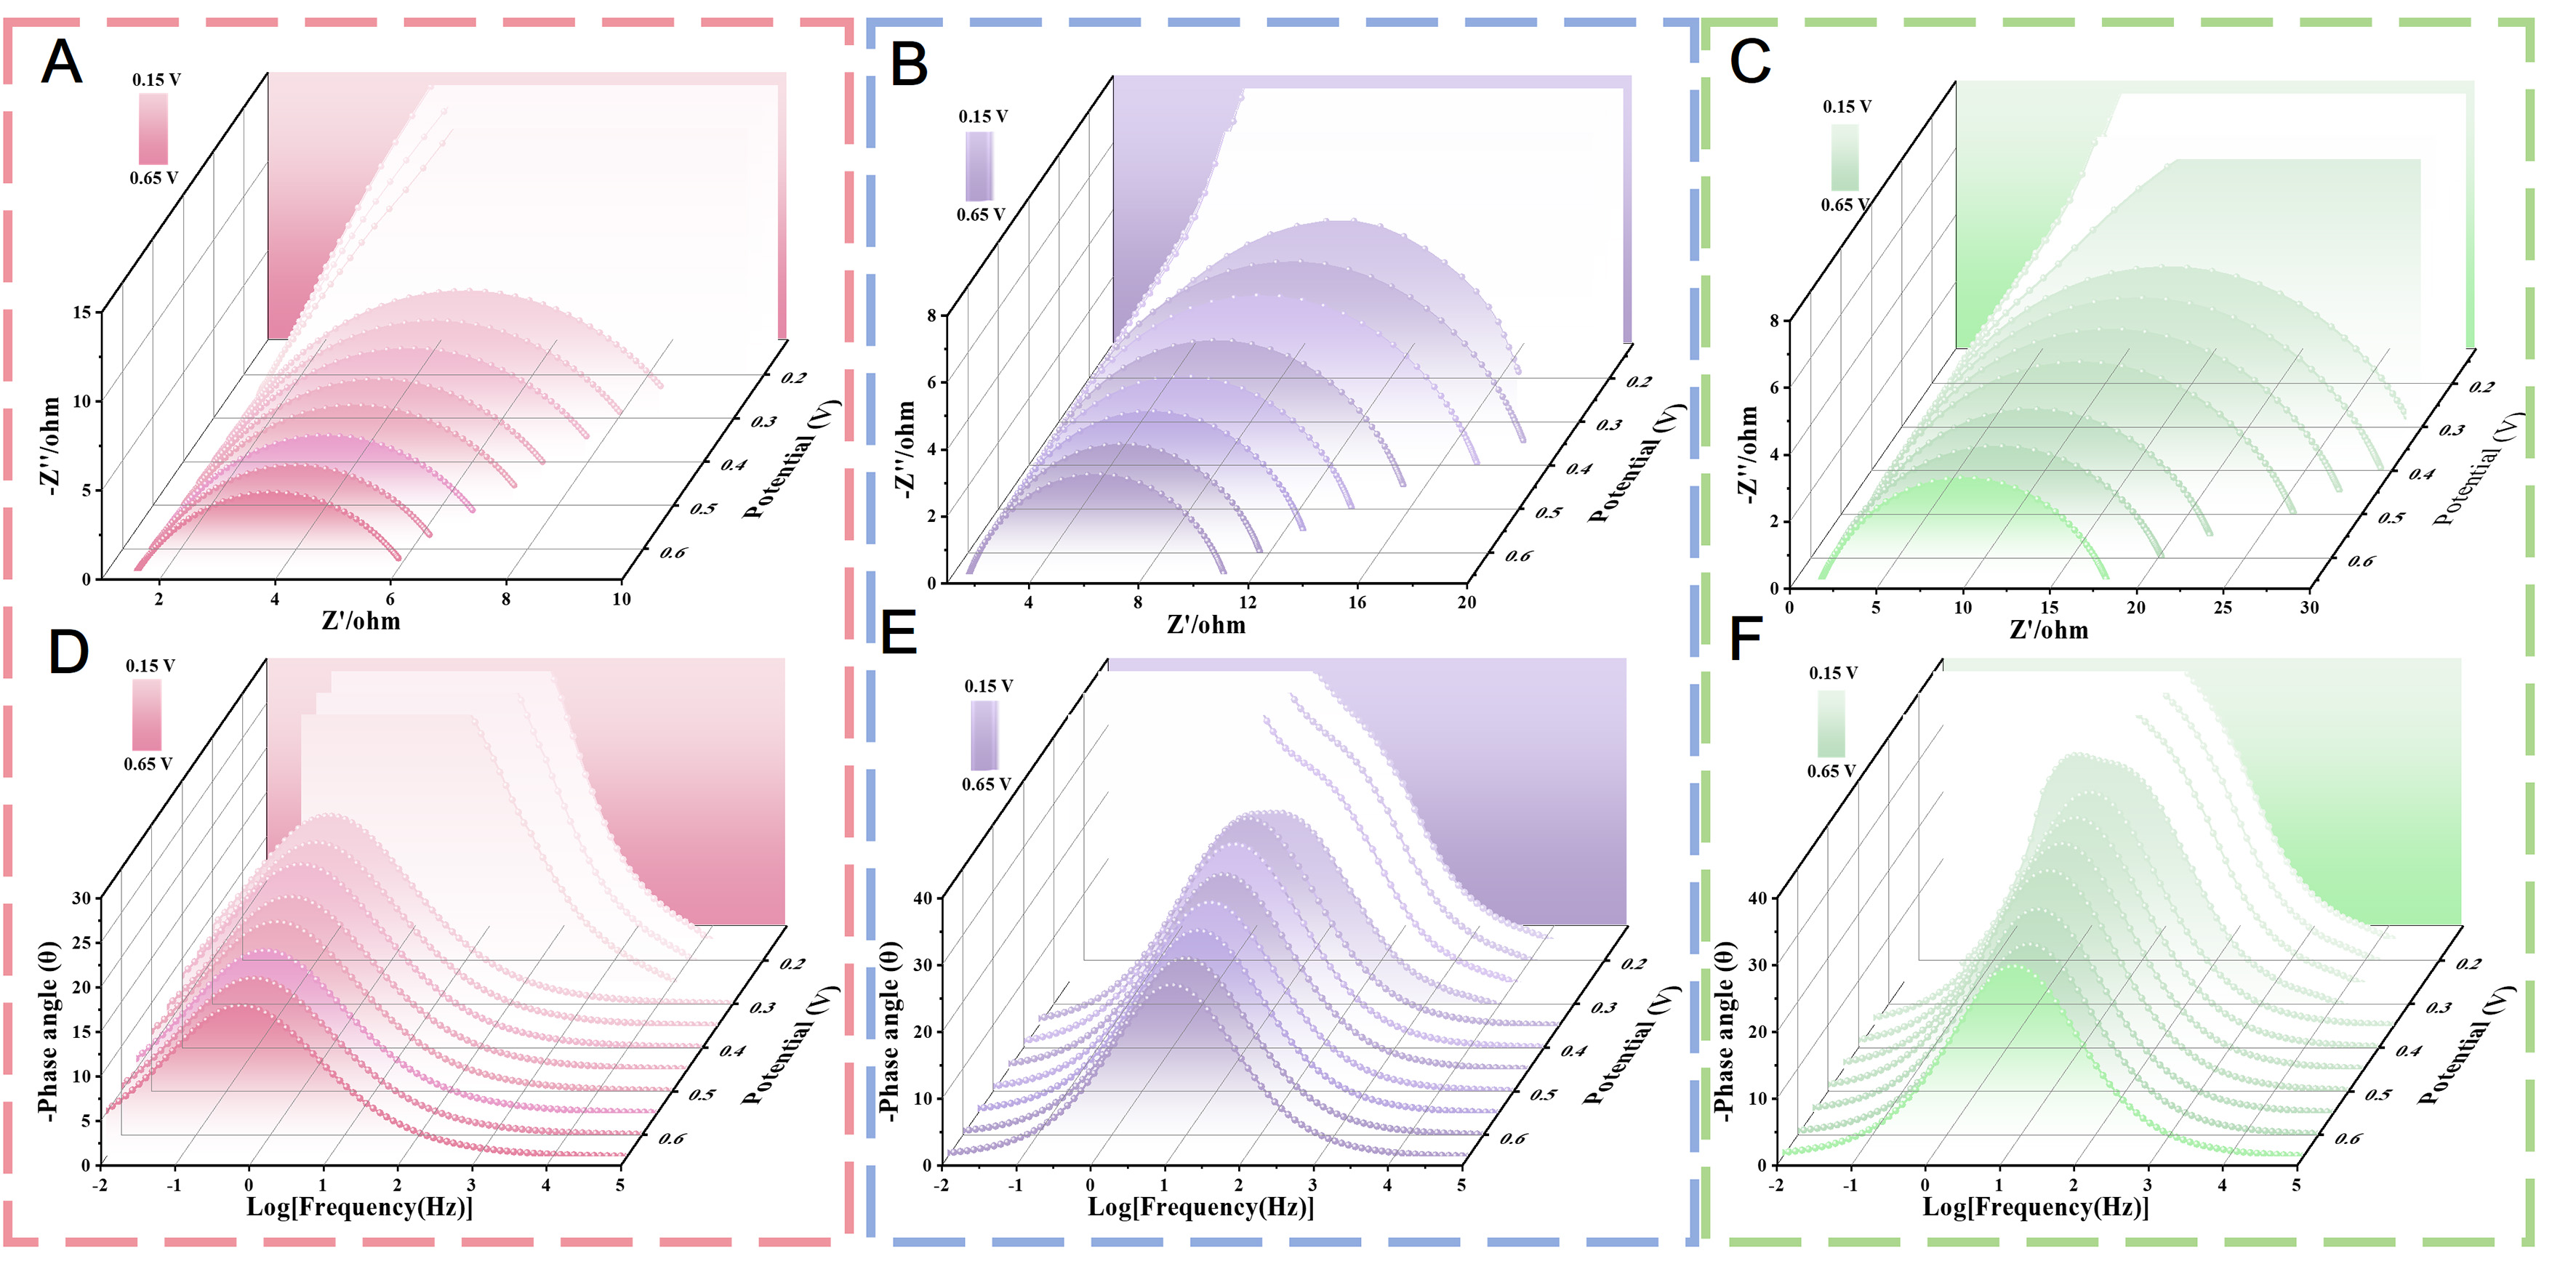
Figure 7. Operando EIS characterization of various catalytic electrodes (potential range: 0.15-0.65 V vs. SCE). (A-C) 3D waterfall plots of Nyquist impedance spectra; (D-F) 3D waterfall plots of Bode phase diagrams; (A and D) Ni2Mo-NiOOH/MoOx; (B and E) Ni2Mo/NF; (C and F) Ni-NiOOH. EIS: Electrochemical impedance spectroscopy; SCE: saturated calomel electrode; NF: nickel foam.

