

fig4
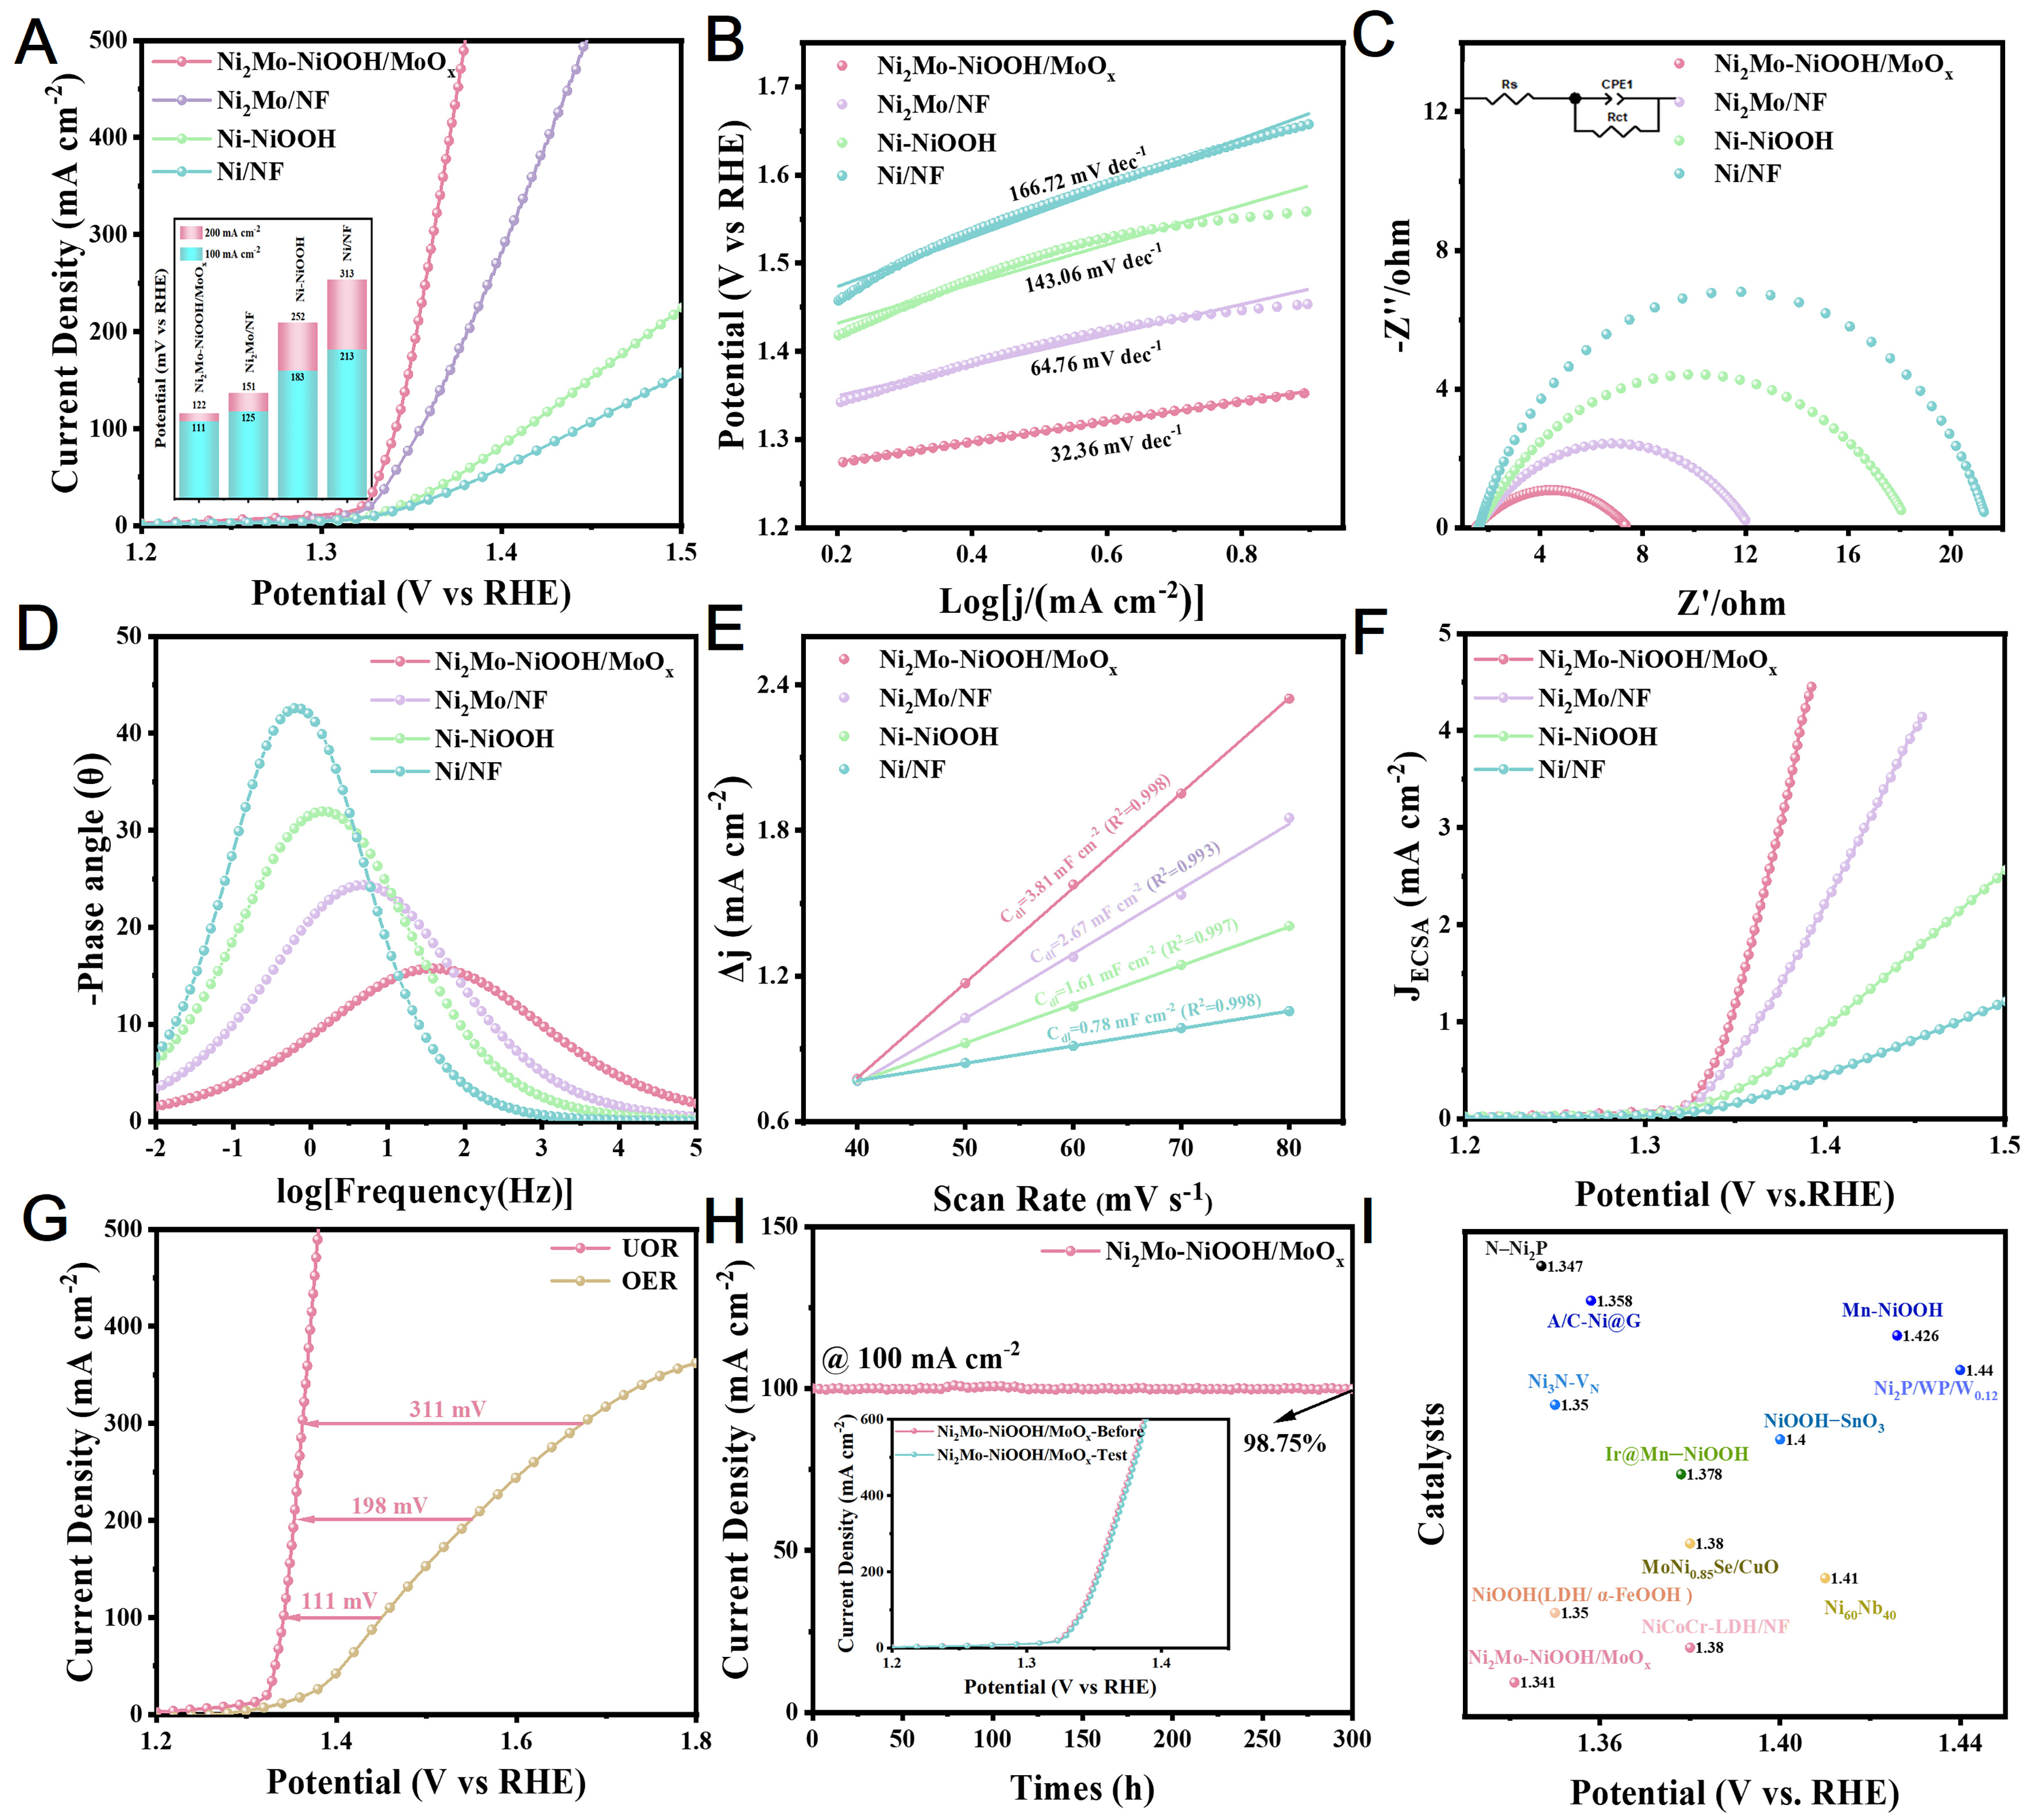
Figure 4. Electrocatalytic UOR performance characterization of various catalysts. (A) LSV curves of Ni2Mo-NiOOH/MoOx, Ni2Mo/NF, Ni-NiOOH and Ni/NF (Inset: Comparison of potential differences relative to the OER equilibrium potential for different catalysts at specific current densities); (B) Corresponding Tafel slope curves (R2 values above 0.95); (C) Nyquist impedance plots and equivalent circuit model; (D) Bode phase plots; (E) Cdl plots (R2 values above 0.99); (F) ECSA-normalized LSV curves; (G) LSV curve comparison between UOR and OER of Ni2Mo-NiOOH/MoOx; (H) 300 h i-t test of Ni2Mo-NiOOH/MoOx at the current density of 100 mA·cm-2, with the LSV curves before and after the stability test shown in the inset; (I) Comparison of the potential of Ni2Mo-NiOOH/MoOx and other UOR catalysts at a current density of 100 mA·cm-2. NF: Nickel foam; LSV: linear sweep voltammetry; UOR: urea oxidation reaction; OER: oxygen evolution reaction; ECSA: electrochemically active surface area; Cdl: double-layer capacitance.

