

fig3
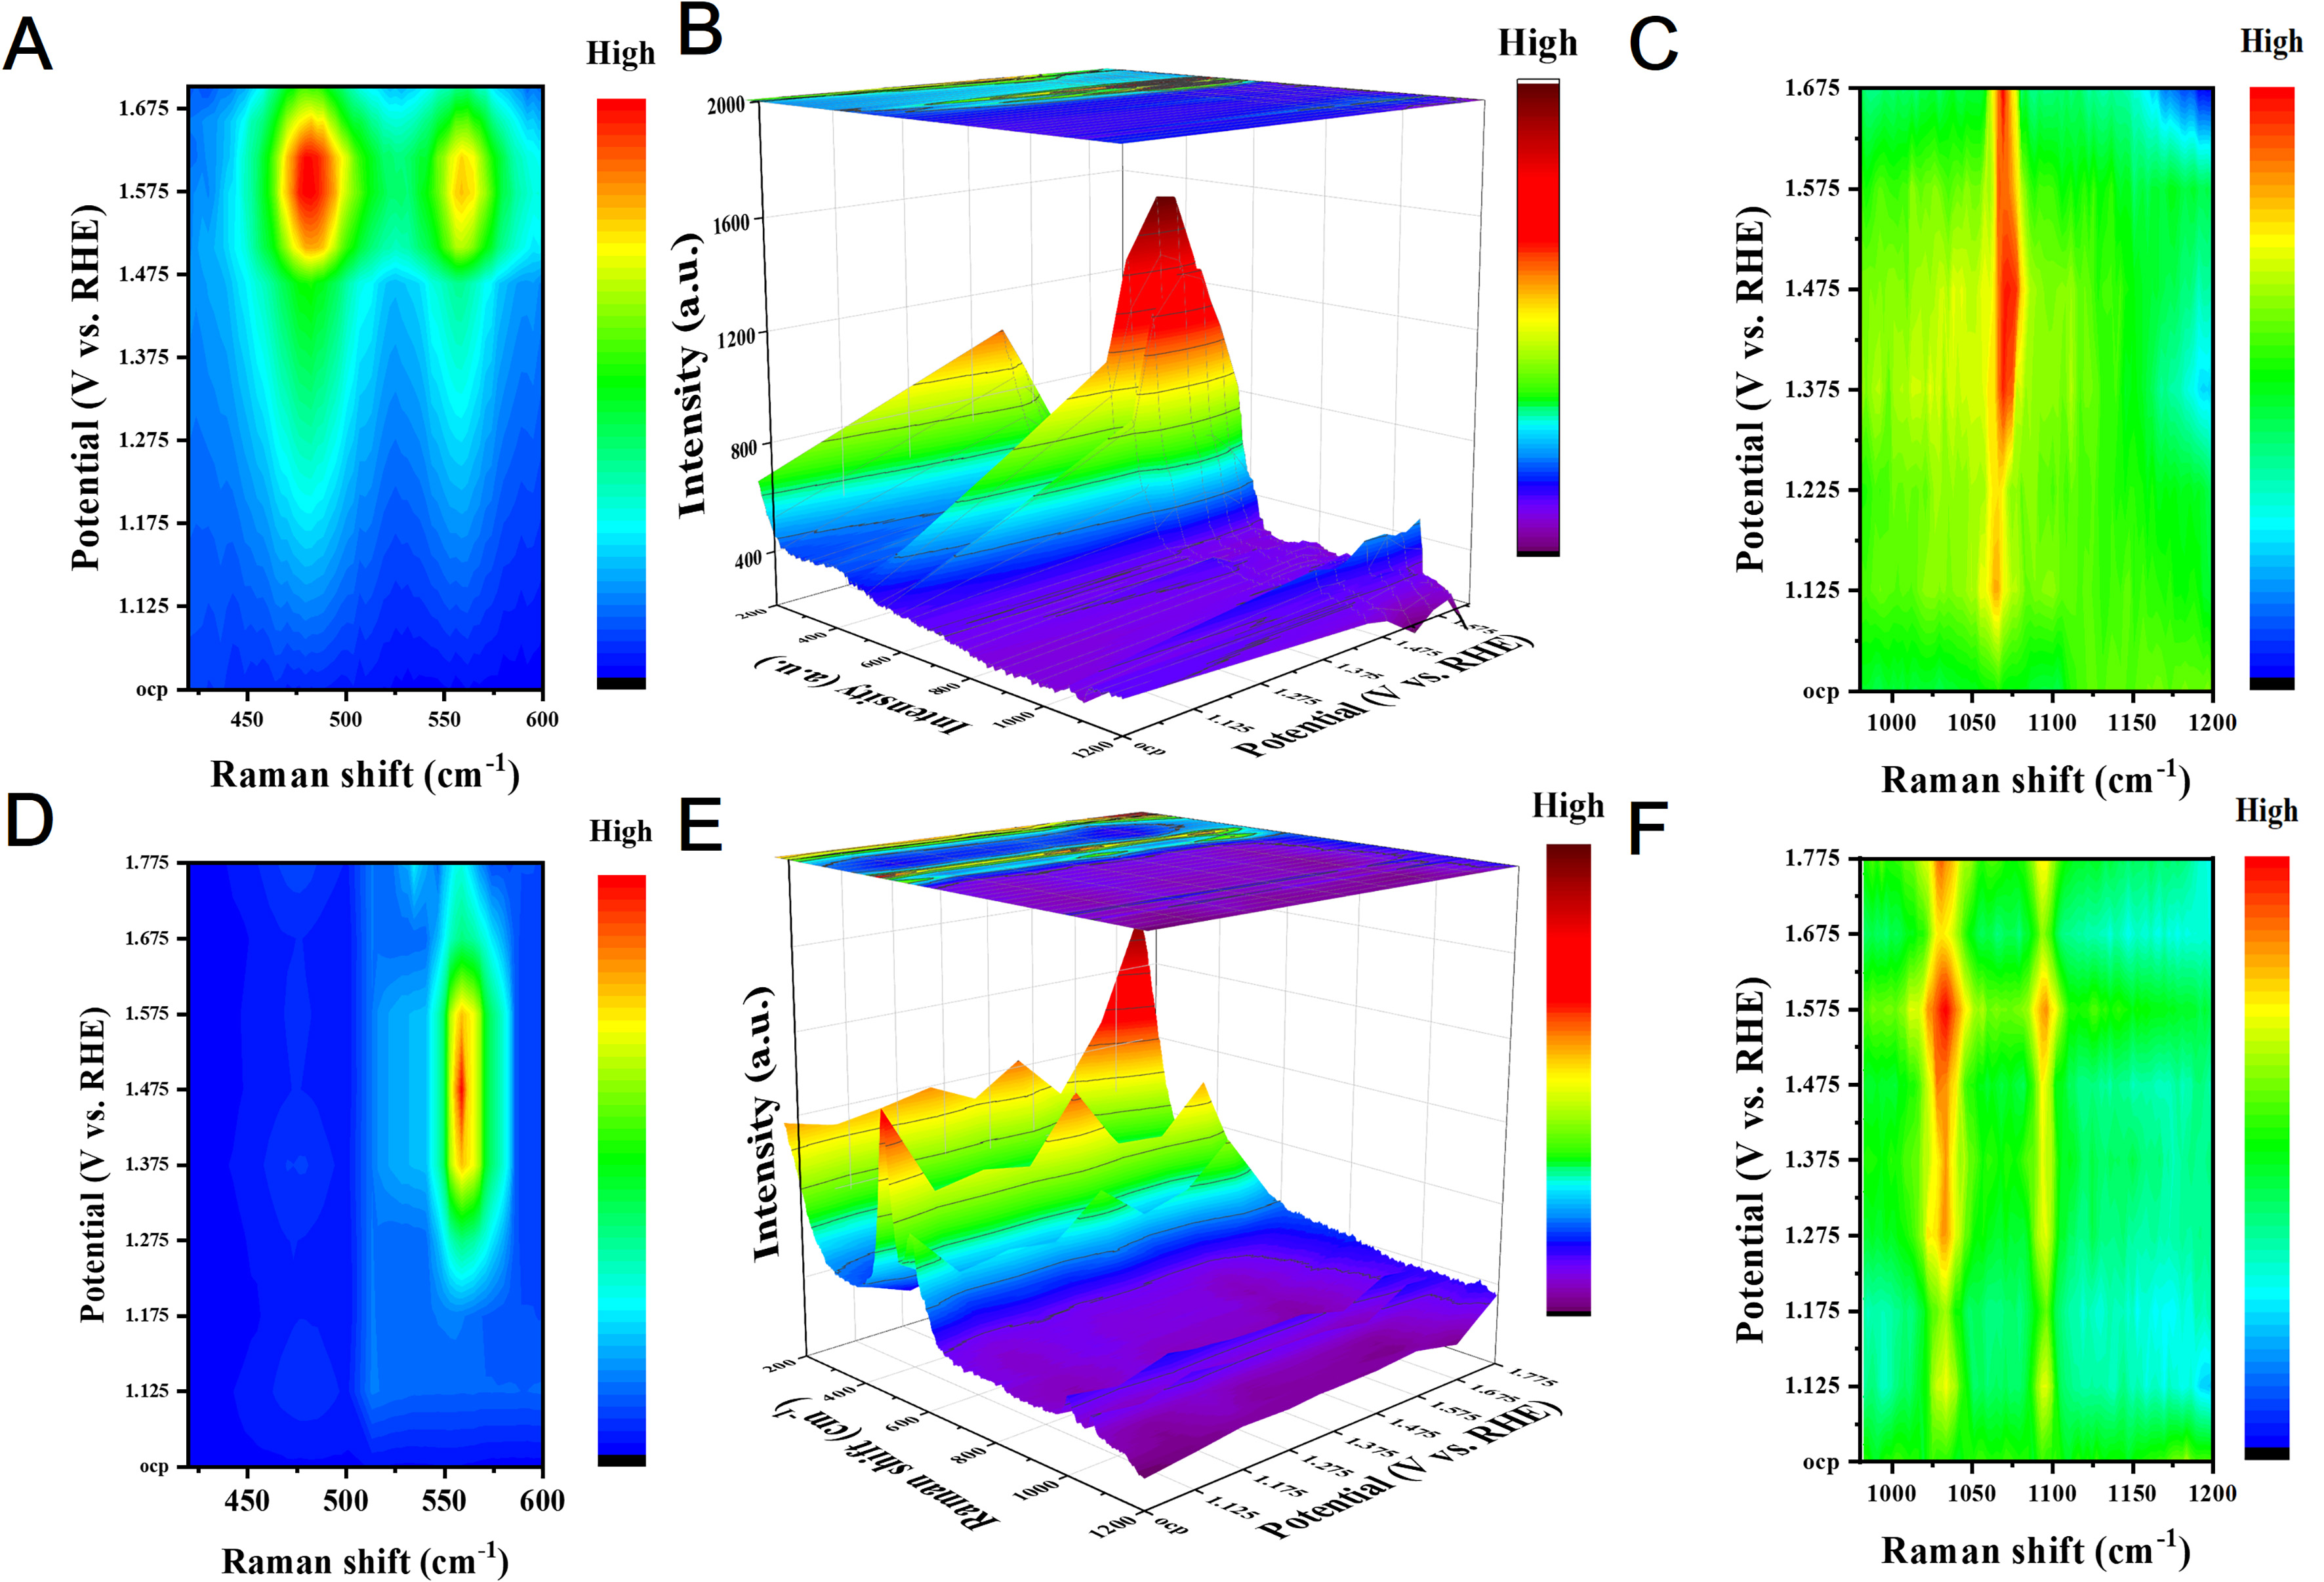
Figure 3. Operando Raman spectra of catalytic electrodes under UOR. (A-C) Operando Raman spectra of Ni-NiOOH at varied anodic potentials: (A) 2D contour plot in the range of 440-600 cm-1; (B) corresponding 3D waterfall plot; (C) 2D contour plot in the range of 980-1,200 cm-1; (D-F) Operando Raman spectra of Ni2Mo-NiOOH/MoOx at varied anodic potentials: (D) 2D contour plot in the range of 440-600 cm-1; (E) corresponding 3D waterfall plot; (F) 2D contour plot in the range of 980-1,200 cm-1. RHE: Reversible hydrogen electrode; UOR: urea oxidation reaction.

