

fig4
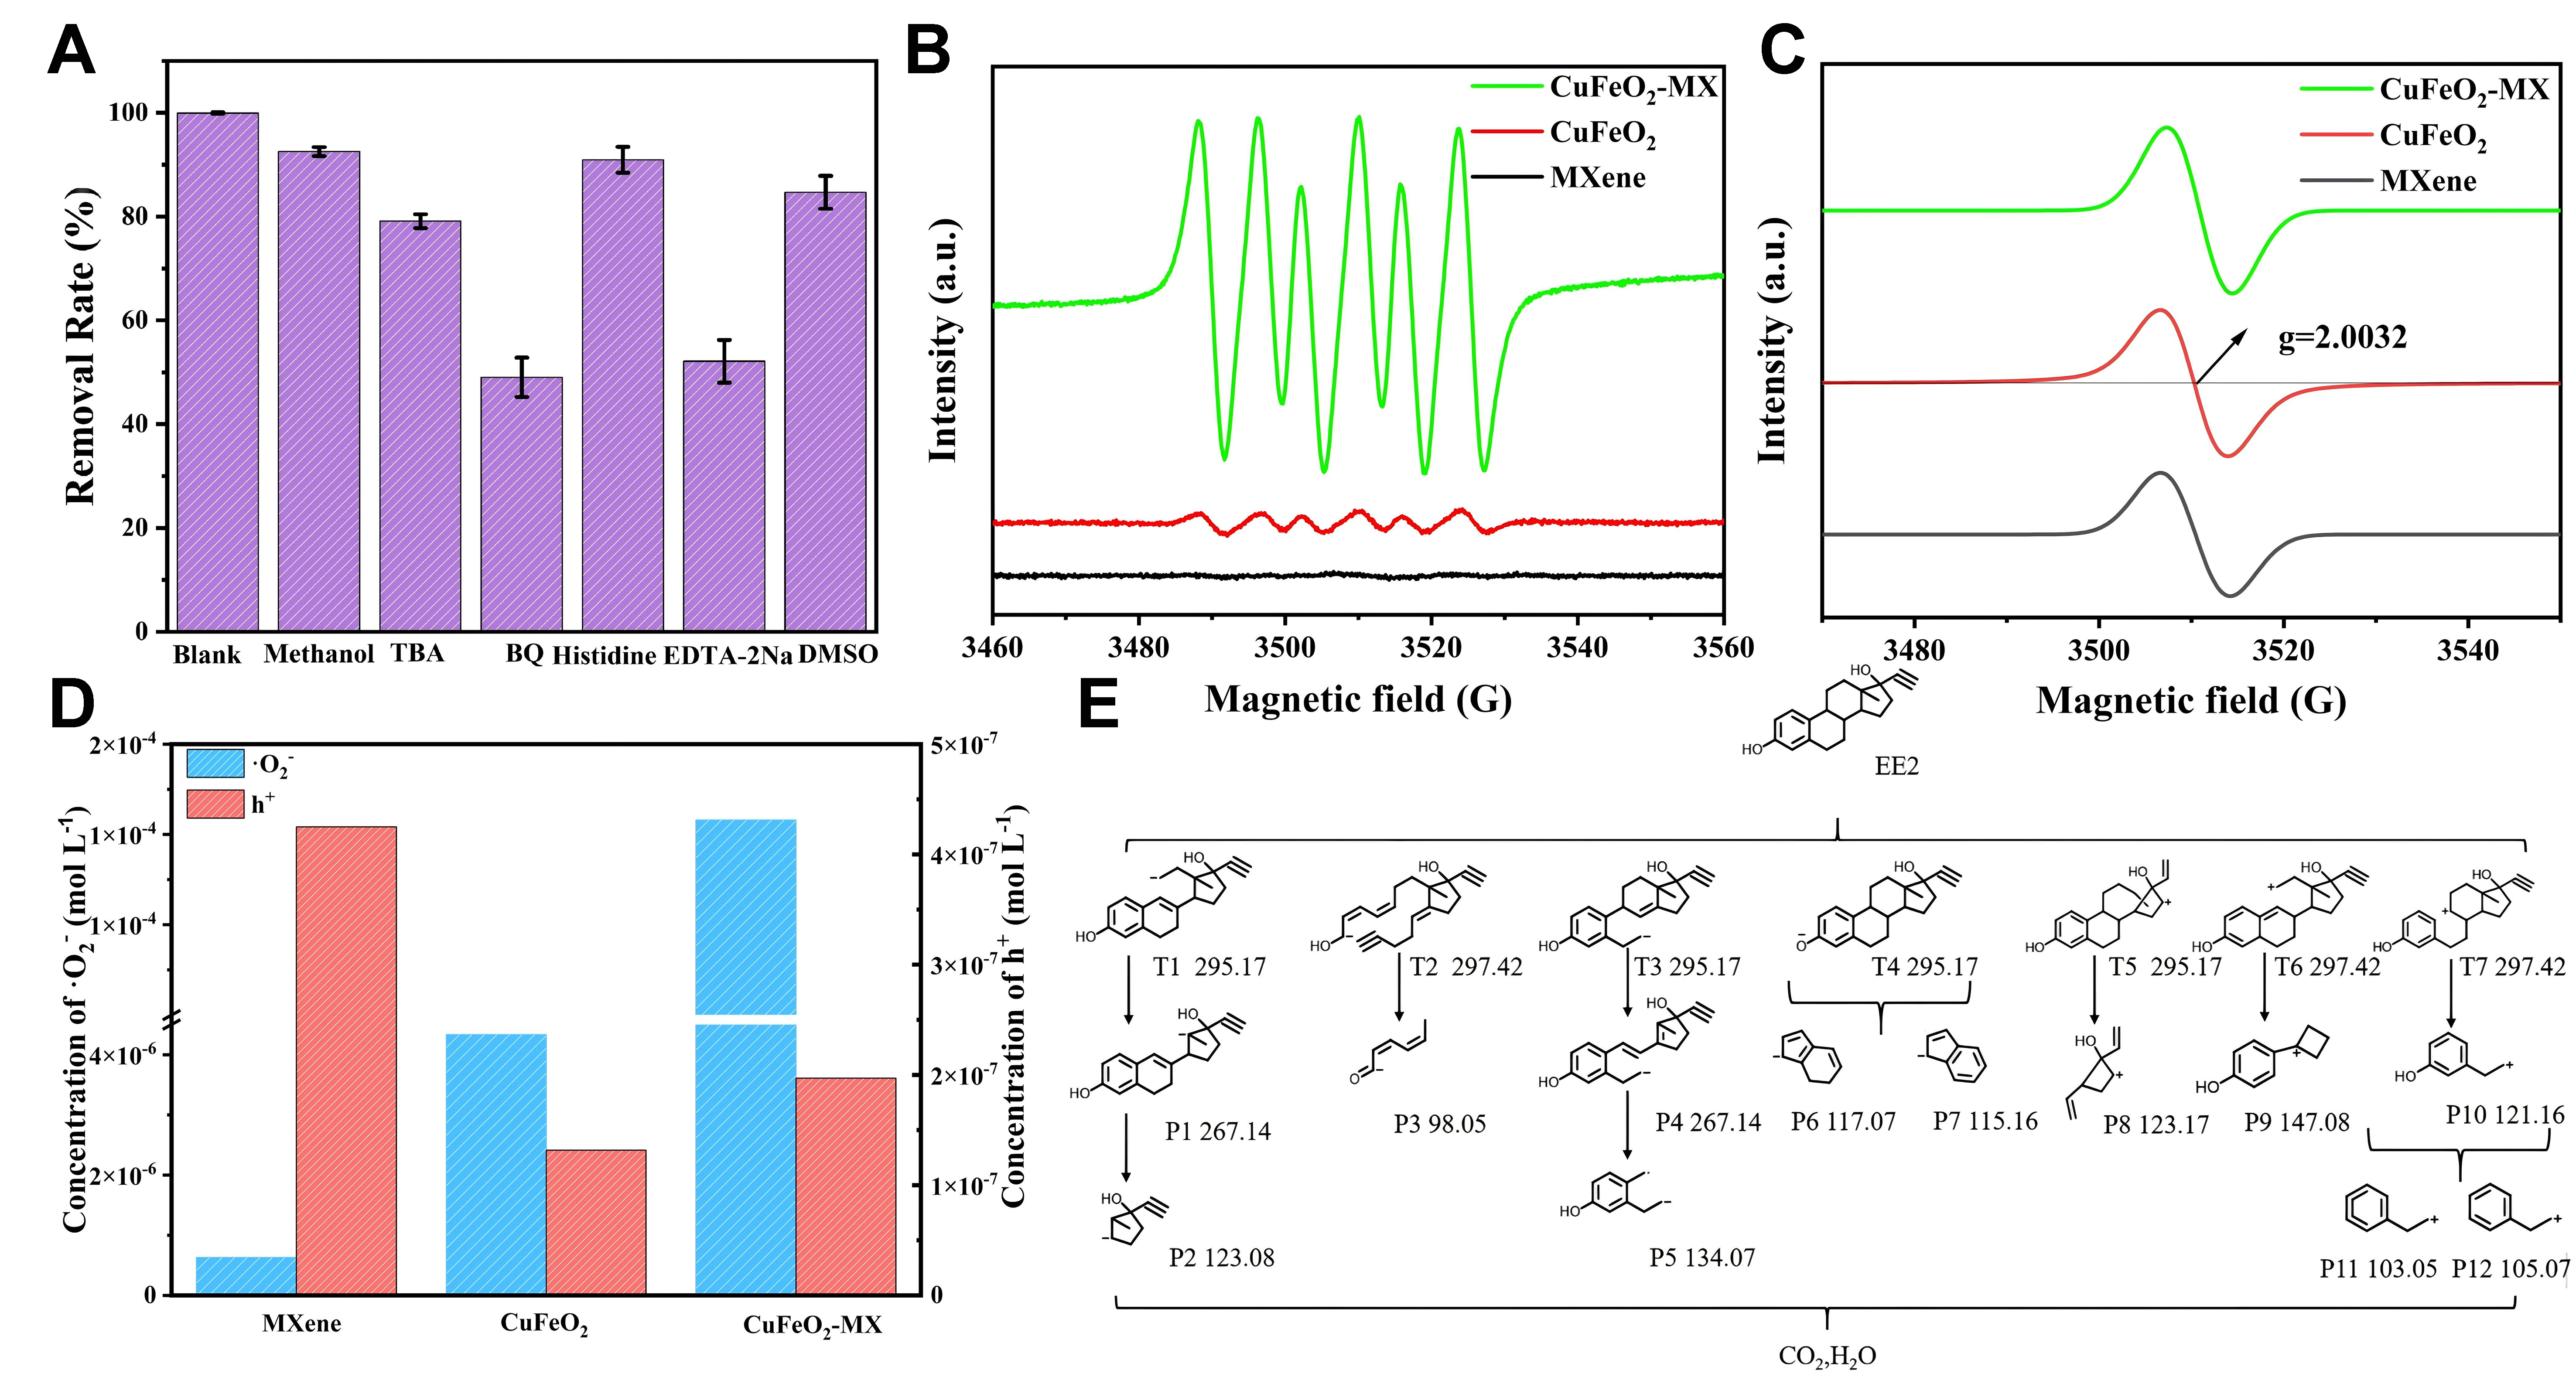
Figure 4. (A) Scavenging of reactive species during EE2 degradation by CuFeO2–MX; EPR spectra of (B) •O2- and (C) h+; (D) Concentrations of h+ and •O2- during the degradation process; (E) Possible intermediates and reaction pathways during EE2 degradation by CuFeO2–MX. Data are presented as mean ± SD (n = 3). EE2: 17α-Ethynylestradiol; CuFeO2–MX: CuFeO2–MXene; EPR: electron paramagnetic resonance; SD: standard deviation

