
fig6
From: Genome-wide cross-trait analysis identified shared etiology between Alzheimer’s disease and migraine
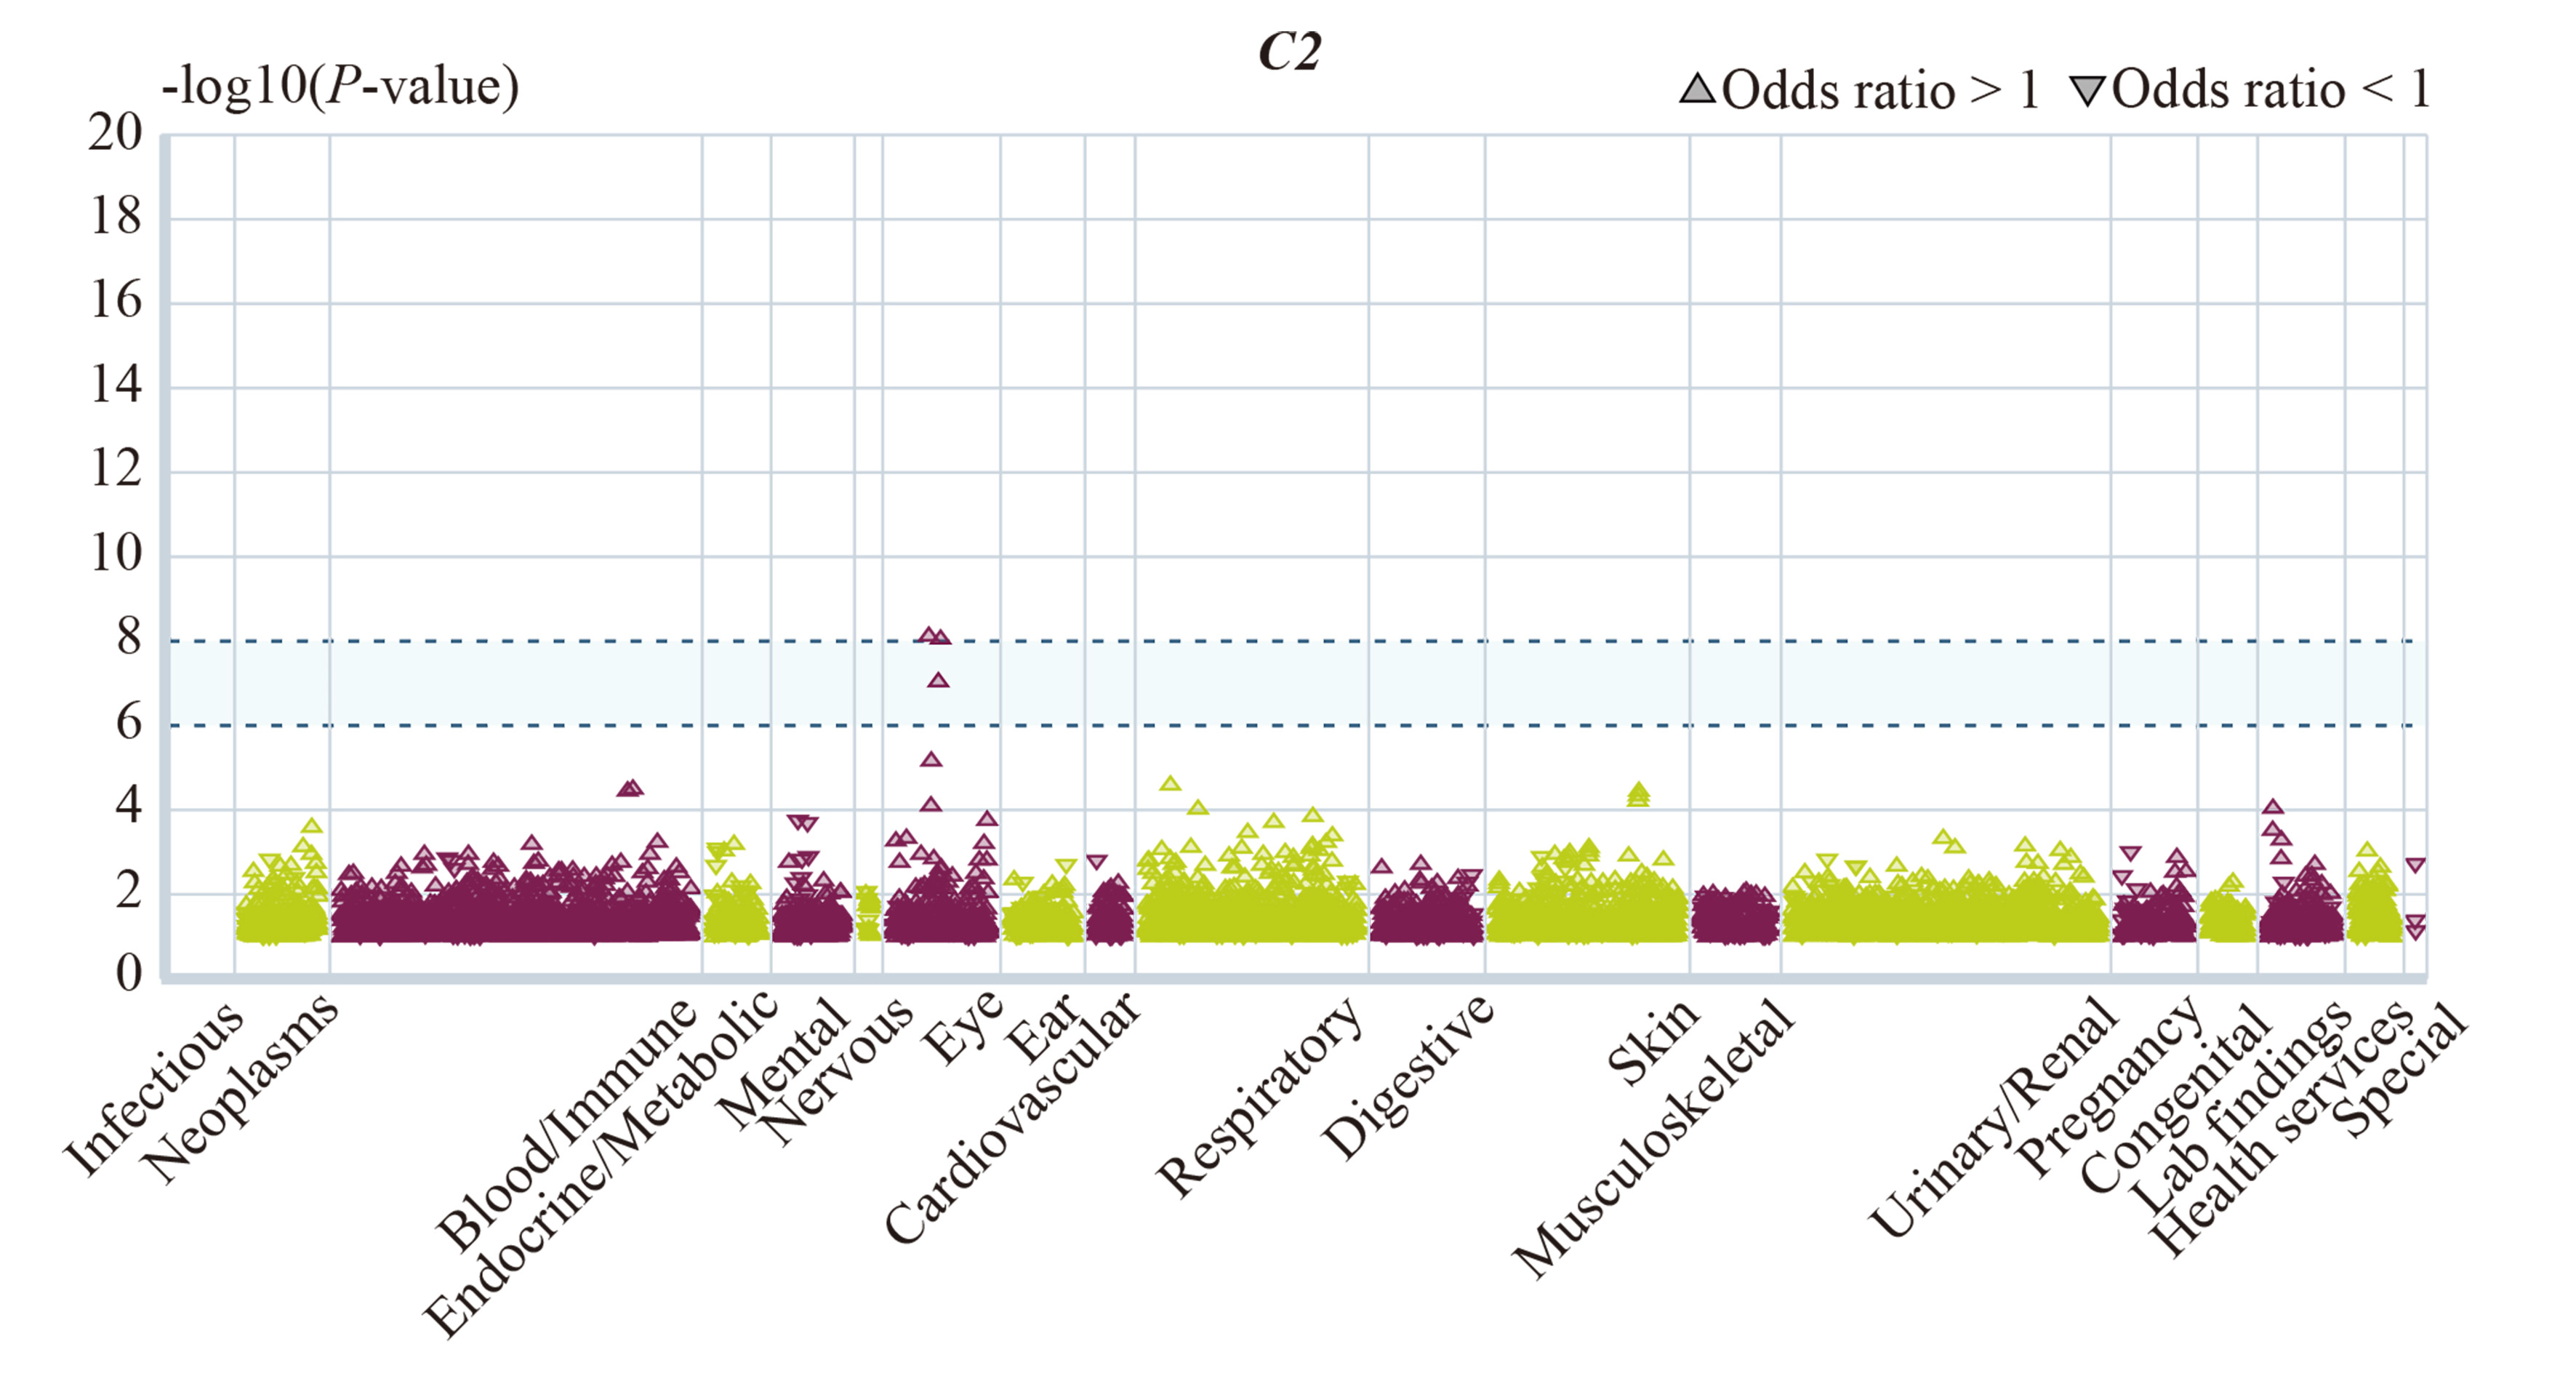
Figure 6. Phenome-wide association studies for the candidate gene target by AstraZeneca portal. The Manhattan plot for PheWAS based on C2. The first gray dotted line represents the significance threshold in the Manhattan plots (-log10 P = 8). The second gray dotted line represents the suggestive threshold in the Manhattan plots (-log10 P = 6). PheWAS: Phenome-wide association study.