
fig5
From: Genome-wide cross-trait analysis identified shared etiology between Alzheimer’s disease and migraine
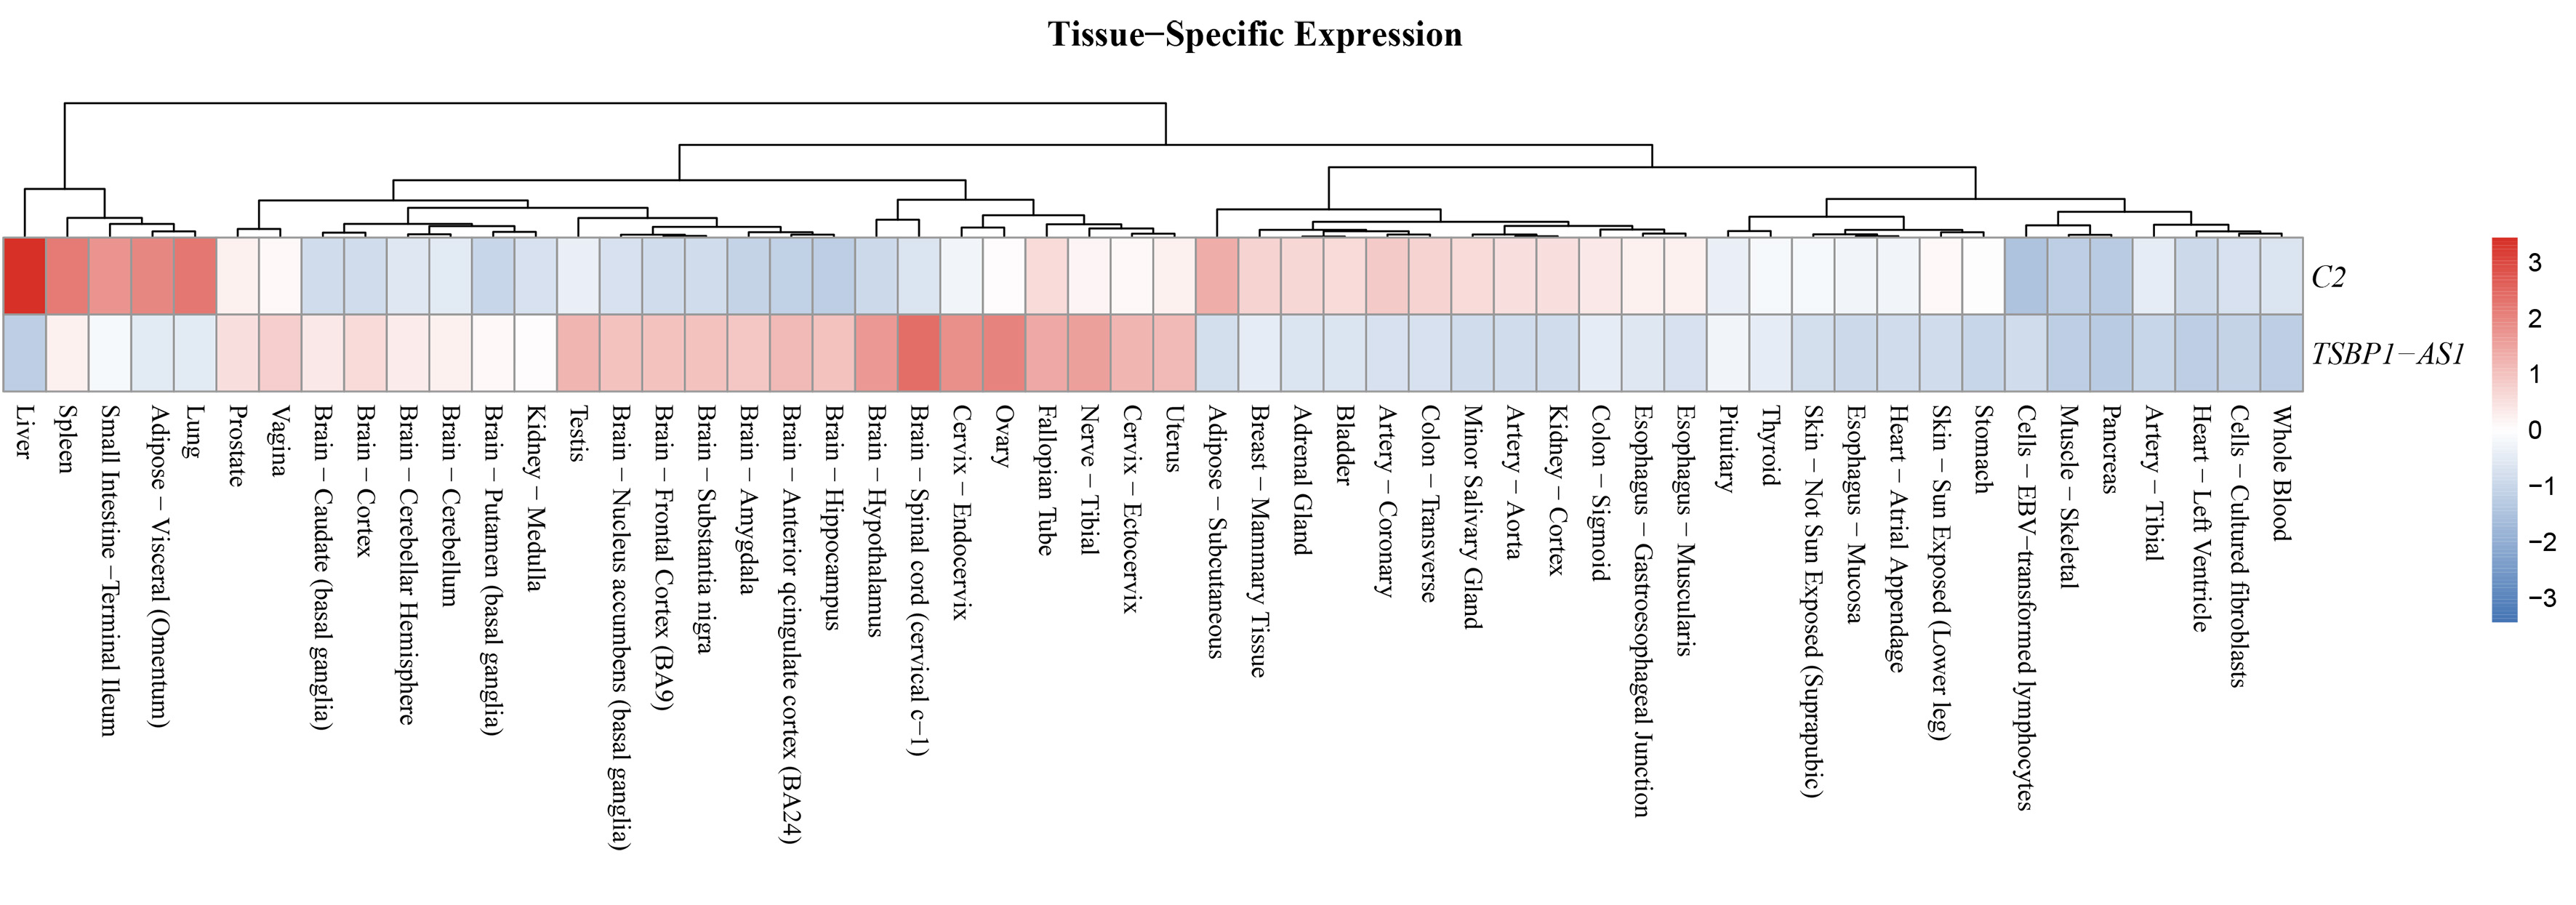
Figure 5. Tissue-specific expression profiles of C2 and TSBP1-AS1. The heatmap illustrates the relative expression levels of the two shared genes across 54 human tissues derived from the GTEx database. Raw median TPM values were log2(TPM + 1) transformed and subsequently row-scaled (Z-score) to highlight the distribution pattern for each gene independently. The color gradient from blue to red represents relatively low to high expression levels. The top dendrogram denotes the hierarchical clustering of tissues based on expression similarity. TPM: Transcripts per million.