
fig1
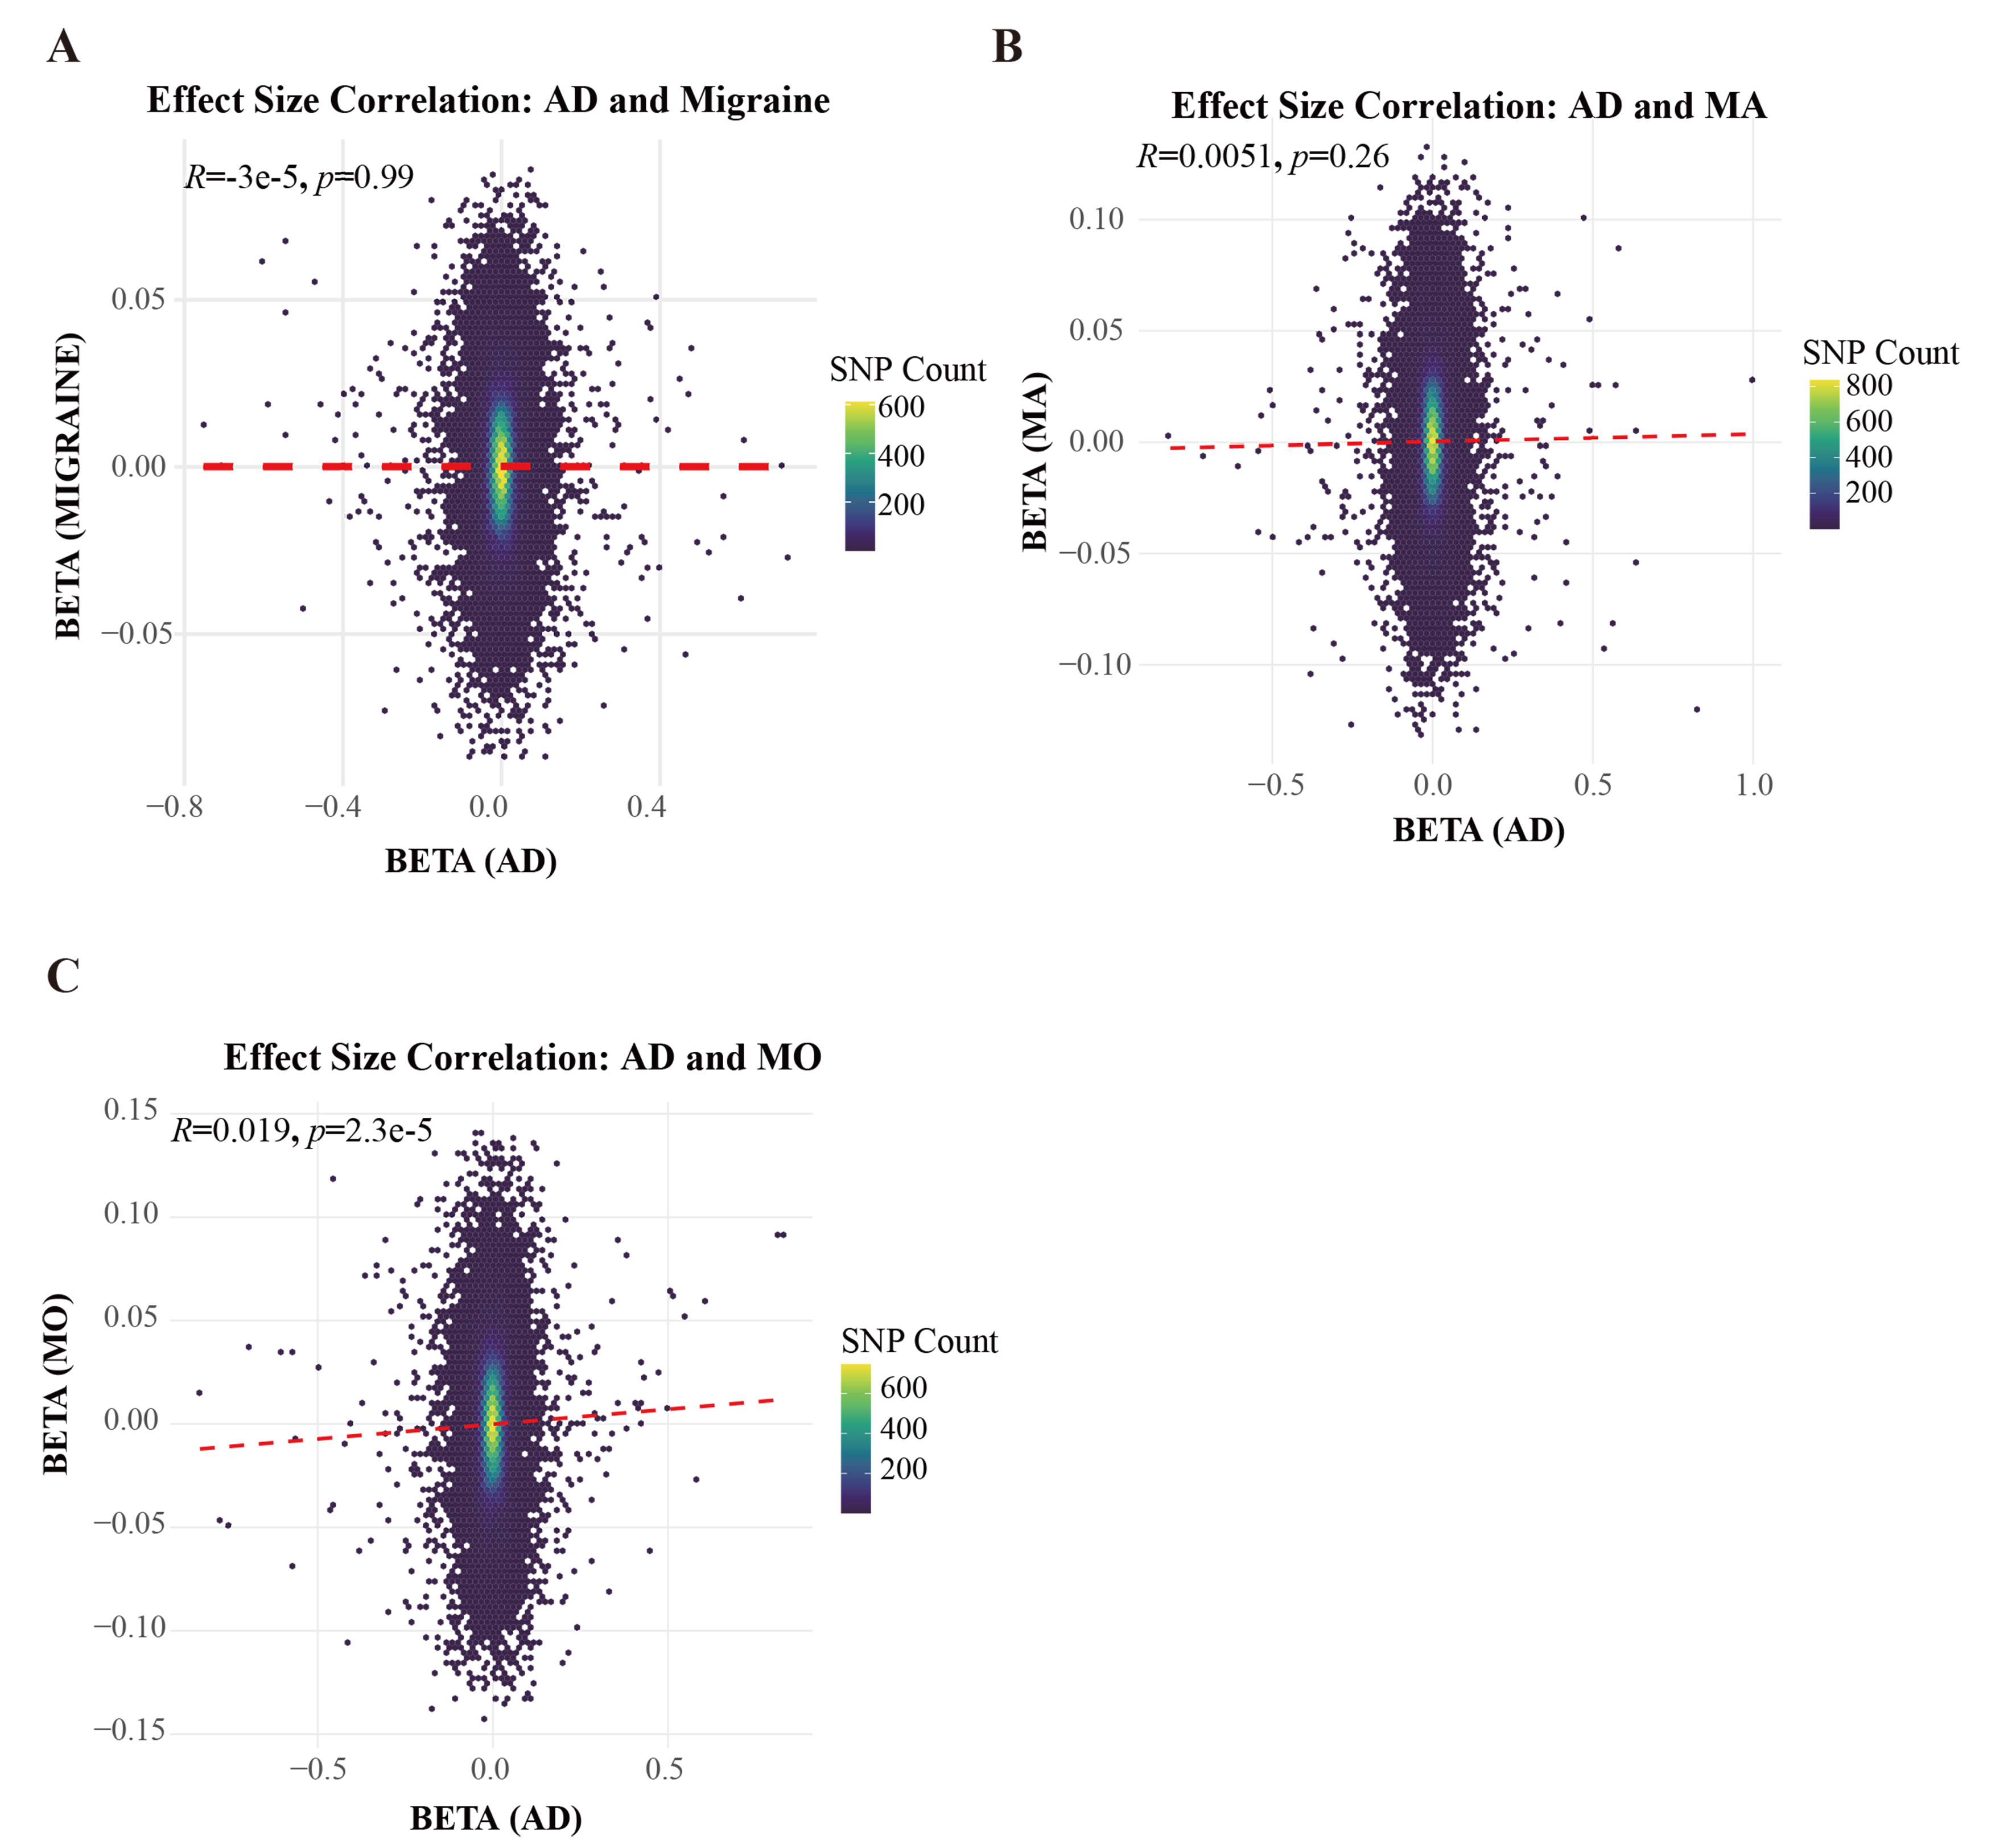
Figure 1. Global effect size correlations between AD and migraine subtypes. (A-C) Hexbin density scatter plots illustrating the distribution of aligned variant effect sizes for AD (x-axis) against (A) overall migraine, (B) MA, and (C) MO (y-axis). To assess systematic biases, the analyses were strictly restricted to background variants not significantly associated with either trait (single-trait P > 0.05 for both AD and the respective migraine phenotype), with 50,000 SNPs randomly down-sampled for visualization. The color gradient indicates the number of SNPs within each hexagonal bin. Red dashed lines represent the linear regression fit. Pearson correlation coefficients (R) and nominal P-values are provided for each comparison. AD: Alzheimer’s disease; MA: migraine with aura; MO: migraine without aura; SNPs: single-nucleotide polymorphisms.