
Reduced retinal thickness and risk of Alzheimer’s disease: a bidirectional two-sample Mendelian randomization study
 0
0 Abstract
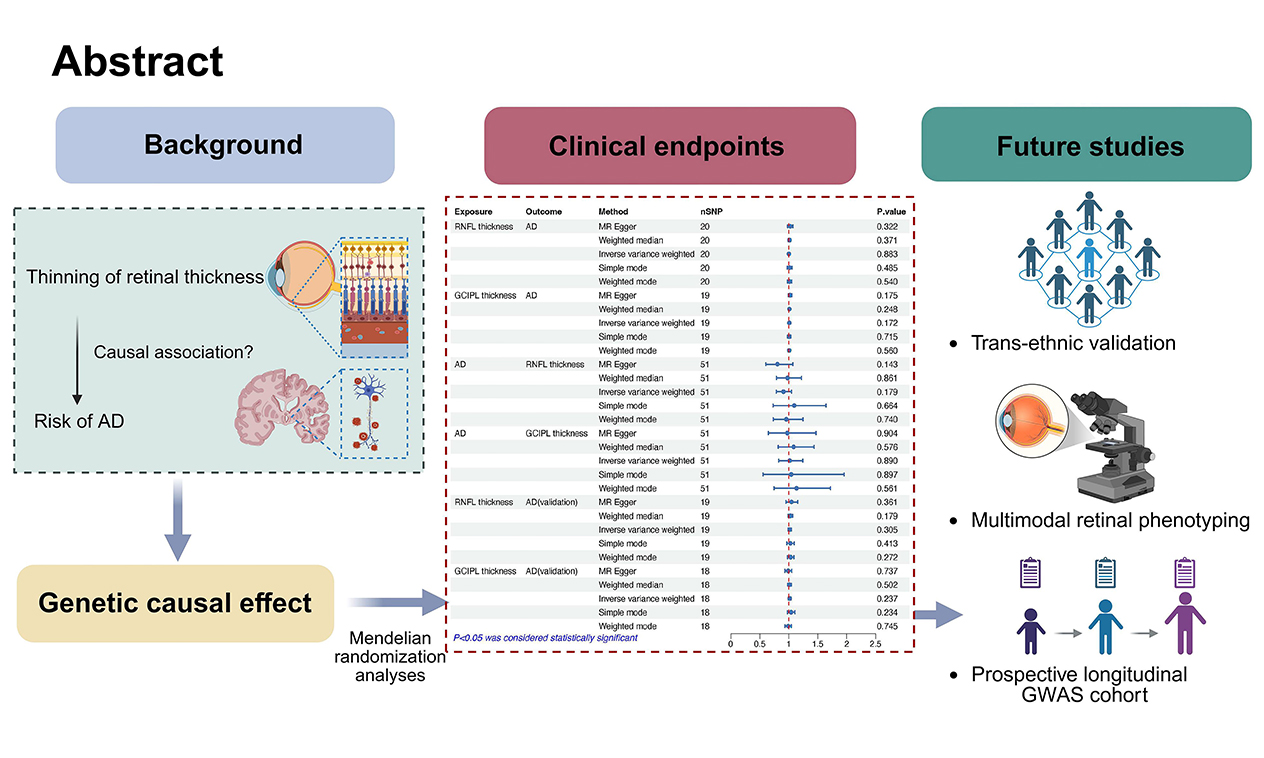
Objectives: Observational studies have suggested associations between retinal layer thinning and increased susceptibility to Alzheimer’s disease (AD), but causal inference remains inconclusive. This study aimed to investigate potential genetic causality between inner retinal layer (IRL) thickness, specifically the retinal nerve fiber layer (RNFL) and the ganglion cell inner plexiform layer (GCIPL), and AD risk.
Methods: We conducted a bidirectional two-sample Mendelian randomization (MR) analysis using genome-wide association study (GWAS) summary statistics for RNFL/GCIPL thickness (n = 31,434; UK Biobank) and AD status (39,106 cases vs. 401,577 controls; European Alzheimer and Dementia Biobank). Replication was performed in an independent AD cohort (35,274 cases vs. 59,163 controls). The inverse-variance weighted (IVW) method was used as the primary analytical approach.
Results: No significant associations were found between retinal thickness and AD risk (RNFL: odds ratio [OR]IVW = 1.001, 95% confidence interval [CI] = 0.986-1.017, P = 0.883; GCIPL: ORIVW = 1.008, 95% CI = 0.997-1.019, P = 0.172). Reverse MR analyses also showed no causal effect of genetic liability to AD on retinal thickness (RNFL: ORIVW = 0.907, 95% CI = 0.786-1.046, P = 0.179; GCIPL: ORIVW = 1.014, 95% CI = 0.828-1.242, P = 0.890). These findings were consistent in replication analyses (RNFL: ORIVW = 1.015, 95% CI = 0.987-1.043, P = 0.305; GCIPL: ORIVW = 1.014, 95% CI = 0.991-1.037, P = 0.237).
Conclusion: This MR analysis found no evidence of a causal genetic relationship between IRL thickness variations and AD. Future investigations should focus on trans-ethnic populations, longitudinal studies, and multimodal retinal phenotyping within GWAS cohorts to further clarify this relationship.
Keywords
INTRODUCTION
Alzheimer’s disease (AD) is the most prevalent neurodegenerative condition globally and the leading cause of dementia, posing one of the most significant socioeconomic health challenges of the 21st century[1]. Its pathological hallmarks include the accumulation of extracellular amyloid-β aggregates and intracellular neurofibrillary tangles composed of hyperphosphorylated tau isoforms[2]. Despite decades of research yielding major advances in our understanding of AD pathogenesis and the development of therapeutic approaches, current pharmacological interventions offer only limited clinical benefits. This is largely due to the fact that most diagnoses occur at late stages, when irreversible neuronal damage has already occurred. There is a broad consensus that early intervention may help slow disease progression[3].
Identifying modifiable risk factors and reliable biomarkers during the prodromal stages of AD is critical for enabling preventive strategies and tracking disease progression[3]. At present, biomarkers derived from positron emission tomography and cerebrospinal fluid (CSF) assays are considered the gold standards for AD diagnosis. However, their application in early-stage detection is constrained by high costs, invasive procedures, and technical complexity[4]. Given that the neuroretina and optic tract originate from diencephalic structures, they are classified as part of the central nervous system[5]. Optical coherence tomography (OCT), a non-invasive imaging technique, enables cost-effective, high-resolution measurement of neuroretinal degeneration and has become an indispensable tool in neurodegenerative research[6]. Increasing attention has been directed toward the relationship between retinal changes and AD, owing to their shared etiological factors, overlapping pathological features, and common molecular mechanisms[7]. The retinal nerve fiber layer (RNFL) and ganglion cell-inner plexiform layer (GCIPL) closely resemble cerebral white and gray matter, respectively, making them promising candidates for non-invasive biomarkers of AD progression[3]. Furthermore, emerging longitudinal evidence indicates that microstructural retinal changes may occur decades before clinical symptoms appear[8]. Nevertheless, the clinical utility of retinal biomarkers for AD diagnosis and risk stratification remains an open question in neurodegeneration research[3,8,9].
Mendelian randomization (MR) is a statistical approach that uses genetic variants, primarily single nucleotide polymorphisms (SNPs), as instrumental variables (IVs) to infer causal associations between modifiable exposures and health outcomes based on observational data. This approach leverages the random assortment of genetic variants according to Mendel’s laws, which helps balance unmeasured confounders across genotype-defined exposure groups. MR thus mimics the design of randomized controlled trials (RCTs) in observational settings, reducing biases such as reverse causation and residual confounding - common limitations of traditional epidemiological studies when RCTs are infeasible. Additionally, MR enables the assessment of long-term exposure effects that are often not detectable in short-term RCTs[10-12]. When conducted rigorously and based on validated IV assumptions, MR analyses can provide robust evidence to support the prioritization of clinical trials, guide pharmaceutical development, and inform clinical and public health policy[10]. In this two-sample MR study, we used genome-wide association study (GWAS) summary statistics to assess the potential genetic causal relationship between inner retinal layer (IRL) thickness, specifically RNFL and GCIPL measurements, and susceptibility to AD.
METHODS
Study design
A bidirectional two-sample MR framework was employed to assess the genetic causal relationships between IRL thickness variations and AD risk. All analyses strictly followed the Strengthening the Reporting of Observational Studies in Epidemiology Using Mendelian Randomization (STROBE-MR) guidelines[13]. This study adhered to the core MR assumptions, which include: (i) Relevance: genetic instruments are significantly associated with the exposure of interest; (ii) Independence: genetic instruments are not associated with known or potential confounders; (iii) Exclusion restriction: genetic variants influence the outcome solely through the exposure [Figure 1][14].
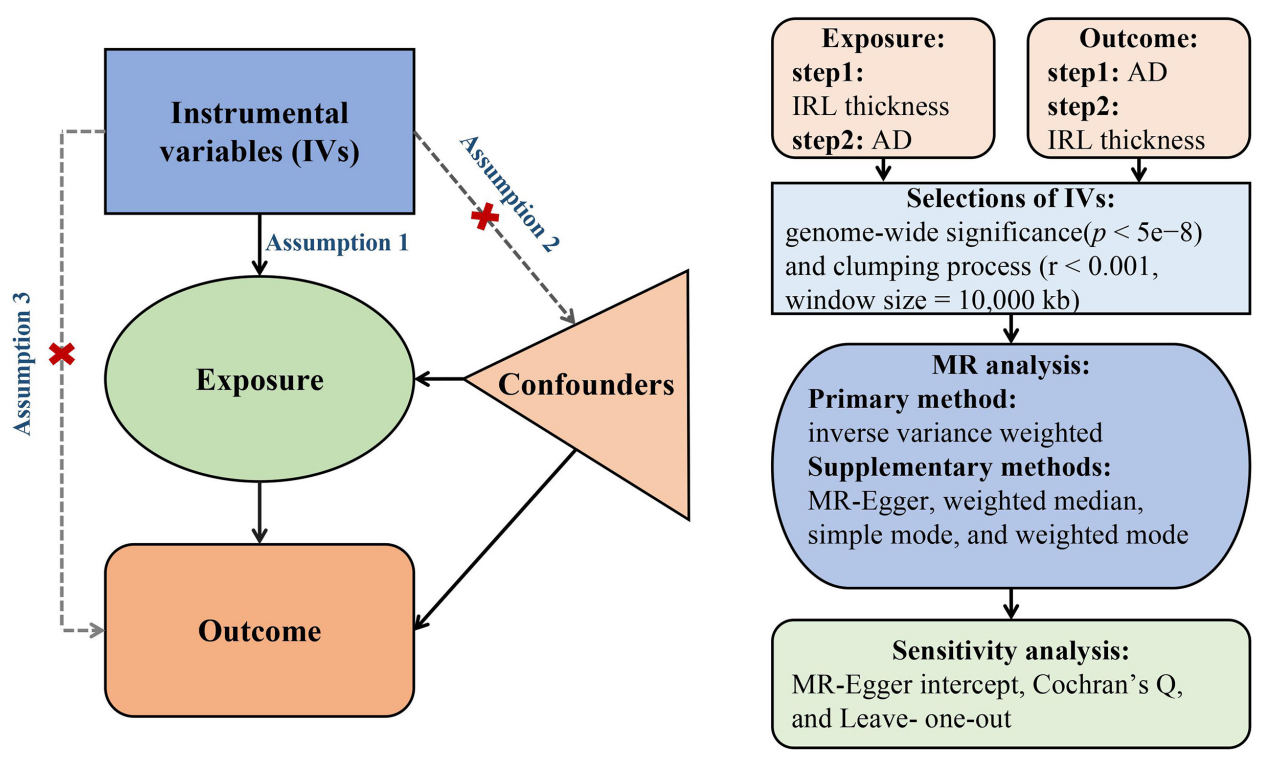
Figure 1. Flowchart of the MR study based on three core assumptions: Assumption 1 (Relevance): genetic instruments are significantly associated with the target exposure; Assumption 2 (Independence): genetic instruments are not correlated with known or potential confounders; Assumption 3 (Exclusion restriction): genetic variants influence outcomes solely through the specified exposure. Step 1 evaluates the causal effect of IRL thickness on AD, while Step 2 assesses the reverse causal effect of AD on IRL thickness. MR: Mendelian randomization; IRL: inner retinal layer; AD: Alzheimer’s disease.
Data sources
We obtained summary-level statistics for RNFL thickness, GCIPL thickness, and AD from published GWAS. The RNFL and GCIPL thickness datasets were derived from the UK Biobank (UKB) study by Currant et al. [6], which involved OCT measurements from 31,434 participants. Their analysis employed an additive linear regression model adjusted for relevant ocular parameters, technical covariates, and demographic factors. The primary AD dataset was sourced from the European Alzheimer & Dementia Biobank (EADB) consortium, comprising 39,106 clinically confirmed AD cases and 401,577 population-matched controls[15]. For replication, we included additional GWAS data from Kunkle et al., which featured 35,274 neuropathologically confirmed AD cases and 59,163 controls[16]. Full methodological details for these studies are available in the respective publications[6,15,16]. To reduce potential population stratification bias, all analyses were restricted to individuals of European ancestry.
Genetic instruments
Genome-wide significant variants (p < 5e-8) from the exposure-specific GWAS were selected as IVs. Linkage disequilibrium (LD) clumping was performed using an R2 threshold of < 0.001 or a physical distance cutoff of 10,000 kb to ensure independence among SNPs. To evaluate potential horizontal pleiotropy, all candidate SNPs were screened using PhenoScanner V2[17] and the GWAS Catalog (https://www.ebi.ac.uk/gwas/)[18]. Instrument strength was assessed by calculating F-statistics for each IV using the formula:
Statistical analysis
Genetic instruments were selected from outcome-associated GWAS summary data using stringent criteria. The inverse-variance weighted (IVW) method was the primary analysis approach, assuming balanced pleiotropy[21]. Secondary methods included MR-Egger regression, weighted median, and mode-based estimators. MR-Egger enables detection of directional pleiotropy through its intercept, though with reduced statistical power[22]. The weighted median method provides valid estimates when over 50% of the IVs are valid[23]. The simple mode estimator is robust to pleiotropy but less precise[24], whereas the weighted mode requires careful bandwidth selection for kernel density estimation[25]. Heterogeneity among IVs was evaluated using Cochran’s Q test for both IVW and MR-Egger methods (P > 0.05 indicating nonsignificance)[22].Horizontal pleiotropy was assessed by the MR-Egger intercept and MR-PRESSO global test, with pleiotropic effects considered as absent at P > 0.05[22,26]. Leave-one-out sensitivity analyses were conducted by sequentially excluding each SNP to evaluate the stability of the results. Bidirectional causality was further examined using the MR Steiger directionality test, excluding SNPs that explained more variance in the outcome than in the exposure (P < 0.05) [27]. All statistical analyses were conducted in R (version 4.3.1) using the TwoSampleMR (v0.5.7) and MR-PRESSO (v1.0) packages.
Power calculation
We conducted statistical power calculations for the MR analyses using an online tool (https://sb452.shinyapps.io/power/). The study had 100% power to detect an odds ratio (OR) of 1.03 for IRL thickness variations and 1.04 for AD risk. Power was primarily influenced by the phenotypic variance explained (PVE) by the genetic instruments. PVE was calculated using the formula:
RESULTS
The IVs demonstrated strong validity, with F-statistics ranging from 29.904 to 519.112 - well above the conventional threshold of F > 10, thereby minimizing the risk of weak instrument bias [Supplementary Tables 1-6]. The cumulative PVE by the selected SNPs ranged from 0.030 to 0.047 [Table 1], aligning with typical effect size distributions observed for complex traits in large-scale GWAS [30,31]. Primary bidirectional MR analyses revealed no evidence of causal effects in either direction [Figure 2]. RNFL thickness exhibited no causal association with AD risk (ORIVW = 1.001, 95% confidence interval [CI] = 0.986-1.017, P = 0.883) (Figure 3A), nor did GCIPL thickness (ORIVW = 1.008, 95% CI = 0.997-1.019, P = 0.172) (Figure 3B). Reverse MR analyses also demonstrated no causal effects of AD on RNFL thickness (ORIVW = 0.907, 95% CI = 0.786-1.046, P = 0.179) [Figure 3C] or GCIPL thickness (ORIVW = 1.014, 95% CI = 0.828-1.242, P = 0.890) [Figure 3D]. These null findings were replicated in an independent AD cohort, with similarly non-significant results for both RNFL thickness (ORIVW = 1.015, 95% CI = 0.987-1.043, P = 0.305) [Figure 3E] and GCIPL thickness (ORIVW = 1.014, 95% CI = 0.991-1.037, P = 0.237) [Figure 3F]. Consistent effect estimates were observed across four alternative MR methods [Supplementary Table 7].
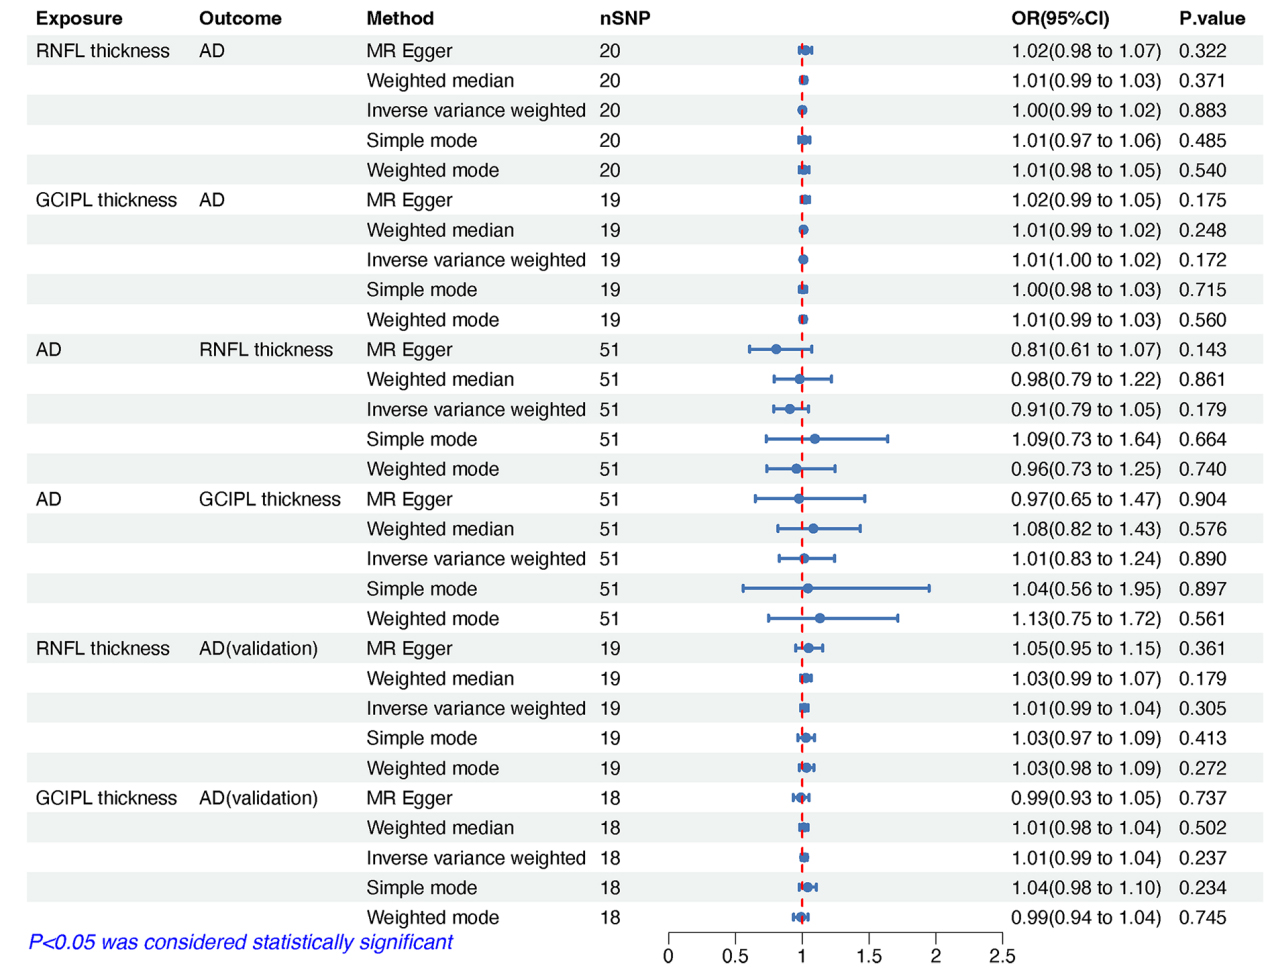
Figure 2. MR estimates, expressed as ORs with 95% CI, showing the genetic predisposition-driven associations between IRL thickness, including RNFL and GCIPL thickness, and the risk of Alzheimer’s disease (AD). MR: Mendelian randomization; OR: odds ratio; CI: confidence interval; IRL: inner retinal layer; RNFL: retinal nerve fiber layer; GCIPL: ganglion cell-inner plexiform layer; AD: Alzheimer’s disease.
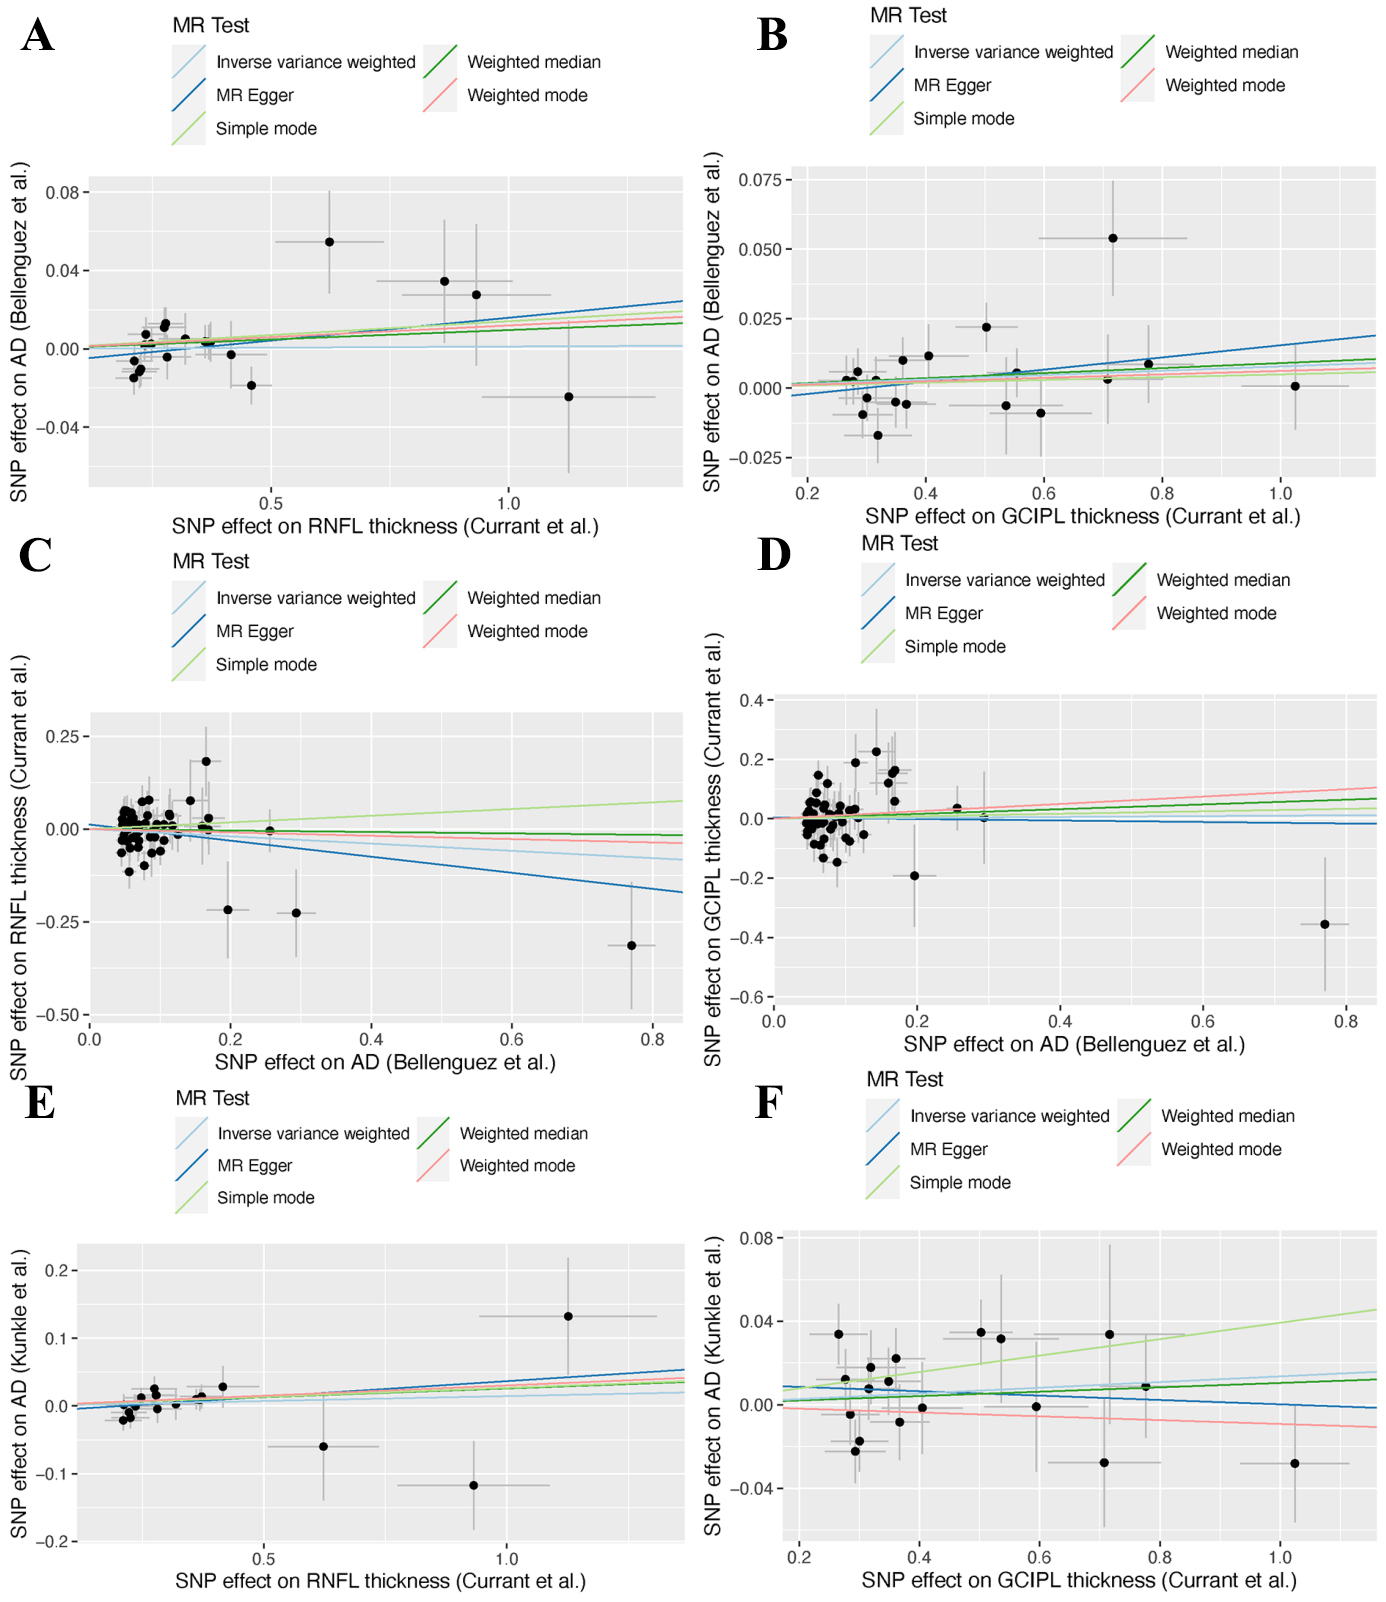
Figure 3. Scatter plots showing genetic correlations between inner retinal layer thickness, including the RNFL and the GCIPL, and AD. (A) RNFL thickness on AD; (B) GCIPL thickness on AD; (C)AD on RNFL thickness; (D) AD on GCIPL thickness; (E) RNFL thickness on AD (validation); (F) GCIPL thickness on AD (validation). RNFL: Retinal nerve fiber layer; GCIPL: ganglion cell-inner plexiform layer; AD: Alzheimer’s disease; MR: Mendelian randomization; SNP: single nucleotide polymorphism.
Summary of genetic IVs used for bidirectional MR analyses
| Exposure | Outcome | No. of SNPs | F-statistica | PVEb |
| RNFL thickness (Currant et al.)[6] | AD (Bellenguez et al.)[15] | 20 | 36.519(29.904-115.485) | 0.030 |
| GCIPL thickness (Currant et al.)[6] | 19 | 40.384(30.551-127.498) | 0.033 | |
| AD (Bellenguez et al.) | RNFL thickness (Currant et al.)[6] | 51 | 48.828(30.384-519.112) | 0.046 |
| GCIPL thickness (Currant et al.)[6] | 51 | 48.828(30.384-519.112) | 0.047 | |
| RNFL thickness (Currant et al.)[6] | AD (Kunkle et al.)[16] | 19 | 36.543(29.904-92.975) | 0.027 |
| GCIPL thickness (Currant et al.)[6] | 18 | 39.755(30.551-127.498) | 0.033 |
Comprehensive sensitivity analyses supported the robustness of these findings [Table 2]. Cochran’s Q test indicated no significant heterogeneity across IVs for either IVW or MR-Egger methods. The MR-PRESSO global test detected horizontal pleiotropic outliers in the dataset from Currant et al., but the effect estimates remained consistent with IVW outcomes after outlier correction [Supplementary Figure 1]. Leave-one-out analyses further validated the stability of the results, with no single SNP exerting a disproportionate influence on the causal estimates [Supplementary Figure 2].
Sensitivity analysis of MR estimates assessing causal associations between IRL thickness and AD risk
| Exposure | Outcome | Heterogeneity test | Pleiotropy test | MR- PRESSO | ||
| IVW Q (P-value) | MR-Egger Q (P-value) | MR-Egger intercept (P-value) | Outlier | global test RSSobs (P-value) | ||
| RNFL thickness (Currant et al.)[6] | AD (Bellenguez et al.)[15] | 22.593(0.256) | 21.333(0.263) | -0.007(0.316) | 0 | 25.394(0.259) |
| GCIPL thickness (Currant et al.)[6] | 20.569(0.302) | 19.472(0.302) | -0.006(0.341) | 0 | 25.394(0.259) | |
| AD (Bellenguez et al.)[15] | RNFL thickness (Currant et al.)[6] | 53.915 (0.327) | 52.952(0.324) | 0.012(0.350) | 1 | 55.949 (0.329) |
| GCIPL thickness (Currant et al.)[6] | 63.156 (0.100) | 63.093(0.085) | 0.004(0.827) | 1 | 65.899 (0.108) | |
| RNFL thickness (Currant et al.)[6] | AD (Kunkle et al.)[16] | 15.952 (0.596) | 15.500(0.560) | -0.010(0.510) | 0 | 17.418 (0.630) |
| GCIPL thickness (Currant et al.)[6] | 21.050 (0.224) | 20.136(0.214) | 0.011(0.407) | 0 | 24.151 (0.216) | |
DISCUSSION
This study investigated the potential causal relationship between IRL thickness and AD using a bidirectional two-sample MR analysis. Our findings provided no genetic evidence supporting an association between changes in RNFL or GCIPL thickness and AD risk, nor did AD appear to influence the thickness of RNFL and GCIPL. These results suggest that a clinically meaningful association between IRL thickness and AD susceptibility is unlikely.
Numerous previous studies have reported concurrent retinal thinning in individuals with AD[32-37]. A meta-analysis demonstrated significant RNFL thinning in AD patients (P < 0.0001)[38], and a pooled analysis found that baseline macular RNFL thinning was associated with an 11% increased risk of AD[9]. Additional observational evidence supports reduced GCIPL and ganglion cell complex thickness in AD cohorts[39-42]. These findings were reinforced by a recent meta-analysis showing significantly lower GCIPL thickness in AD patients compared to controls (P = 0.01)[42]. However, conflicting evidence also exists[43,44]. One case-control study, which accounted for confounders, reported no significant differences in peripapillary RNFL and total macular layer thickness between pathologically confirmed AD cases and controls[43]. Similarly, a cross-sectional study by Sánchez et al. found no notable differences in multilayer retinal thickness among individuals with AD, mild cognitive impairment, and healthy controls. Their multivariable-adjusted analyses revealed comparable values for total retinal thickness (P = 0.56), ganglion cell layer (P = 0.27), RNFL (P = 0.57), and macular thickness and volume (P = 0.38) [44]. Moreover, the association between retinal thinning and preclinical AD remains inconsistent across studies[45,46].
Observational studies are inherently prone to residual confounding, which may significantly impact the reported associations between IRL thickness and AD risk. These biases could stem from subclinical vascular comorbidities, shared genetic predispositions (e.g., APOE ε4 status), and lifestyle or environmental factors[47,48]. Our MR analysis revealed no evidence of a genetically determined causal relationship between IRL thickness and AD risk. Nonetheless, several limitations in the IVs used must be acknowledged: (1) IVs were selected based on global RNFL and GCIPL thickness rather than region-specific measures; (2) potential heterogeneity in OCT-derived measurements may have affected consistency; and (3) population stratification could exist between the exposure and outcome cohorts. It is also worth noting that previous studies have proposed a trans-synaptic degeneration mechanism that could contribute to RNFL thinning independently of amyloid-β pathology[49,50]. Future research should incorporate histopathological validation and vascular biomarkers to better distinguish AD-specific retinal changes from coexisting microvascular abnormalities.
The methodological strength of this study lies in its bidirectional two-sample MR design, which effectively minimizes residual confounding and reverse causation - limitations common to observational studies. However, several limitations remain. First, although quadrant-specific peripapillary RNFL thinning has been consistently reported in observational studies of AD[3], our analysis was limited to global IRL measurements due to the lack of region-specific GWAS summary statistics. Second, the genetic instruments used account for only a small proportion of the phenotypic variance in both AD and IRL thickness. The remaining variability may be driven by mechanisms not captured by current genetic models. Finally, although restricting our analyses to individuals of European ancestry reduces population stratification, this genetic homogeneity may limit the generalizability of our findings to other ethnic groups.
In conclusion, this study provides no evidence of a genetic causal relationship between IRL thickness and AD risk. Further MR studies incorporating trans-ancestry cohorts, longitudinal designs, and multimodal retinal imaging GWAS data are needed to validate these findings.
DECLARATIONS
Authors’ contributions
Conceptualization: Cheng B, Zhang SS
Formal analysis: Cheng B
Investigation: Cheng B, Feng YL, Luo ZH, Xiao W, Yang F, Jia CJ, Zhu T, Zhang SS
Methodology: Cheng B, Zhang SS
Software: Cheng B
Validation: Cheng B
Writing-original draft: Cheng B
Project administration: Feng YL, Luo ZH, Xiao W, Yang F, Jia CJ, Zhu T, Zhang SS
Writing- review and editing: Feng YL, Luo ZH, Xiao W, Yang F, Jia CJ, Zhu T, Zhang SS
All authors read and approved the final manuscript.
Availability of data and materials
GWAS summary statistics are available from each study and the IEU OpenGWAS project (https://gwas.mrcieu.ac.uk/ ). The code used in this study is available from the corresponding author upon reasonable request.
Financial support and sponsorship
This work was supported by grants from the Natural Science Foundation of Sichuan Province (24NFSC0490), the Research and Development Project of Affiliated Hospital of North Sichuan Medical College (2022MPZK0010), and the Philosophy and Social Science Research Planning Project of Nanchong (NC21B047).
Conflicts of interest
The authors declared that there are no conflicts of interest.
Ethical approval and consent to participate
This study is based on summary statistics from published studies; thus, additional ethical approval is not required for the current analyses.
Consent for publication
Not applicable.
Copyright
© The Author(s) 2025.
Supplementary Materials
REFERENCES
2. Kent SA, Spires-Jones TL, Durrant CS. The physiological roles of tau and Aβ: implications for Alzheimer's disease pathology and therapeutics. Acta Neuropathol. 2020;140:417-47.
3. Zhang Y, Wang Y, Shi C, Shen M, Lu F. Advances in retina imaging as potential biomarkers for early diagnosis of Alzheimer’s disease. Transl Neurodegener. 2021;10:6.
4. Ge YJ, Xu W, Ou YN, et al. Retinal biomarkers in Alzheimer’s disease and mild cognitive impairment: a systematic review and meta-analysis. Ageing Res Rev. 2021;69:101361.
5. London A, Benhar I, Schwartz M. The retina as a window to the brain-from eye research to CNS disorders. Nat Rev Neurol. 2013;9:44-53.
6. Currant H, Hysi P, Fitzgerald TW, et al; UK Biobank Eye and Vision Consortium. Genetic variation affects morphological retinal phenotypes extracted from UK Biobank optical coherence tomography images. PLoS Genet. 2021;17:e1009497.
7. Cheung CY, Ikram MK, Chen C, Wong TY. Imaging retina to study dementia and stroke. Prog Retin Eye Res. 2017;57:89-107.
8. Kashani AH, Asanad S, Chan JW, et al. Past, present and future role of retinal imaging in neurodegenerative disease. Prog Retin Eye Res. 2021;83:100938.
9. der Heide FCT, Khawaja A, Berendschot TTJM, et al; Maastricht Study Consortium, UK Biobank Eye & Vision Consortium, E3 consortium. Associations of inner retinal layers with risk of incident dementia: an individual participant data analysis of four prospective cohort studies. Alzheimers Dement. 2024;20:211-20.
10. Davies NM, Holmes MV, Davey Smith G. Reading Mendelian randomisation studies: a guide, glossary, and checklist for clinicians. BMJ. 2018;362:k601.
11. Smith G, Holmes MV, Davies NM, Ebrahim S. Mendel’s laws, Mendelian randomization and causal inference in observational data: substantive and nomenclatural issues. Eur J Epidemiol. 2020;35:99-111.
12. Sanderson E, Glymour MM, Holmes MV, et al. Mendelian randomization. Nat Rev Methods Primers. 2022;2:6.
13. Skrivankova VW, Richmond RC, Woolf BAR, et al. Strengthening the reporting of observational studies in epidemiology using Mendelian randomization: The STROBE-MR statement. JAMA. 2021;326:1614-21.
15. Bellenguez C, Küçükali F, Jansen IE, et al; EADB. New insights into the genetic etiology of Alzheimer’s disease and related dementias. Nat Genet. 2022;54:412-36.
16. Kunkle BW, Grenier-Boley B, Sims R, et al. Genetic meta-analysis of diagnosed Alzheimer’s disease identifies new risk loci and implicates Aβ, tau, immunity and lipid processing. Nat Genet. 2019;51:414-30.
17. Kamat MA, Blackshaw JA, Young R, et al. PhenoScanner V2: an expanded tool for searching human genotype-phenotype associations. Bioinformatics. 2019;35:4851-3.
18. Buniello A, MacArthur JAL, Cerezo M, et al. The NHGRI-EBI GWAS Catalog of published genome-wide association studies, targeted arrays and summary statistics 2019. Nucleic Acids Res. 2019;47:D1005-12.
19. Burgess, S. & Thompson, S. G. Mendelian randomization: methods for causal inference using genetic variants. CRC Press; 2021.
20. Burgess S, Thompson SG; CRP CHD Genetics Collaboration. Avoiding bias from weak instruments in Mendelian randomization studies. Int J Epidemiol. 2011;40:755-64.
21. Burgess S, Davey Smith G, Davies NM, et al. Guidelines for performing Mendelian randomization investigations: update for summer 2023. Wellcome Open Res. 2019;4:186.
22. Burgess S, Thompson SG. Interpreting findings from Mendelian randomization using the MR-Egger method. Eur J Epidemiol. 2017;32:377-89.
23. Burgess S, Bowden J, Fall T, Ingelsson E, Thompson SG. Sensitivity analyses for robust causal inference from mendelian randomization analyses with multiple genetic variants. Epidemiology. 2017;28:30-42.
24. Milne RL, Kuchenbaecker KB, Michailidou K, et al; ABCTB Investigators. Identification of ten variants associated with risk of estrogen-receptor-negative breast cancer. Nat Genet. 2017;49:1767-78.
25. Hartwig FP, Davey Smith G, Bowden J. Robust inference in summary data Mendelian randomization via the zero modal pleiotropy assumption. Int J Epidemiol. 2017;46:1985-98.
26. Verbanck M, Chen CY, Neale B, Do R. Detection of widespread horizontal pleiotropy in causal relationships inferred from Mendelian randomization between complex traits and diseases. Nat Genet. 2018;50:693-8.
27. Hemani G, Tilling K, Davey Smith G. Orienting the causal relationship between imprecisely measured traits using GWAS summary data. PLoS Genet. 2017;13:e1007081.
28. Man S, Chen B, Zhang Y, et al. The Associations between cataracts and Alzheimer’s disease: a bidirectional two-sample mendelian randomization study. J Alzheimers Dis. 2023;92:1451-8.
29. Chen F, Wen W, Long J, et al. Mendelian randomization analyses of 23 known and suspected risk factors and biomarkers for breast cancer overall and by molecular subtypes. Int J Cancer. 2022;151:372-80.
30. Locke AE, Kahali B, Berndt SI, et al; LifeLines Cohort Study. Genetic studies of body mass index yield new insights for obesity biology. Nature. 2015;518:197-206.
31. Khera AV, Chaffin M, Aragam KG, et al. Genome-wide polygenic scores for common diseases identify individuals with risk equivalent to monogenic mutations. Nat Genet. 2018;50:1219-24.
32. López-de-Eguileta A, Lage C, López-García S, et al. Ganglion cell layer thinning in prodromal Alzheimer’s disease defined by amyloid PET. Alzheimers Dement (N Y). 2019;5:570-8.
33. La Morgia C, Ross-Cisneros FN, Koronyo Y, et al. Melanopsin retinal ganglion cell loss in Alzheimer disease. Ann Neurol. 2016;79:90-109.
34. Wang M, Zhu Y, Shi Z, Li C, Shen Y. Meta-analysis of the relationship of peripheral retinal nerve fiber layer thickness to Alzheimer’s disease and mild cognitive impairment. Shanghai Arch Psychiatry. 2015;27:263-79.
35. Lian TH, Jin Z, Qu YZ, et al. The Relationship between retinal nerve fiber layer thickness and clinical symptoms of Alzheimer’s disease. Front Aging Neurosci. 2020;12:584244.
36. Ascaso FJ, Cruz N, Modrego PJ, et al. Retinal alterations in mild cognitive impairment and Alzheimer’s disease: an optical coherence tomography study. J Neurol. 2014;261:1522-30.
37. Javaid FZ, Brenton J, Guo L, Cordeiro MF. Visual and ocular manifestations of Alzheimer’s disease and their use as biomarkers for diagnosis and progression. Front Neurol. 2016;7:55.
38. Thomson KL, Yeo JM, Waddell B, Cameron JR, Pal S. A systematic review and meta-analysis of retinal nerve fiber layer change in dementia, using optical coherence tomography. Alzheimers Dement (Amst). 2015;1:136-43.
39. Almeida ALM, Pires LA, Figueiredo EA, et al. Correlation between cognitive impairment and retinal neural loss assessed by swept-source optical coherence tomography in patients with mild cognitive impairment. Alzheimers Dement (Amst). 2019;11:659-69.
40. Eraslan M, Çerman E, Çekiç O, et al. Neurodegeneration in ocular and central nervous systems: optical coherence tomography study in normal-tension glaucoma and Alzheimer disease. Turk J Med Sci. 2015;45:1106-14.
41. Ito Y, Sasaki M, Takahashi H, et al. Quantitative assessment of the retina using OCT and associations with cognitive function. Ophthalmology. 2020;127:107-18.
42. Chan VTT, Sun Z, Tang S, et al. Spectral-Domain OCT measurements in Alzheimer’s disease: a systematic review and meta-analysis. Ophthalmology. 2019;126:497-510.
43. den Haan J, van de Kreeke JA, Konijnenberg E, et al. Retinal thickness as a potential biomarker in patients with amyloid-proven early- and late-onset Alzheimer’s disease. Alzheimers Dement (Amst). 2019;11:463-71.
44. Sánchez D, Castilla-Marti M, Marquié M, et al. Evaluation of macular thickness and volume tested by optical coherence tomography as biomarkers for Alzheimer’s disease in a memory clinic. Sci Rep. 2020;10:1580.
45. Santos CY, Johnson LN, Sinoff SE, Festa EK, Heindel WC, Snyder PJ. Change in retinal structural anatomy during the preclinical stage of Alzheimer’s disease. Alzheimers Dement (Amst). 2018;10:196-209.
46. van de Kreeke JA, Nguyen HT, Konijnenberg E, et al. Longitudinal retinal layer changes in preclinical Alzheimer’s disease. Acta Ophthalmol. 2021;99:538-44.
47. Shin JY, Choi EY, Kim M, Lee HK, Byeon SH. Changes in retinal microvasculature and retinal layer thickness in association with apolipoprotein E genotype in Alzheimer’s disease. Sci Rep. 2021;11:1847.
48. Yeh TC, Kuo CT, Chou YB. Retinal microvascular changes in mild cognitive impairment and Alzheimer’s disease: a systematic review, meta-analysis, and meta-regression. Front Aging Neurosci. 2022;14:860759.
49. Haan J, Janssen SF, van de Kreeke JA, Scheltens P, Verbraak FD, Bouwman FH. Retinal thickness correlates with parietal cortical atrophy in early-onset Alzheimer’s disease and controls. Alzheimers Dement (Amst). 2018;10:49-55.
Cite This Article
How to Cite
Download Citation
Export Citation File:
Type of Import
Tips on Downloading Citation
Citation Manager File Format
Type of Import
Direct Import: When the Direct Import option is selected (the default state), a dialogue box will give you the option to Save or Open the downloaded citation data. Choosing Open will either launch your citation manager or give you a choice of applications with which to use the metadata. The Save option saves the file locally for later use.
Indirect Import: When the Indirect Import option is selected, the metadata is displayed and may be copied and pasted as needed.
About This Article
Special Issue
Copyright

Data & Comments
Data
0


Comments
Comments must be written in English. Spam, offensive content, impersonation, and private information will not be permitted. If any comment is reported and identified as inappropriate content by OAE staff, the comment will be removed without notice. If you have any queries or need any help, please contact us at [email protected].