


EnrichGT: a comprehensive R-based tool for functional genomics enrichment analysis based on large language models
 0
0 Abstract
Aim: We aimed to develop EnrichGT, an open-source and clinician-friendly R package for functional genomics enrichment analysis leveraging large language models (LLMs). The tool addresses major limitations of existing approaches, including semantic redundancy, limited interpretability, and static reporting frameworks, thereby facilitating clinical interpretation and supporting data-driven decision-making.
Methods: EnrichGT implemented both over-representation analysis and preranked gene set enrichment analysis using multiple knowledge bases. To minimize redundancy, enriched pathways were clustered based on shared genes, emphasizing coherent biological themes. Biological interpretability is further improved by inferring transcription factor activity through CollecTRI (Collection of Transcription Regulation Interactions, https://github.com/saezlab/CollecTRI) and pathway activity via PROGENy (Pathway RespOnsive GENes for activity inference, https://saezlab.github.io/progeny/). Additionally, context-aware annotations were generated through LLM integration, and results were compiled into dynamic, interactive reports using Quarto.
Results: EnrichGT streamlines functional genomics enrichment analysis by clustering pathways based on gene co-occurrence, significantly reducing redundancy and enhancing interpretability. When applied to lung adenocarcinoma data from The Cancer Genome Atlas (TCGA), 873 enriched Gene Ontology terms were consolidated into 15 biologically coherent modules, revealing key processes such as myeloid cell activation and tumor-associated angiogenesis. Downstream analysis identified major tumor-associated regulators [CREB1 (cAMP responsive element binding protein 1), RELA/NF-κB p65 (RELA = RELA proto-oncogene, NF-κB = nuclear factor kappa-light-chain-enhancer of activated B cells signaling), HIF1A (hypoxia inducible factor 1 subunit alpha), PPARG (peroxisome proliferator activated receptor gamma), ETS1 (ETS proto-oncogene 1)] and critical signaling axes [TNFα (tumor necrosis factor alpha signaling), NF-κB, hypoxia (oxygen deprivation-related signaling)]. Automated LLM-based annotations and multi-database integration provided complementary pathway insights. Furthermore, EnrichGT’s comparative multi-condition framework revealed conserved and condition-specific biological patterns across datasets, including single-cell ear-canal development and TCGA tumor-stage progression. Its dynamic reporting interface ensured transparent, reproducible, and iterative exploration of enrichment results.
Conclusion: EnrichGT offered a robust, clinician-friendly solution for functional genomics enrichment analysis, enhancing clinical interpretation and data-driven decision-making.
Keywords
INTRODUCTION
High-throughput omics technologies have become essential tools for elucidating disease mechanisms and identifying biomarkers, driving rapid expansion of large-scale clinical biobanks and longitudinal cohort studies[1]. These initiatives have generated multidimensional datasets encompassing diverse patient populations, varying temporal contexts, and multiple molecular modalities. Consequently, there is an increasing need for analytical frameworks that ensure interpretative depth, computational reproducibility, and rigorous, user-controlled data management[2].
Functional enrichment analysis is a widely used method for biological interpretation, identifying statistically significant enrichment of pathways from databases such as Kyoto Encyclopedia of Genes and Genomes (KEGG) and Reactome, as well as ontological terms from resources such as the Gene Ontology (GO) within omics-derived gene sets[3,4]. However, current methods face several challenges, including (1) semantic redundancy in annotation databases, where excessive synonymous and overlapping terms may obscure distinct biological processes that co-occur in complex omics data[5,6]; (2) reliance on statistical thresholds that display only top-ranked pathways, potentially overlooking biologically relevant but lower-ranked themes[7]; and (3) static reporting frameworks that restrict iterative hypothesis refinement, a process crucial for longitudinal studies employing evolving analytical models.
Existing tools have made progress toward these challenges. For example, clusterProfiler (https://bioconductor.org/packages/clusterProfiler/) uses semantic similarity metrics to consolidate redundant terms[8]; Metascape (https://metascape.org/) integrates enrichment results from multiple annotation resources[9], and R/Bioconductor (https://www.bioconductor.org/) enables locally executed, user-controlled analyses[10]. Nevertheless, web-based platforms, while improving accessibility, may limit local data control and customization; locally executed tools provide secure and flexible analytical environments but often lack dynamic, high-quality documentation for iterative workflows. Moreover, most existing tools are designed for bioinformaticians or laboratory researchers, leaving clinicians with limited computational expertise struggling to conduct analyses and derive clinically actionable insights. Advancements in these areas are therefore essential to improve the scalability, reproducibility, and clinical utility of omics analysis.
To address these limitations, we developed EnrichGT, an open-source R package for interpretable functional genomics analysis. EnrichGT operates entirely within user-controlled environments, extending the R infrastructure through adaptive workflows supporting customized gene sets and complex multi-condition analyses. It integrates semantic aggregation to simplify redundant annotations into coherent functional themes and seamlessly connects with the Quarto (https://quarto.org/docs/get-started/) dynamic document generation ecosystem to produce continuously updated reports, synchronizing analytical workflows, visualizations, and interpretations. This integration enables clinicians who may lack advanced computational expertise to perform enrichment analyses and obtain biologically meaningful insights directly applicable to precision medicine, all without external data transfer. Moreover, EnrichGT incorporates an LLM-assisted annotation pipeline for hypothesis generation, which leverages cluster-level summaries from curated pathway databases alongside standardized prompts and decoding parameters to efficiently extract research and clinical insights. Collectively, EnrichGT offers an extensible, reproducible, and clinician-accessible framework for functional enrichment analysis across the biobank research lifecycle, from discovery and validation to cohort expansion.
METHODS
Computational pipeline overview
We developed a comprehensive computational pipeline for pathway enrichment analysis, clustering, and biological interpretation that accommodates multiple species through flexible parameter configuration. The pipeline integrates gene sets from multiple databases, performs both over-representation analysis (ORA) and Gene Set Enrichment Analysis (GSEA), and clusters enriched pathways based on contributing genes. It subsequently generates interactive visualizations that incorporate inferred transcription factor activities and pathway-level regulatory profiles. The pipeline also supports multi-group comparisons by clustering enrichment statistics across conditions to identify shared and condition-specific biological patterns.
Database integration and gene set compilation
Gene sets and pathway annotations were compiled from multiple sources to ensure comprehensive coverage of biological processes. Species-specific gene identifiers were obtained from BioConductor annotation packages (e.g., org.Hs.eg.db for human, org.Mm.eg.db for mouse)[11]. Pathway information was retrieved from the Reactome database for reaction-based pathways and the KEGG database for metabolic and signaling pathways[12,13]. The pipeline adapts to different organisms by specifying the appropriate BioConductor annotation package[11]. Custom gene sets can be incorporated via gene matrix transposed (GMT) format files, enabling integration of user-defined databases or specialized gene lists relevant to specific research contexts.
Over-representation analysis
ORA was performed using a hypergeometric test to determine whether user-supplied genes, typically those identified as differentially expressed, appeared in a given pathway more frequently than expected under random sampling without replacement from the study-specific background. For each pathway, we enumerated the number of overlapping genes and quantified the probability of observing at least that degree of overlap under the null hypothesis of random selection. The resulting probability was reported as the nominal P-value. All nominal P-values were adjusted for multiple comparisons using the Benjamini-Hochberg procedure[14], and pathways with a FDR (false discovery rate) below 5% were considered significantly enriched.
Gene set enrichment analysis
GSEA was implemented using the fgsea package in R[15], which employed an optimized algorithm for rapid calculation of enrichment scores and statistical significance. EnrichGT provided a wrapper for the computational and visualization interfaces of the fgsea[15].
Clustering of enriched pathways
Pathways identified by ORA and GSEA were clustered based on their contributing genes to reduce redundancy and reveal functional relationships. For ORA, overlapping (“hit”) genes were used, and for GSEA, core enrichment genes contributing most to the enrichment score were used.
The clustering procedure consisted of: (1) construction of a document-term matrix (DTM) where each pathway represented a “document” and contributing genes served as “terms”; (2) computing pairwise cosine distances between pathways using DTM; and (3) performing hierarchical clustering with user-specified linkage methods (complete, average, or single linkage). When multiple databases were analyzed, individual DTMs were concatenated for joint clustering, facilitating detection of functional similarities and redundancies across different pathway collections.
Visualization and result interpretation
Enrichment results were formatted as interactive tables using the gt package in R[16]. These tables, along with other analytical outputs, were integrated into reproducible reports generated using Quarto. Word clouds were generated using the wordcloud package to visualize the frequency of genes or terms associated with enriched pathways, highlighting dominant biological themes.
LLM-assisted annotation
An optional LLM module was implemented to summarize clustered enrichment outputs. The primary model was DeepSeek-V3(0324) (https://huggingface.co/deepseek-ai/DeepSeek-V3-0324), with GPT-4.1 (https://openai.com/index/gpt-4-1/) used for auxiliary verification. Standardized prompts and a temperature of 0.6 were applied. Details of EnrichGT’s LLM-assisted pipeline, including the multi-round query strategy designed to reduce hallucinations and associated prompts, are provided in Supplementary Material 1.
Transcription factor and pathway activity inference
Transcription factor activities and pathway regulation were inferred by applying ORA to gene sets derived from the PROGENy (Pathway RespOnsive GENes for activity inference, https://saezlab.github.io/progeny/) and CollecTRI (Collection of Transcription Regulation Interactions) frameworks[17,18].
Multi-group comparison and cross-condition analysis
For experiments involving multiple conditions or groups, enrichment statistics [adjusted P-values for ORA or Normalized Enrichment Scores (NES) for GSEA] were compiled into matrices across conditions. Hierarchical clustering was applied to these matrices to identify condition-specific biological processes, and conserved biological processes.
Statistical considerations and multiple testing corrections
All P-values were adjusted for multiple testing using the Benjamini-Hochberg FDR method[14]. Pathways were considered significantly enriched at FDR < 0.05 unless otherwise specified. For GSEA, NES were calculated to enable comparison across gene sets of varying sizes.
Parameter selection strategy
To ensure reliable re-clustering, we applied stringent enrichment filters: ORA required P-value < 0.05, Count ≥ 5, and p.adjust < 0.05; GSEA required P-value < 0.05, |NES| ≥ 1, and p.adjust < 0.05. Re-clustering was performed using hierarchical clustering (method = “ward.D2”) with p.adjust = 0.05 for term filtering; nTop = 10 controlled only the number of terms displayed per cluster and had no effect on clustering. ClusterNum is the primary tunable parameter; we recommend exploring 5-20 (typically starts 5/10/15) and used the default 10 in this study. For LLM-based interpretation via EnrichGT, high-capacity models (> 100 B) are preferred; we used DeepSeek-V3(0324) with temperature = 0.6, recommending 0.5-1.0 (discouraging > 1.0). All analyses adhered to these settings.
Objective evaluation
EnrichGT was benchmarked against established tools (clusterProfiler, Metascape, g:Profiler) across two dimensions. First, computational efficiency was assessed using eight datasets of varying gene set sizes. Each dataset included ten replicates tested against the full GO database. R-based tools were executed automatically. Web-based tools were tested by two independent operators, each contributing five runs. Second, statistical concordance was validated by comparing EnrichGT’s ORA implementation against clusterProfiler (the R gold standard) across eight case studies. Both tools used the same Molecular Signatures Database (MSigDB, https://www.gsea-msigdb.org/gsea/index.jsp) GO Biological Process database. Concordance was quantified using Pearson correlation, Spearman correlation, R2 (coefficient of determination), and Bland-Altman analysis.
Subjective evaluation
A blinded evaluation protocol assessed interpretability and redundancy reduction. Test cases comprised well-characterized biological processes, including cell identity markers, polarization states, and disease processes. Expected outcomes were established from the literature. Two domain experts developed a standardized 5-criterion scoring rubric (1-4 points per criterion). Details of the scoring criteria are provided in Supplementary Table 1. Evaluators independently scored de-identified, randomized outputs from all tools. They assessed biological interpretation completeness, accuracy, and time-to-interpretation while remaining fully blinded to tool identity. Inter-evaluator variability was reported to assess scoring consistency. The gene sets used for the benchmark can be downloaded at https://github.com/runchenwang-dev/EightGeneSets. Additionally, we evaluated usability and interpretability specifically for clinicians
Implementation and availability
The pipeline was implemented in R (version ≥ 4.0) and is freely available at https://github.com/runchenwang-dev/EnrichGT. The analyses presented in this study were performed using R version 4.5 with EnrichGT version 2.2.0. For GSEA analysis, EnrichGT requires fgsea (version ≥ 1.32); version 1.34.0 was used in this paper. EnrichGT includes cached PROGENy and CollecTRI databases derived from OmniPathR version 3.13.14. The LLM functionality requires external application programming interface (API) access. EnrichGT is compatible with any OpenAI-like API-compatible endpoint, supporting both cloud-based services (e.g., OpenAI API, DeepSeek API, OpenRouter) and locally deployed models (e.g., via Ollama, vLLM, or LM Studio). Local deployment is recommended when analyzing sensitive patient data to ensure privacy compliance. Users specify the endpoint and API key when initializing the chat object. In this study, we employed the DeepSeek-V3-0324 checkpoint model via the official DeepSeek API for primary LLM analyses, with GPT-4.1 (accessed through OpenRouter) for comparative evaluation. Dynamic report generation utilizes the Quarto framework (version ≥ 1.5). Comprehensive documentation, function references, and tutorials are available at https://zhimingye.github.io/EnrichGT/.
RESULTS
Pathway-candidate gene co-occurrence matrix clustering enables efficient discovery of biological structures in omics data
To demonstrate EnrichGT’s analytical capabilities, we analyzed differential gene expression between advanced-stage (III/IV) and early-stage (I) lung adenocarcinoma from The Cancer Genome Atlas (TCGA). Conventional ORA identified 873 enriched GO Biological Process terms (adjusted P < 0.05). Traditional standard bubble plot visualization [Figure 1A] reveals statistical significance but obscures term redundancy and functional relationships. Static formats further limit comprehensive data exploration.
Figure 1. EnrichGT enables comprehensive biological interpretation through term clustering and dynamic visualization. (A) Traditional over-representation analysis of differentially expressed genes between high-stage (≥ Stage III) and Stage I lung adenocarcinoma from TCGA, showing the top 20 Gene Ontology Biological Process terms ranked by gene ratio. Bubble size represents the number of genes (count) enriched in each GO term; color intensity indicates the adjusted P-value. The x-axis shows gene ratio (percentage of genes in each term relative to the total query genes); (B) EnrichGT clustering of enriched terms into 15 biologically coherent clusters, with node size proportional to the number of terms per cluster and color intensity indicating enrichment significance (adjusted P-value); (C) Interactive table for Cluster 4 (myeloid cell activation), displaying all enriched terms with their enrichment statistics, enabling comprehensive data exploration within a single interface; (D) Word cloud visualization of Cluster 4 highlighting dominant biological themes, with word size proportional to term frequency; (E) Transcriptional regulator analysis of Cluster 4 genes using CollecTRI database, revealing key transcription factors driving myeloid activation signatures. Node size indicates the number of target genes; (F) Pathway activity inference for Cluster 4 using PROGENy, showing activation of inflammatory and hypoxia-related signaling pathways characteristic of tumor-associated macrophages (TAMs). TCGA: The Cancer Genome Atlas; GO: Gene Ontology; CollecTRI: Collection of Transcription Regulation Interactions; PROGENy: Pathway RespOnsive GENes for activity inference.
To overcome the redundancy and interpretability issues of conventional visualization, EnrichGT applies pathway-candidate gene co-occurrence matrix clustering. The method constructs a frequency matrix from genes shared between enriched and reference pathways, then performs hierarchical clustering. This reorganized 873 terms into 15 coherent clusters [Figure 1B], effectively reducing redundancy while maintaining biological granularity. Representative clusters captured myeloid activation (Cluster 4), angiogenesis (Cluster 11), and developmental processes (Cluster 14).
Cluster 4 exemplifies the method’s utility. Interactive web-based tables [Figure 1C] enable dynamic exploration of enriched terms, statistical metrics, and gene sets without external files. Automated word cloud generation [Figure 1D] provides immediate visual summaries of dominant cluster themes (“myeloid”, “activation”, “leukocyte differentiation”, “immune response”).
EnrichGT also integrates CollecTRI and PROGENy databases for automated transcription factor and pathway activity annotation. This pipeline identified key transcriptional regulators [CREB1 (cAMP responsive element binding protein 1), RELA (RELA proto-oncogene), HIF1A (hypoxia inducible factor 1 subunit alpha), PPARG (peroxisome proliferator activated receptor gamma), ETS1 (ETS proto-oncogene 1); Figure 1E and F] and enriched signaling pathways [TNFα (tumor necrosis factor alpha signaling), NF-κB (nuclear factor kappa-light-chain-enhancer of activated B cells signaling), hypoxia (oxygen deprivation-related signaling)], demonstrating the tool’s multi-layer analytical capacity.
Collectively, these results demonstrate how EnrichGT transforms complex enrichment outputs into structured, interpretable insights through automated clustering, interactive visualization, and integrated annotation pipelines.
Large language model-assisted annotation enhances biological interpretation of enrichment clusters
Although clustering consolidates enriched terms into biological themes, interpretation requires substantial domain expertise. LLMs offer automation potential but face critical challenges: raw gene lists lack contextual information for reliable inference, while complete enrichment outputs exceed context limits and introduce noise, both compromising accuracy.
Building on prior clustering, EnrichGT employs a cluster-first framework providing LLMs with appropriately scoped input [Figure 2A]. Each cluster is summarized into significantly enriched pathways with similar biological functions, rather than raw genes or exhaustive lists. Pre-defined prompts automatically incorporate these summaries through partitioned iterative queries, maintaining sufficient biological context within LLMs’ limited context windows.
Figure 2. Large language model-assisted interpretation enhances biological understanding of enrichment clusters. (A) Schematic of the cluster-first LLM interpretation framework. EnrichGT-generated clusters containing gene modules and enriched terms are processed through optimized prompts before LLM analysis, ensuring appropriate context and scope for biological interpretation; (B) Conventional Bubble Plot Output Before LLM-Assisted Annotation. LLM: Large language model.
To minimize hallucinations, EnrichGT organizes pathways into thematic clusters before annotation. This directs LLMs to focus on specific biological contexts and reduces noise-induced errors. The pipeline first provides statistically significant pathways as structured text, directing models toward established functional relationships. Gene-level information is subsequently introduced, preventing information overload by establishing pathway themes beforehand. This hierarchical design ensures each stage constrains subsequent analyses, grounding gene interpretations in pathway-level context and reducing implausible predictions. LLMs then synthesize the biological theme.
Application to Cluster 4 (“Myeloid Lineage Commitment and Immune Activation”, Figure 2B) from prior analysis [Supplementary Figure 1A] validated methodological utility. Automated annotation identified TAM signatures, including myeloid activation pathways and key regulators spanning recruitment [CXCR2 (C-X-C motif chemokine receptor 2), C5AR1 (Complement C5a receptor 1)], pattern recognition [TLR4 (Toll-like receptor 4)], transcriptional control [GATA1 (GATA binding protein 1), GATA2 (GATA binding protein 2)], post-transcriptional regulation, and metabolic programming [ADIPOQ (ADIPOQ = Adiponectin, C1Q and collagen domain containing)]. To mitigate bias from using a single large language model (LLM), EnrichGT enables users to compare outputs from multiple LLMs [Supplementary Figure 1B].
This framework enables rapid biological surveying of clustering results, providing accessible pathway connectivity overviews and disease relevance for initial interpretation. Recognizing model-specific biases, EnrichGT positions LLMs as interpretive aids rather than statistical inference tools. Outputs serve as hypothesis-generating resources requiring expert validation. This methodological demonstration illustrates how LLMs accelerate biological interpretation of enrichment analyses.
Multi-database pathway integration with flexible enrichment analysis approaches enhances biological interpretation
Individual pathway databases exhibit inherent biases in coverage and granularity. To demonstrate EnrichGT’s scalability, we performed parallel enrichment analyses using KEGG and Reactome databases. In the following example, KEGG and Reactome each emphasized different biological events [Figure 3A and B]. EnrichGT’s multi-database clustering integrated these complementary results into unified functional modules [Figure 3C and D], revealing relationships that single-database approaches might overlook.
Figure 3. Multi-database integration provides comprehensive pathway analysis through complementary annotations. (A) KEGG pathway enrichment analysis of differentially expressed genes. Bubble plot showing enriched KEGG pathways, with the x-axis representing gene ratio (percentage of genes in each pathway), bubble size indicating gene count, and color denoting adjusted P-value (blue: higher significance; red: lower significance); (B) Reactome pathway enrichment analysis. Bubble plot displaying enriched Reactome pathways with the same representation as in (A). Gene ratio (x-axis), gene count (bubble size), and adjusted P-value (color scale) are shown for each pathway; (C) Comprehensive gene set enrichment re-cluster analysis across multiple databases. Multiple panels showing enriched gene sets organized by functional categories. Each bubble plot displays gene ratio (x-axis), with bubble size representing gene count and color indicating adjusted P-value. Gene sets are derived from Reactome (R-HSA) and KEGG (hsa) databases, covering diverse biological processes including signal transduction, metabolism, and cellular functions; (D) Interactive table for comprehensive gene set enrichment re-cluster analysis. KEGG: Kyoto Encyclopedia of Genes and Genomes.
Beyond self-built ORA, EnrichGT can re-cluster GSEA outputs from the widely used R package fgsea into biologically interpretable modules. Applied to the TCGA dataset, this approach identified alterations in angiogenesis, metabolic reprogramming, and wound healing pathways [Supplementary Figure 2A and B], organizing both positively and negatively enriched pathways into coherent functional modules.
EnrichGT also supports custom biological databases via GMT files. For instance, using MSigDB’s C7 immunologic signatures, we analyzed immune cell-specific expression patterns, revealing T cell subset dynamics, macrophage polarization states, and immune checkpoint signatures [Supplementary Figure 2C and D]. These results demonstrate the framework’s extensibility and versatility.
Clustering-based multi-condition comparison enables comprehensive overview of complex biological results
Conventional enrichment methods perform poorly in multi-condition comparisons, particularly when identifying shared or condition-specific processes across complex experimental designs. EnrichGT enables systematic integration and interpretation of enrichment results from multiple conditions.
To demonstrate this functionality, we analyzed a developmental time-course dataset of ear development[19]. Using ORA-adjusted P-values as the clustering metric, EnrichGT organized enrichment results into functional clusters across developmental modules [Figure 4A]. Cluster 4 emerged as a conserved process spanning early (Modules 1-2) and late (Module 6) stages. Word-cloud analysis revealed dominant bioenergetic terms - “ATP process”, “electron transport”, and “metabolic” [Figure 4B] - corroborated by the pathway-similarity dendrogram [Figure 4C]. This recurrent module underscores sustained bioenergetic requirements throughout ear morphogenesis.
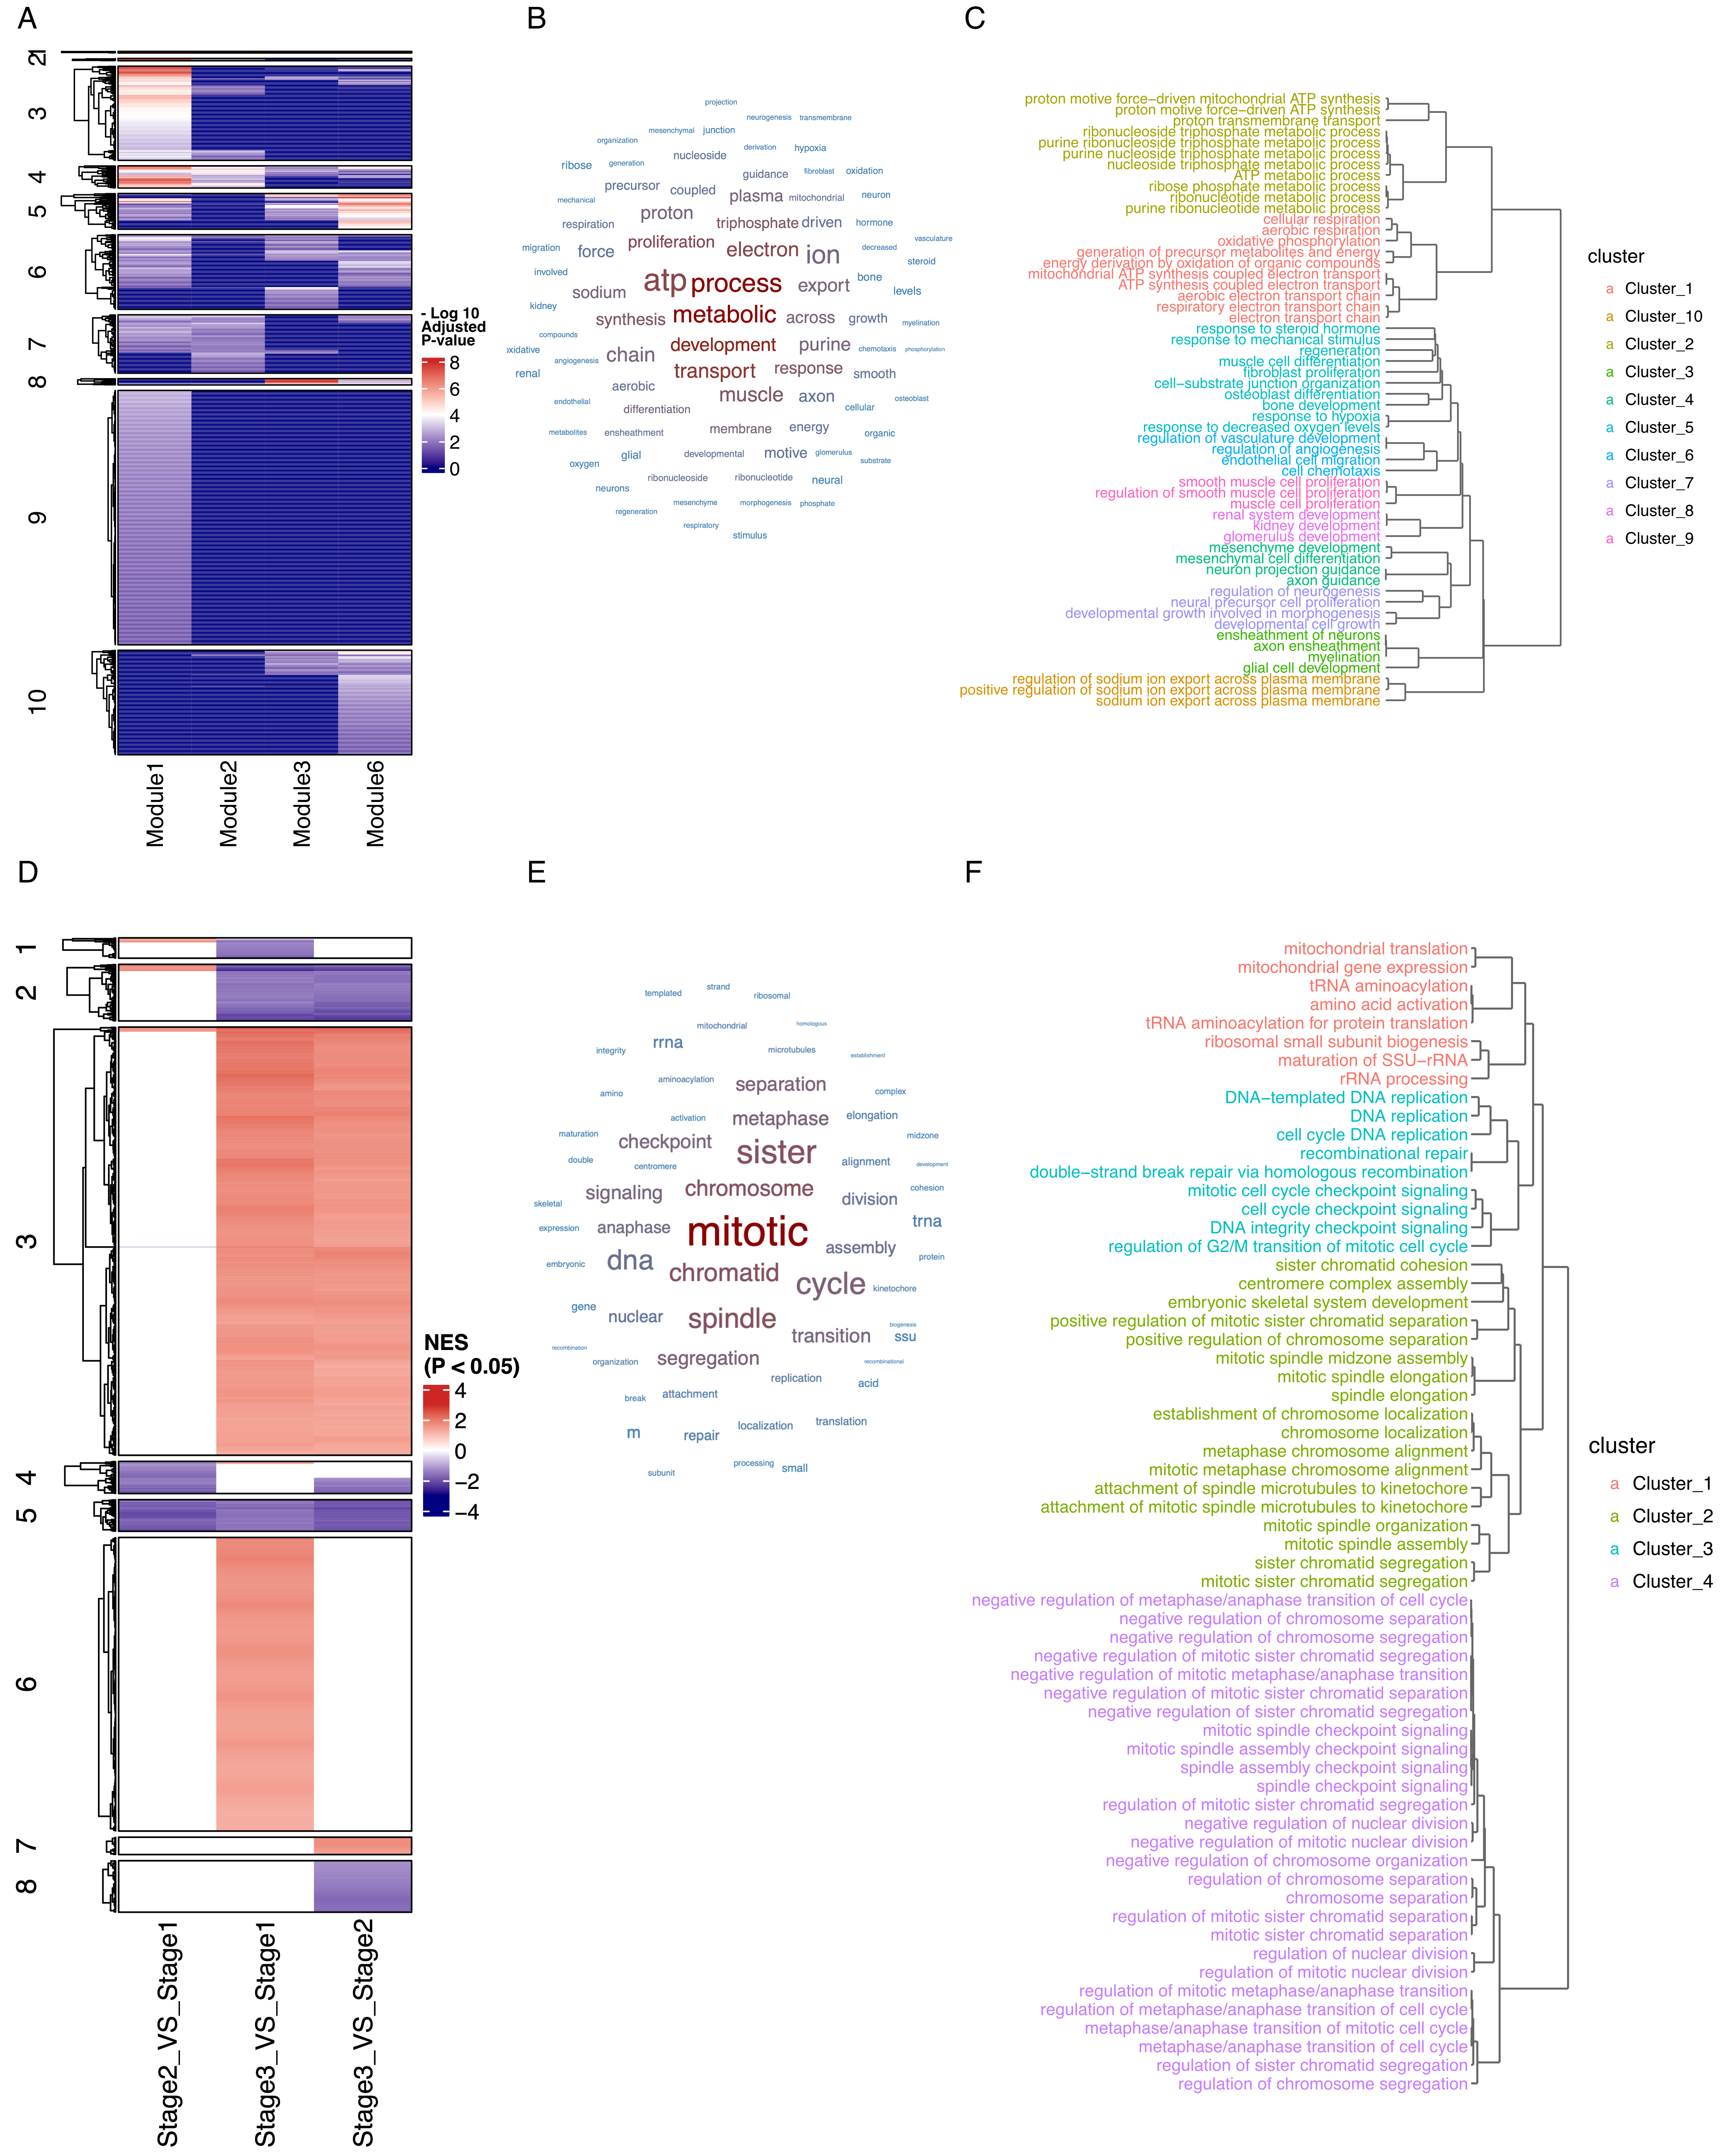
Figure 4. Clustering-based multi-condition comparison reveals conserved and dynamic biological processes across complex experimental designs. (A) Heatmap showing the enrichment of each group of genes across distinct pathways. Color intensity represents -log10 transformed adjusted P values, with darker red indicating higher statistical significance; (B) Word cloud visualization of Cluster 4 highlighting key developmental themes; (C) Pathway hierarchical clustering dendrogram of Cluster 4 showing highly interconnected developmental processes; (D) Heatmap displaying Normalized Enrichment Scores (NES) from Gene Set Enrichment Analysis (GSEA) comparing three developmental stages (Stage 2 vs. Stage 1, Stage 3 vs. Stage 1, Stage 3 vs. Stage 2) across different pathways. Color scale represents significant NES values, with red indicating positive enrichment and blue indicating negative enrichment (scale: -4 to 4); (E) Word cloud analysis of Cluster 5 emphasizing disrupted tissue functions; (F) Pathway hierarchical clustering dendrogram within Cluster 5 showing coordinated loss of normal lung physiological processes during tumor progression.
We further applied this approach to TCGA lung adenocarcinoma data across tumor stages. Using GSEA normalized enrichment scores, we identified pathway modules that change with disease progression [Figure 4D]. Cluster 5 exhibited progressive downregulation, with word-cloud analysis revealing mitotic-related terms [Figure 4E] and the pathway dendrogram illustrating hierarchical organization of cell cycle processes [Figure 4F]. These results suggest attenuation of mitotic programs may promote chromosomal instability in advanced disease.
This clustering-based approach offers key advantages over conventional pairwise comparisons: it provides global views across all conditions, identifies conserved and dynamic modules, and organizes pathways into interpretable clusters. These capabilities particularly benefit biobank and clinical cohort studies involving multiple disease states, treatment conditions, or temporal profiles.
Dynamic document generation framework facilitates comprehensive presentation and sharing of enrichment results
EnrichGT addresses the need for flexible, dynamic reporting in biobank and clinical cohort studies. The system integrates a Quarto-based document generation framework that automatically produces synchronized reports in three formats: webpages, LaTeX, and Word. Each output preserves identical content while optimizing presentation for different users. The dynamic nature of this framework enables automatic report regeneration when new samples are added or the database is updated. This capability is critical for longitudinal studies and multicenter collaborations that require continuous sharing of updated results.
To complement the documentation framework, EnrichGT also provides multiple interfaces for seamless integration with clinical pipelines. An interactive Shiny web application enables code-free exploration of enrichment results with real-time parameter adjustment. Intuitive point-and-click operations allow clinicians and biologists to independently investigate findings and perform all aforementioned analyses. For programmatic integration, the modular R package architecture supports direct incorporation into automated workflows. This design facilitates batch processing of multiple cohorts and systematic parameter optimization across diverse clinical research environments.
Clinician usability assessment
We benchmarked EnrichGT across computational, statistical, and interpretability dimensions. EnrichGT demonstrated superior execution speed compared to established tools (clusterProfiler, Metascape, g:Profiler) across gene sets of 100-2,000 genes (n = 8 datasets, 10 replicates each). Even with re-clustering enabled, EnrichGT remained among the fastest methods [Supplementary Figure 3A and B] while maintaining low memory consumption (~50 MB per task, Supplementary Figure 3C). Statistical validation against clusterProfiler using MSigDB GO annotations revealed identical adjusted P-values (Pearson’s r = 1.000; Spearman’s ρ = 1.000; R2 = 1.000, Supplementary Figure 3D). Bland-Altman analysis confirmed no systematic bias, validating our ORA implementation’s statistical fidelity.
To assess clinical usability and interpretability, we conducted evaluations with three clinician evaluators with diverse computational backgrounds: A (senior thoracic surgeon, no formal programming), B (mid-career respiratory physician, basic R), and C (surgical resident with computational biology experience).
For interpretability assessment, the clinicians independently scored de-identified output panels from well-characterized biological processes (cell identity markers, tumor invasion, macrophage polarization, tissue damage-repair) using a consensus-derived rubric (5 criteria, 1-4 point scales). Details of the scoring criteria are provided in Supplementary Table 1. EnrichGT achieved interpretability scores comparable to other tools while displaying substantially fewer terms, demonstrating its effectiveness in reducing the reading burden without loss of interpretability [Supplementary Figure 4A]. Time-to-interpretation analysis showed EnrichGT achieved comparable or faster assessment times than clusterProfiler and significantly faster times than web-based tools [Supplementary Figure 4B].
We selected three representative gene sets from the above analysis for expert evaluation: (1) immune-related (Macrophage M2 Polarization, M2: alternatively activated macrophages), (2) cancer-related (Tumor-Activating Invasion and Metastasis), and (3) epithelial development-related (Club Epithelial Injury-Repair Process). Biologists who established the scoring criteria evaluated the annotation outputs [Supplementary Materials 2-4]. Evaluators unanimously agreed that LLM-assisted annotation accelerates biological insight generation from experimental results. Notably, this approach connects dispersed functional modules, helping researchers broaden perspectives and generate novel hypotheses. Evaluators particularly emphasized this integrative capacity. For example, in the macrophage M2 polarization task, LLM annotation integrated M2 metabolic signatures involving OXPHOS (oxidative phosphorylation), lipid metabolism, and key regulators [SIRT3 (Sirtuin 3), PPARG, HADHA (hydroxyacyl-CoA dehydrogenase trifunctional multienzyme complex subunit alpha)]. Clusters 1 and 10 were organized into a phagocytic framework spanning recognition, engulfment, and lysosomal processing. Similarly, evaluators found that LLM demonstrated high performance in annotating tumor invasion-related gene sets. However, it appeared to lack sufficient understanding of cell-specific contexts when explicit constraints were not provided. For example, in the Club cell repair task, Cluster 1 was incorrectly interpreted as centering on synaptic and neuronal local translation. This annotation clearly mismatches the airway epithelial Club cell context. The discrepancy likely stems from semantic bias in ribosome and translation-related GO terms, resulting in overfitting interpretation. These observations underscore the importance of incorporating tissue-specific and process-specific constraints in prompt design. To address this limitation, EnrichGT provides a user interface for specifying such constraints, although this feature was not used during the current evaluation.
For usability assessment, we conducted a two-stage, task-based evaluation. In Stage 1, using the R package in RStudio, participants completed four tasks on a provided gene list (ORA, GSEA, Recluster Analysis, and LLM-based annotation). Completion was 11 of 12 tasks overall (A: 3 of 4 due to an incorrect API key for LLM annotation; B: 4 of 4; C: 4 of 4), with total time per participant of 13, 7, and 5 min and critical errors of 7, 3, and 2, respectively. In Stage 2, using the EnrichGT Web Interface (Shiny), all participants completed all tasks (12 of 12), with shorter total times of approximately 7, 5, and 4 min and fewer critical errors (1, 0, 0) [Supplementary Table 2]. These results indicate that the web interface improves task completion, reduces errors, and lowers time burden, supporting the clinician-friendly positioning of EnrichGT; screenshots and usage details are provided in the Supplementary Figure 5.
To demonstrate the real-world clinical utility of EnrichGT, we present an analysis of treatment responses to immunotherapy in a non-small cell lung cancer (NSCLC) cohort[19]. As shown in Figure 5A and B, clinicians can use EnrichGT on local computers without coding expertise. The platform successfully summarized patient-level bulk RNA sequencing (RNA-seq) profiles from immunotherapy responders into interpretable maps of pathway activation and tumor microenvironment states. This workflow preserves patient privacy while generating dynamic reports. The approach shortens time-to-interpretation and standardizes how complex molecular data are summarized for case reviews, cross-disciplinary conferences, and longitudinal patient or cohort comparisons. These features facilitate clinician participation such as molecular tumor boards and support clinical decision-making tailored to each patient’s unique molecular landscape
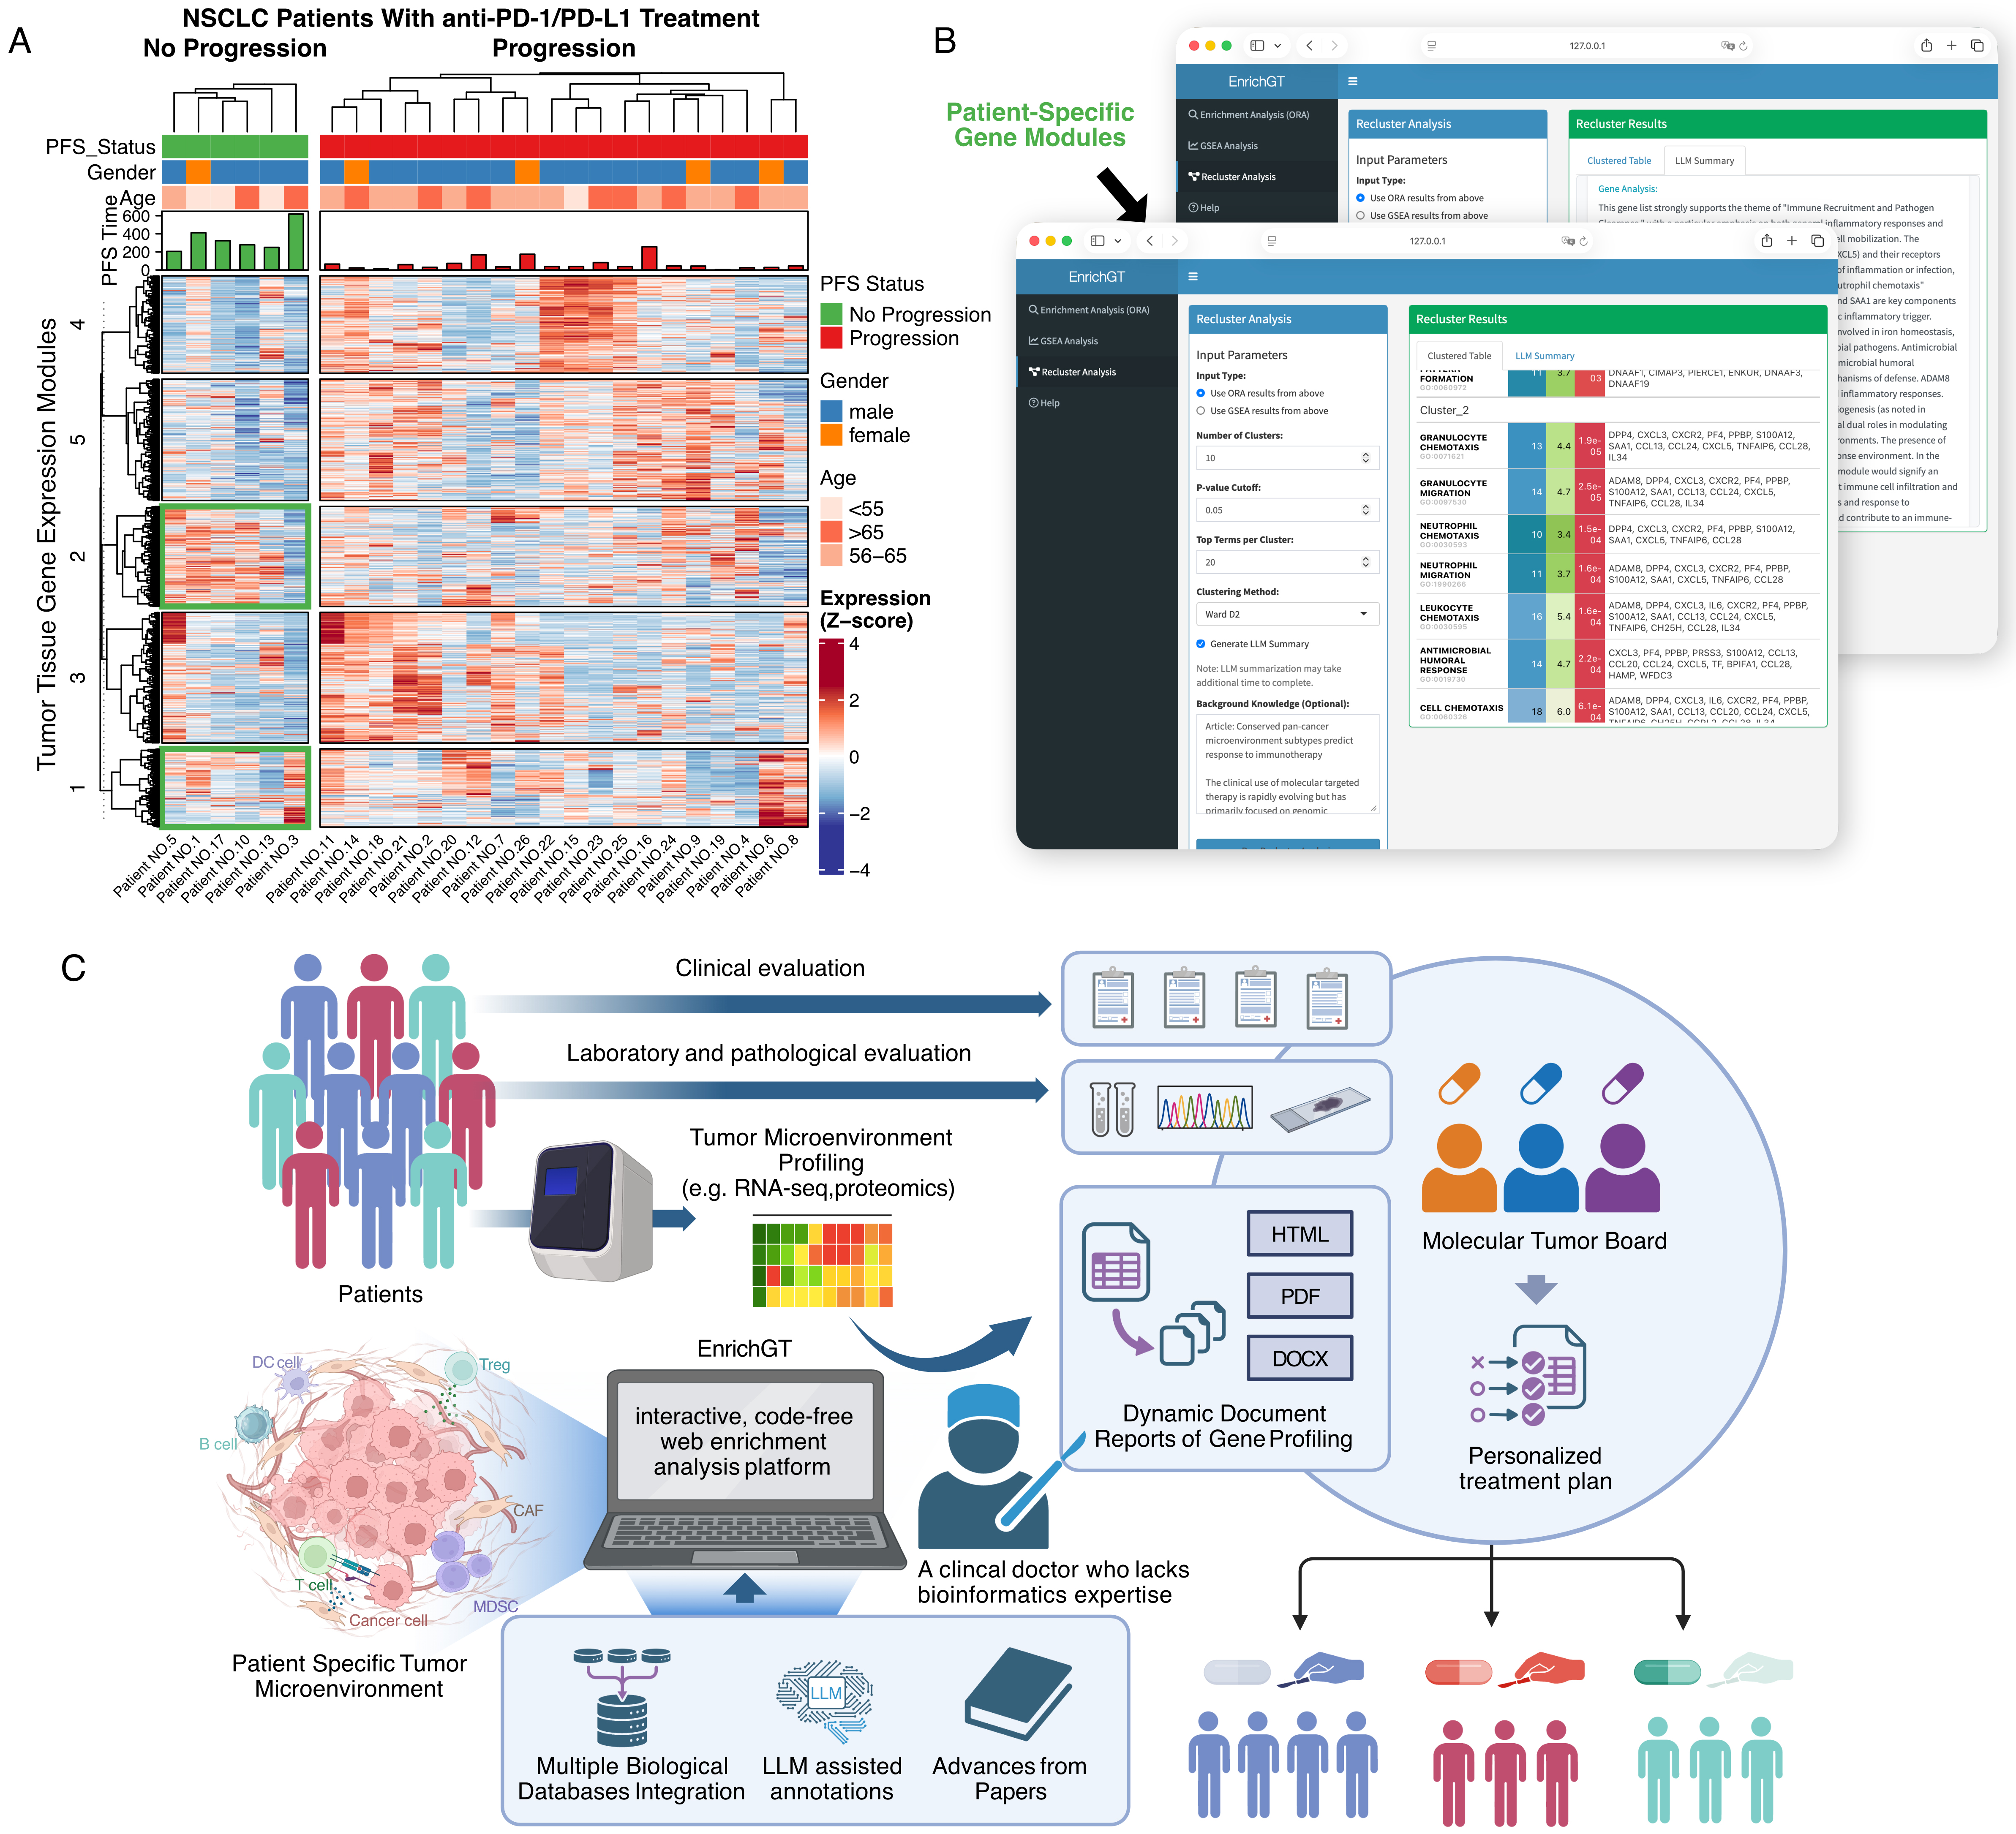
Figure 5. EnrichGT enables clinically interpretable, privacy-preserving analysis of immunotherapy response in NSCLC. (A) Heatmap of bulk RNA-seq profiles from tumor tissues of non-small cell lung cancer (NSCLC) patients treated with anti-PD-1/PD-L1. Columns represent individual patients grouped by progression-free survival (PFS; no progression vs. progression). Rows represent tumor tissue gene-expression modules identified by hierarchical clustering. Top annotation bars indicate PFS status, gender, and age group; bar plots show PFS time. Gene-expression values are displayed as Z-scores; (B) Example of the EnrichGT graphical interface running locally on a clinician’s computer. Patient-specific gene modules derived from bulk RNA-seq are uploaded and analyzed without the need for coding. The platform summarizes module-level enrichment results into interpretable tables and pathway maps, highlighting dysregulated pathways and tumor microenvironment features for each patient; (C) Schematic of the proposed clinical workflow. Patients undergo clinical, laboratory, and pathological evaluation followed by tumor microenvironment profiling (e.g., RNA-seq, proteomics). The resulting data are analyzed with EnrichGT, an interactive, code-free enrichment analysis platform that integrates multiple biological databases, LLM-assisted annotations, and up-to-date literature. EnrichGT generates dynamic gene-profiling reports (HTML/PDF/DOCX) that can be reviewed by molecular tumor boards and practicing clinicians, facilitating standardized interpretation of complex molecular data and supporting personalized treatment planning for individual patients. “Figure 5C” created in BioRender. xwk, g. (2026). https://BioRender.com/5o1azy5. PD-1: Programmed cell death protein 1; PD-L1: programmed cell death ligand 1; PFS: progression-free survival; LLM: large language model; DC cell: dendritic cell; B cell: B lymphocyte; T cell: T lymphocyte; CAF: cancer-associated fibroblast; MDSC: myeloid-derived suppressor cell; Treg: regulatory T cell; HTML: hypertext markup language; PDF: portable document format; DOCX: office open XML document; XML: extensible markup language; Z-score: standard score; ORA: over-representation analysis; GSEA: Gene Set Enrichment Analysis.
DISCUSSION
The increasing accessibility and scale of transcriptomic, proteomic, and other omics technologies demand analytical tools that are efficient, flexible, and secure. EnrichGT addressed these requirements, particularly for large-scale clinical cohorts and biobanks where data privacy, integration capabilities, and dynamic workflows are essential.
Data security and integration remain critical in clinical and sensitive research domains[21,22]. EnrichGT provided a fully local analysis environment, eliminating the need to transfer potentially identifiable genomic data to external web servers. Unlike web-based platforms such as Metascape or DAVID (https://davidbioinformatics.nih.gov/)[9,23], which require data upload to external servers, EnrichGT operates entirely within local or institutional computing environments. This architecture not only eliminates potential privacy breaches but also enables direct API integration through frameworks such as Shiny or Plumber, making it particularly suitable for sensitive clinical datasets.
The open-source nature of EnrichGT ensures transparency and reproducibility, a crucial requirement for regulatory compliance in translational research. Moreover, its intuitive design, streamlined workflows, and integrated LLM-assisted annotation further enable clinicians without specialized computational expertise to rapidly conduct enrichment analyses and derive clinically actionable insights. By lowering the technical barrier for functional genomics, EnrichGT facilitates the integration of omics-based evidence into clinical decision-making.
LLMs in biomedical analysis pose risks of hallucination and bias, and impose strict requirements for privacy, interpretability, and deployability. Hallucination refers to fluent but fabricated statements or biologically irrelevant associations. A recent survey on biomedical LLMs highlighted these concerns and recommended grounded generation and locally deployable workflows for clinical use[23]. In EnrichGT, we addressed these issues through several strategies. First, we constrained model inputs to cluster-level, evidence-bounded contexts constructed using a DTM, cosine distance, and hierarchical clustering (ORA uses hit genes; GSEA uses core enrichment genes). Second, we linked each generated statement to explicit pathway identifiers and statistics. Third, we employed standardized, version-pinned prompts. We implemented multi-stage LLM-assisted annotation of clustering results to accommodate the limited context window of LLMs. In this study, the LLM component served as an optional post hoc annotation layer to support hypothesis generation rather than as a decision engine. Subjective evaluation by a cohort of clinicians confirmed the utility of this approach in assisting researchers and clinicians to interpret the biological outcomes of enrichment analysis. However, this prompt engineering-based LLM integration remains limited. Future work will incorporate retrieval-augmented grounding and calibration or uncertainty metrics to further reduce hallucination and flag low-confidence statements. Until these issues are addressed, we confine LLM use to the post-clustering annotation step to mitigate potential risks. Core inference, enrichment statistics, clustering, and pathway or regulator activity estimation rely on established, auditable methods. The LLM adds module-level titles, concise summaries, and assists researchers in prioritizing potentially important genes and regulators without altering the underlying evidence.
The dynamic reporting framework in EnrichGT also offered potential benefits. While existing tools typically generate static outputs[24], EnrichGT’s native integration with Rmarkdown and Quarto enabled automated generation of interactive, updatable reports. This capability is particularly valuable for longitudinal biobank studies and clinical cohorts where data evolve over time[25,26]. Researchers can systematically document analytical iterations with version control, substantially enhancing reproducibility in large-scale collaborative projects.
From a methodological perspective, EnrichGT introduced a lightweight approach to biological pattern discovery through pathway-candidate gene co-occurrence matrix clustering. This technique efficiently decomposed complex enrichment results into atomic biological themes, reducing redundancy commonly observed in conventional pathway analyses. This framework also allowed the integration of multiple database sources, enabling cross-referencing and mutual validation to enhance the biological interpretability of results. The resulting thematic clusters often reveal subtle but biologically meaningful patterns that might otherwise remain obscured in traditional gene-set enrichment outputs. Importantly, the package maintained flexibility in database incorporation, allowing users to supplement standard annotation resources with custom gene sets tailored to specific disease contexts. This capability was particularly valuable for studying rare disorders or under-characterized pathological mechanisms[27].
Recent studies in single-cell RNA-seq clustering have shown that upstream denoising and manifold-preserving representations influenced downstream biological interpretation[28]. As an example, deep imputation bi-stochastic graph-regularized matrix factorization (DSINMF) first performed feature selection, dropout imputation, and dimensionality reduction, then applied deep matrix factorization under an adaptive bi-stochastic similarity graph and was optimized using the alternating direction method of multipliers. Within this context, we positioned EnrichGT as a post-clustering pathway enrichment and thematic summarization tool: we aggregated evidence at the cluster level (ORA, used hit genes; GSEA, used core enrichment genes), organized results with a pathway-term matrix using cosine distance and hierarchical clustering, and restricted LLMs to post hoc annotation without modifying statistical evidence. Consequently, EnrichGT seamlessly consumed cluster-specific gene sets produced by upstream methods such as DSINMF while maintaining a transparent and auditable evidence trail.
Complex experimental designs, such as multi-condition or time-series studies common in clinical omics, generate numerous enrichment results that can be challenging to interpret cohesively. EnrichGT provided comparative clustering methods that organize enrichment results across disease conditions, offering an intuitive visualization and analytical framework for identifying shared and condition-specific biological themes. This approach delivers a more holistic overview than sequentially listing individual results, enhancing interpretability for multifaceted datasets.
The incorporation of LLM-assisted interpretation offers a practical solution to the interpretational challenges inherent in high-throughput data analysis[29]. While not replacing expert evaluation, this feature helped researchers rapidly generate testable hypotheses from complex results, particularly when dealing with large datasets where manual curation becomes impractical. The current implementation focuses on general biological interpretation, with opportunities for future specialization through domain-specific fine-tuning.
For clinicians, EnrichGT provides a fast and interpretable functional annotation layer that transforms high-throughput gene lists into coherent and clinically relevant biological summaries. Its workflow is easy to operate on routine clinical workstations and does not require specialized bioinformatics expertise, thereby lowering the technical barrier to molecular data interpretation. Moreover, its emphasis on intuitive visualization and structured, standardized summaries is consistent with prevailing directions in precision medicine and individualized patient care, where high-quality and user-friendly digital tools have been shown to enhance the quality of multidisciplinary clinical discussions (e.g., molecular tumor board deliberations) and to accelerate case preparation in time-constrained settings[30]. By providing mechanism-oriented and clinically meaningful insights, EnrichGT facilitates cross-disciplinary dialogue and integrates seamlessly into existing diagnostic and governance pathways.
Several limitations should be noted. First, the LLM annotation component showed variable performance across specialized subfields, reflecting the limits of general-purpose foundation models for niche biomedical domains; in EnrichGT, we, therefore, restrict LLM outputs to hypothesis generation, require expert review, and ground inputs at the cluster level, but domain-specific optimization remains an important direction. Second, our usability evidence is preliminary: the two-stage, task-based assessment involved three clinicians from a single institution and a fixed sequence (R package then web interface), which may introduce learning effects; the study focused on short-term task metrics (completion, time, critical errors) and did not evaluate downstream clinical decision quality or patient outcomes. Third, the pipeline depends on curated resources (GO, KEGG, Reactome, PROGENy, CollecTRI); coverage gaps, update cycles, and database-specific biases can influence which themes are discoverable, and pathway or TF (transcription factor) activity estimates inferred from expression may miss regulation at the protein or post-translational level. Fourth, clustering results can be sensitive to representation and parameters: document-term matrix construction, cosine distance, and linkage choices may alter module boundaries; EnrichGT exposes these options, but we did not systematically benchmark all combinations against alternative graph-based or semantic similarity approaches. Fifth, computational efficiency on extremely large inputs (very large gene sets or many conditions) could be improved; memory footprint and runtime of DTM construction and clustering point to opportunities for more aggressive parallelization and sparse or disk-based backends. Sixth, custom database integration still requires substantial computational expertise, including reliable gene identifier mapping and format validation; although the Shiny web interface lowers the barrier for routine analyses, advanced customization remains non-trivial. Finally, when cloud-hosted LLMs are used, correct API configuration is required, and access or cost constraints at some sites may limit adoption. Future development will address these issues by expanding pre-processed annotation resources, adding robustness checks for clustering stability, and exploring more explicit calibration and retrieval grounded strategies for LLM outputs.
In conclusion, EnrichGT offered a lightweight and integrative solution for gene and protein enrichment analysis designed to meet the evolving demands of modern omics research, particularly within clinical and large-cohort settings. By combining local execution for data privacy, dynamic reporting for longitudinal studies, a novel thematic decomposition approach for biological insight, flexible database support, efficient multi-condition comparison, and LLM-assisted annotations, it bridges several gaps in existing analytical frameworks. Moreover, its intuitive design and artificial intelligence (AI)-assisted interpretation enable clinicians to perform functional genomics analyses and rapidly derive clinically actionable insights without extensive computational expertise. Nevertheless, formal claims of clinician-friendliness would be strengthened by a larger, multi-institutional usability study, which we consider a priority for future work. As omics data generation continues to expand in scale and complexity, tools such as EnrichGT, which prioritize clinician-friendly interfaces, AI-driven interpretability, and efficient biological interpretation, will be crucial for extracting meaningful insights to advance biomedical discovery and clinical translation.
DECLARATIONS
Acknowledgements
We sincerely acknowledge the developers of the widely recognized clusterProfiler package, whose groundbreaking work provided the initial inspiration for EnrichGT. Although, since version 0.5, the core enrichment functions of EnrichGT have been implemented independently to ensure a more lightweight user experience, the development of our package would not have been possible without the foundational contributions and insights from clusterProfiler.
Authors’ contributions
Conceived and designed the study, developed the EnrichGT package, performed data analyses, and drafted the manuscript: Wang R, Ye Z
Contributed to method development, interpretation of results, and manuscript revision: Wang Q, Liang B
Provided critical insights, assisted in data interpretation, and revised the manuscript for important intellectual content: Fu N, Wang W, Deng H, Zhu T, Zeng S, Zhang Y, Jiang S, Huang Y, Liang H
Jointly supervised the study, provided funding support, critically revised the manuscript, and approved the final version for publication: Liang W, He J, Zou X
Wang R, Ye Z, Wang Q, and Liang B contributed equally to this work. All authors have read and agreed to the published version of the manuscript.
Availability of data and materials
The data analyzed in this study are publicly available from the sources described in the article. EnrichGT is an open-source R package available on GitHub at https://github.com/runchenwang-dev/EnrichGT. All relevant information, example datasets, and detailed documentation for reproducing the analyses are provided in the repository. The NSCLC patients with anti-PD-1/PD-L1 treatment cohort is obtained from the GEO database (GSE135222).
Financial support and sponsorship
This work was supported by the R&D Program of Guangzhou National Laboratory, Grant No. SRPG22-017, Guangzhou, China.
Conflicts of interest
He J is an Editorial Board Member of the journal Artificial Intelligence Surgery. He J was not involved in any steps of the editorial process, notably including reviewers’ selection, manuscript handling, or decision-making. The other authors declare that there are no conflicts of interest.
Ethical approval and consent to participate
Not applicable.
Consent for publication
Not applicable.
Copyright
© The Author(s) 2026.
Supplementary Materials
REFERENCES
1. Vitorino R. Transforming clinical research: the power of high-throughput omics integration. Proteomes. 2024;12:25.
2. Zeng ISL, Lumley T. Review of statistical learning methods in integrated omics studies (an integrated information science). Bioinform Biol Insights. 2018;12:1177932218759292.
3. Subramanian A, Tamayo P, Mootha VK, et al. Gene set enrichment analysis: a knowledge-based approach for interpreting genome-wide expression profiles. Proc Natl Acad Sci U S A. 2005;102:15545-50.
4. Ontology Consortium. The Gene Ontology resource: enriching a GOld mine. Nucleic Acids Res. 2021;49:D325-34.
5. Sun D, Liu Y, Zhang XS, Wu LY. CEA: combination-based gene set functional enrichment analysis. Sci Rep. 2018;8:13085.
6. Chicco D, Agapito G. Nine quick tips for pathway enrichment analysis. PLoS Comput Biol. 2022;18:e1010348.
7. Li W, Shih A, Freudenberg-Hua Y, Fury W, Yang Y. Beyond standard pipeline and p < 0.05 in pathway enrichment analyses. Comput Biol Chem. 2021;92:107455.
8. Wu T, Hu E, Xu S, et al. clusterProfiler 4.0: a universal enrichment tool for interpreting omics data. Innovation. 2021;2:100141.
9. Zhou Y, Zhou B, Pache L, et al. Metascape provides a biologist-oriented resource for the analysis of systems-level datasets. Nat Commun. 2019;10:1523.
10. Gentleman RC, Carey VJ, Bates DM, et al. Bioconductor: open software development for computational biology and bioinformatics. Genome Biol. 2004;5:R80.
11. Huber W, Carey VJ, Gentleman R, et al. Orchestrating high-throughput genomic analysis with Bioconductor. Nat Methods. 2015;12:115-21.
12. Milacic M, Beavers D, Conley P, et al. The Reactome Pathway Knowledgebase 2024. Nucleic Acids Res. 2024;52:D672-8.
13. Kanehisa M, Goto S. KEGG: kyoto encyclopedia of genes and genomes. Nucleic Acids Res. 2000;28:27-30.
14. Benjamini Y, Hochberg Y. Controlling the false discovery rate: a practical and powerful approach to multiple testing. J R Stat Soc Ser B Stat Methodol. 1995;57:289-300.
15. Korotkevich G, Sukhov V, Budin N, Shpak B, Artyomov MN, Sergushichev A. Fast gene set enrichment analysis. bioRxiv 2016;bioRxiv:060012. Available from https://doi.org/10.1101/060012 [accessed 18 December 2025].
16. gt: easily create presentation-ready display tables. Available from https://gt.rstudio.com [accessed 18 December 2025].
17. Schubert M, Klinger B, Klünemann M, et al. Perturbation-response genes reveal signaling footprints in cancer gene expression. Nat Commun. 2018;9:20.
18. Müller-Dott S, Tsirvouli E, Vazquez M, et al. Expanding the coverage of regulons from high-confidence prior knowledge for accurate estimation of transcription factor activities. Nucleic Acids Res. 2023;51:10934-49.
19. Kim JY, Choi JK, Jung H. Genome-wide methylation patterns predict clinical benefit of immunotherapy in lung cancer. Clin Epigenetics. 2020;12:119.
20. Tsimberidou AM, Kahle M, Vo HH, Baysal MA, Johnson A, Meric-Bernstam F. Molecular tumour boards - current and future considerations for precision oncology. Nat Rev Clin Oncol. 2023;20:843-63.
21. Llorente S, Delgado J. Implementation of privacy and security for a genomic information system based on standards. J Pers Med. 2022;12:915.
22. Filkins BL, Kim JY, Roberts B, et al. Privacy and security in the era of digital health: what should translational researchers know and do about it? Am J Transl Res. 2016;8:1560-80.
23. Dennis G Jr, Sherman BT, Hosack DA, et al. DAVID: database for annotation, visualization, and integrated discovery. Genome Biol. 2003;4:P3.
24. Liu Y, Li G. Empowering biologists to decode omics data: the Genekitr R package and web server. BMC Bioinformatics. 2023;24:214.
25. Sharma V, Cassetti O, Winning L, O'Sullivan M, Crowe M. Protocol for developing a dashboard for interactive cohort analysis of oral health-related data. BMC Oral Health. 2023;23:238.
26. Schmidt CO, Struckmann S, Enzenbach C, et al. Facilitating harmonized data quality assessments. A data quality framework for observational health research data collections with software implementations in R. BMC Med Res Methodol. 2021;21:63.
27. Lassmann T, Francis RW, Weeks A, et al. A flexible computational pipeline for research analyses of unsolved clinical exome cases. NPJ Genom Med. 2020;5:54.
28. Lan W, Chen J, Liu M, et al. Deep imputation bi-stochastic graph regularized matrix factorization for clustering single-cell RNA-sequencing data. IEEE/ACM Trans Comput Biol Bioinform. ;2024:1-11.
29. Zeng Y, Xie J, Shangguan N, et al. CellFM: a large-scale foundation model pre-trained on transcriptomics of 100 million human cells. Nat Commun. 2025;16:4679.
Cite This Article
How to Cite
Download Citation
Export Citation File:
Type of Import
Tips on Downloading Citation
Citation Manager File Format
Type of Import
Direct Import: When the Direct Import option is selected (the default state), a dialogue box will give you the option to Save or Open the downloaded citation data. Choosing Open will either launch your citation manager or give you a choice of applications with which to use the metadata. The Save option saves the file locally for later use.
Indirect Import: When the Indirect Import option is selected, the metadata is displayed and may be copied and pasted as needed.
About This Article
Special Topic
Copyright

Data & Comments
Data
0


Comments
Comments must be written in English. Spam, offensive content, impersonation, and private information will not be permitted. If any comment is reported and identified as inappropriate content by OAE staff, the comment will be removed without notice. If you have any queries or need any help, please contact us at [email protected].