

fig2
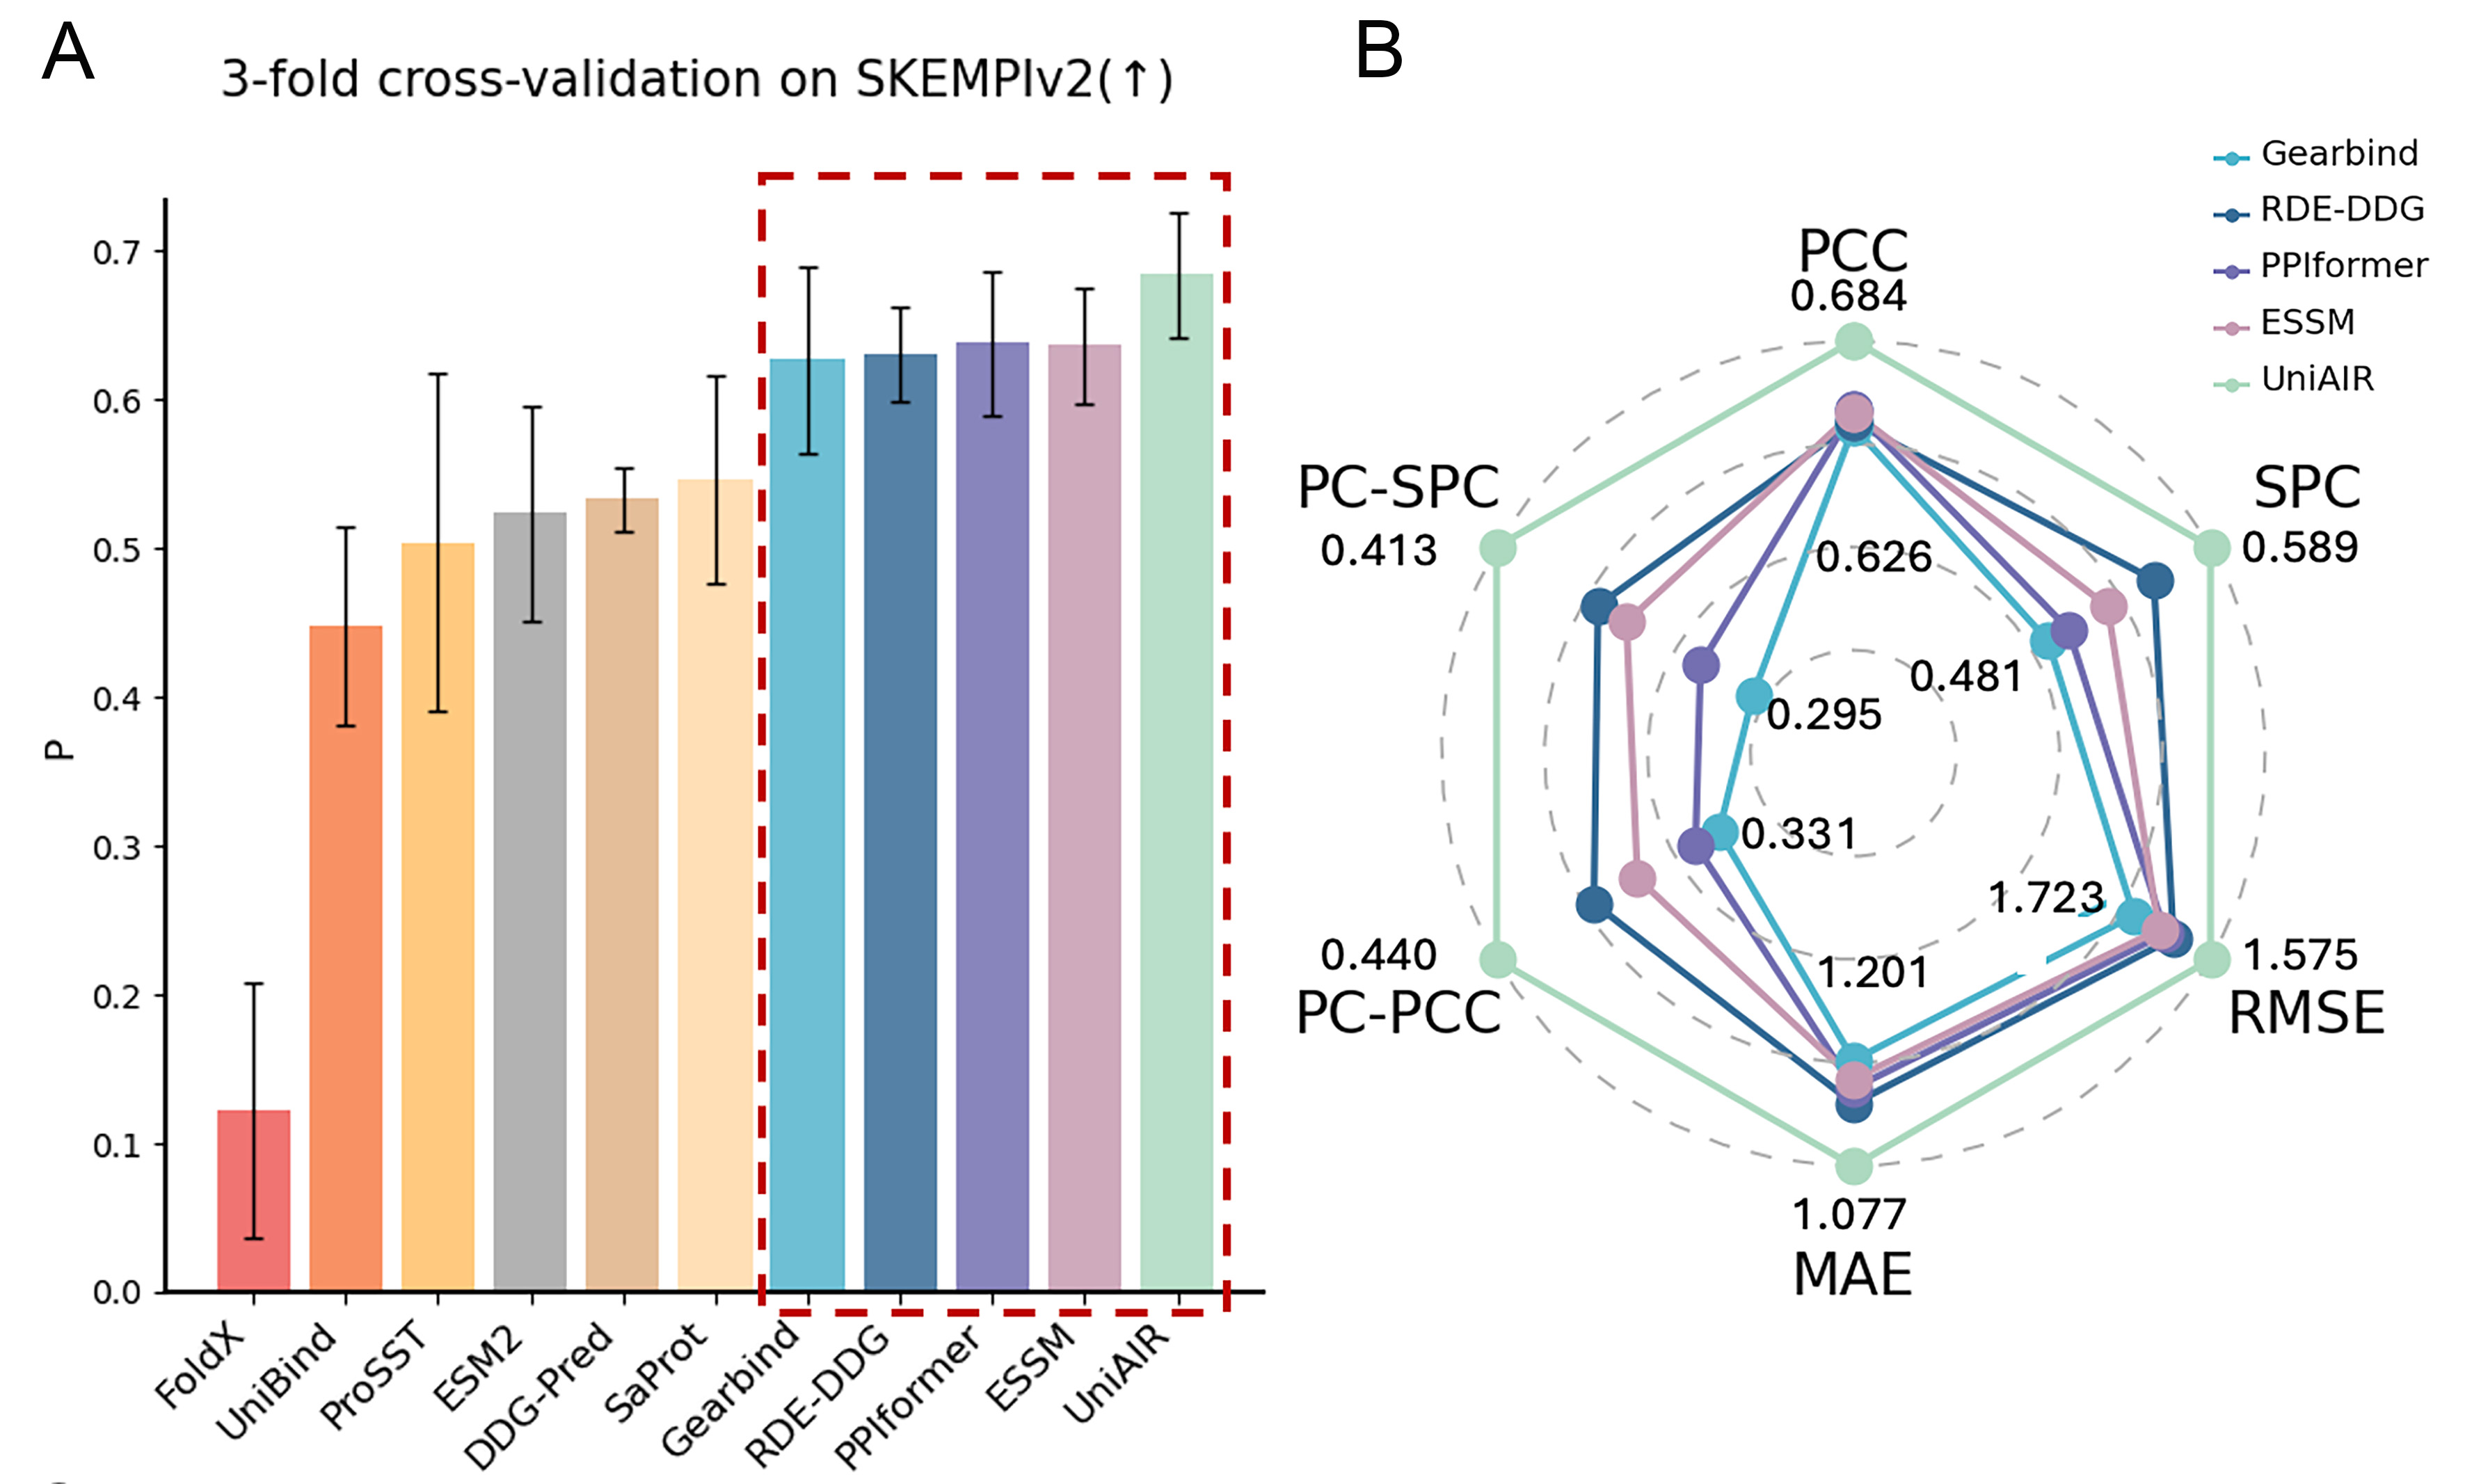
Figure 2. Performance comparison from the UniAIR repository, adapted from the official UniAIR GitHub repository[2]. (A) Three-fold cross-validation on SKEMPIv2; P denotes Pearson correlation coefficient; (B) Radar plot comparing Gearbind, RDE-DDG, PPIformer, ESSM and UniAIR across six performance metrics (PCC, SPC, RMSE, MAE, PC-PCC and PC-SPC). Each colored line connects the circular markers for one model across the six metric axes. RDE-DDG denotes the Relative Distance Embedding-based ΔΔG/binding-affinity baseline used in the figure. Source material is distributed under the repository’s MIT license. PCC: Pearson correlation coefficient; SPC: Spearman correlation coefficient; RMSE: root mean square error; MAE: mean absolute error; PC-PCC: per-complex Pearson correlation coefficient; PC-SPC: per-complex Spearman correlation coefficient.