

fig5
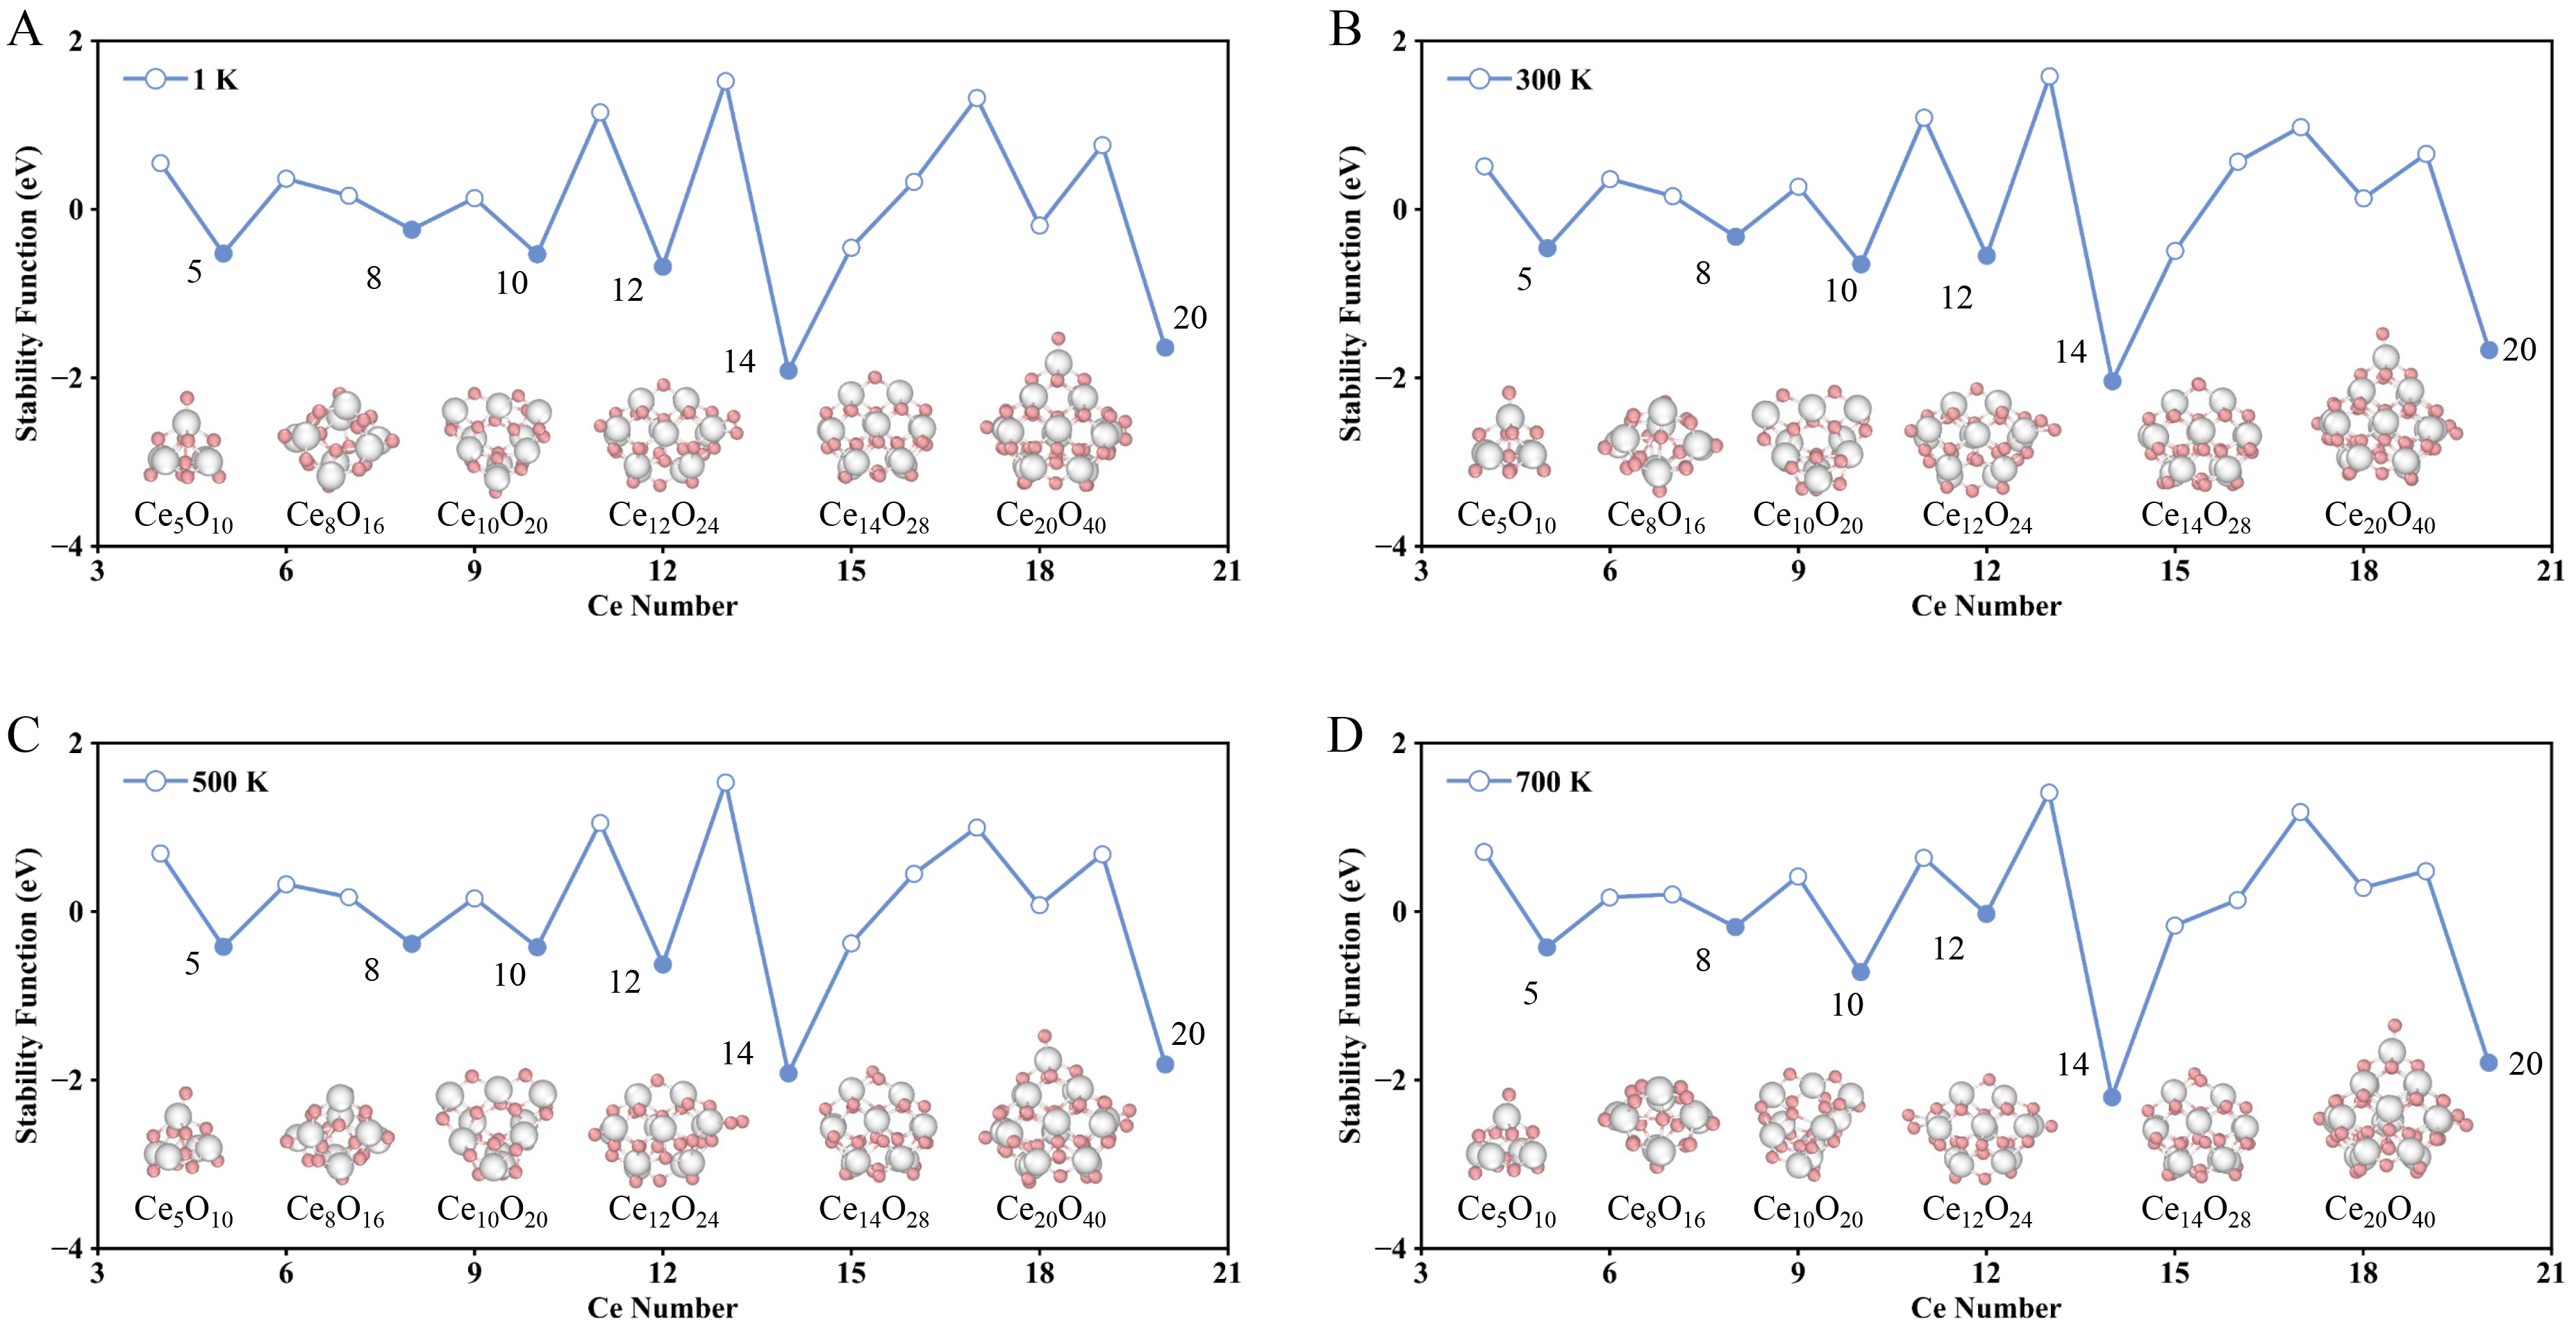
Figure 5. Stability functions and the top 5 relatively stable nanoclusters at different temperatures. In the line chart with data points, blue solid circles represent relatively stable structures, while blue open circles denote relatively unstable ones. (A), (B), (C), and (D) correspond to 1, 300, 500, and 700 K, respectively. Color map: White, Ce atoms; Pink, O atoms.

