

fig4
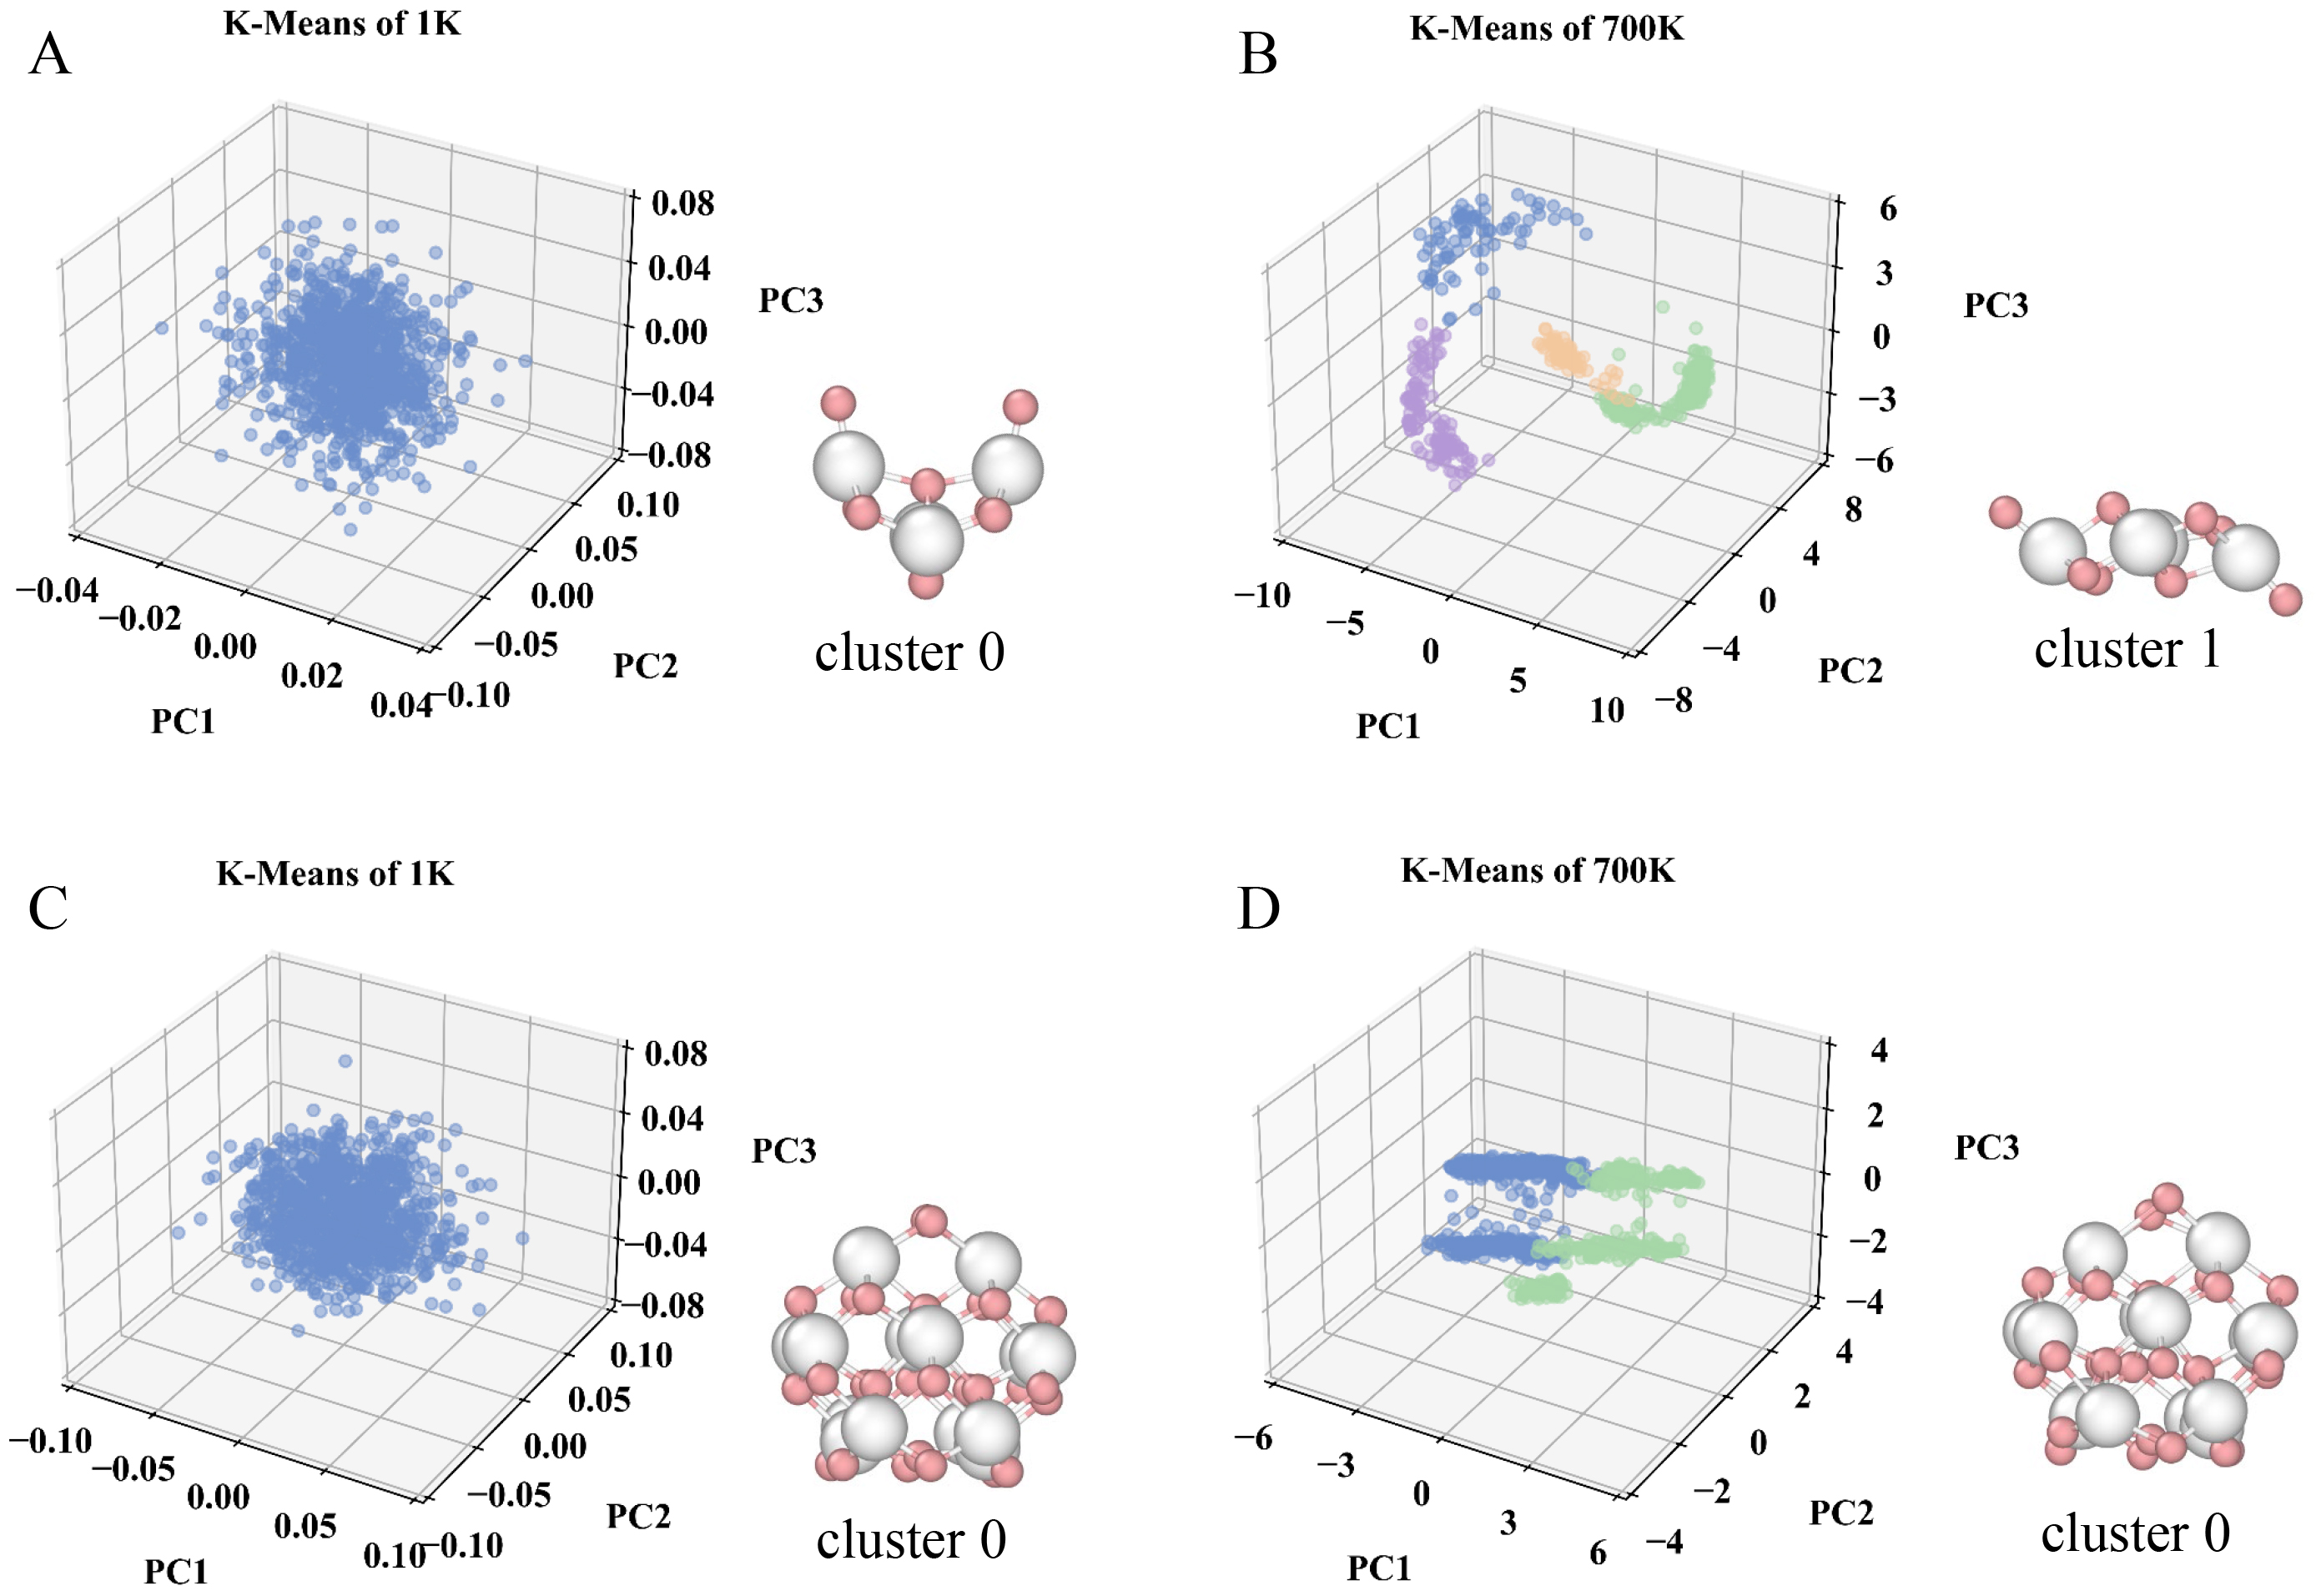
Figure 4. Visualization of clustered nanocluster Ce4O8 and Ce14O28 at different temperatures via PCA dimensionality reduction, along with the representative structure of the largest cluster. (A and B) Clustered Ce4O8 at 1 and 700 K; (C and D) Clustered Ce14O28 at 1 and 700 K. Color map: White, Ce atoms; Pink, O atoms; Blue: cluster 0; Green: cluster 1; Purple: cluster 2; Orange: cluster 3. PCA: Principal component analysis; PC1: principal component 1; PC2: principal component 2; PC3: principal component 3.

