

fig3
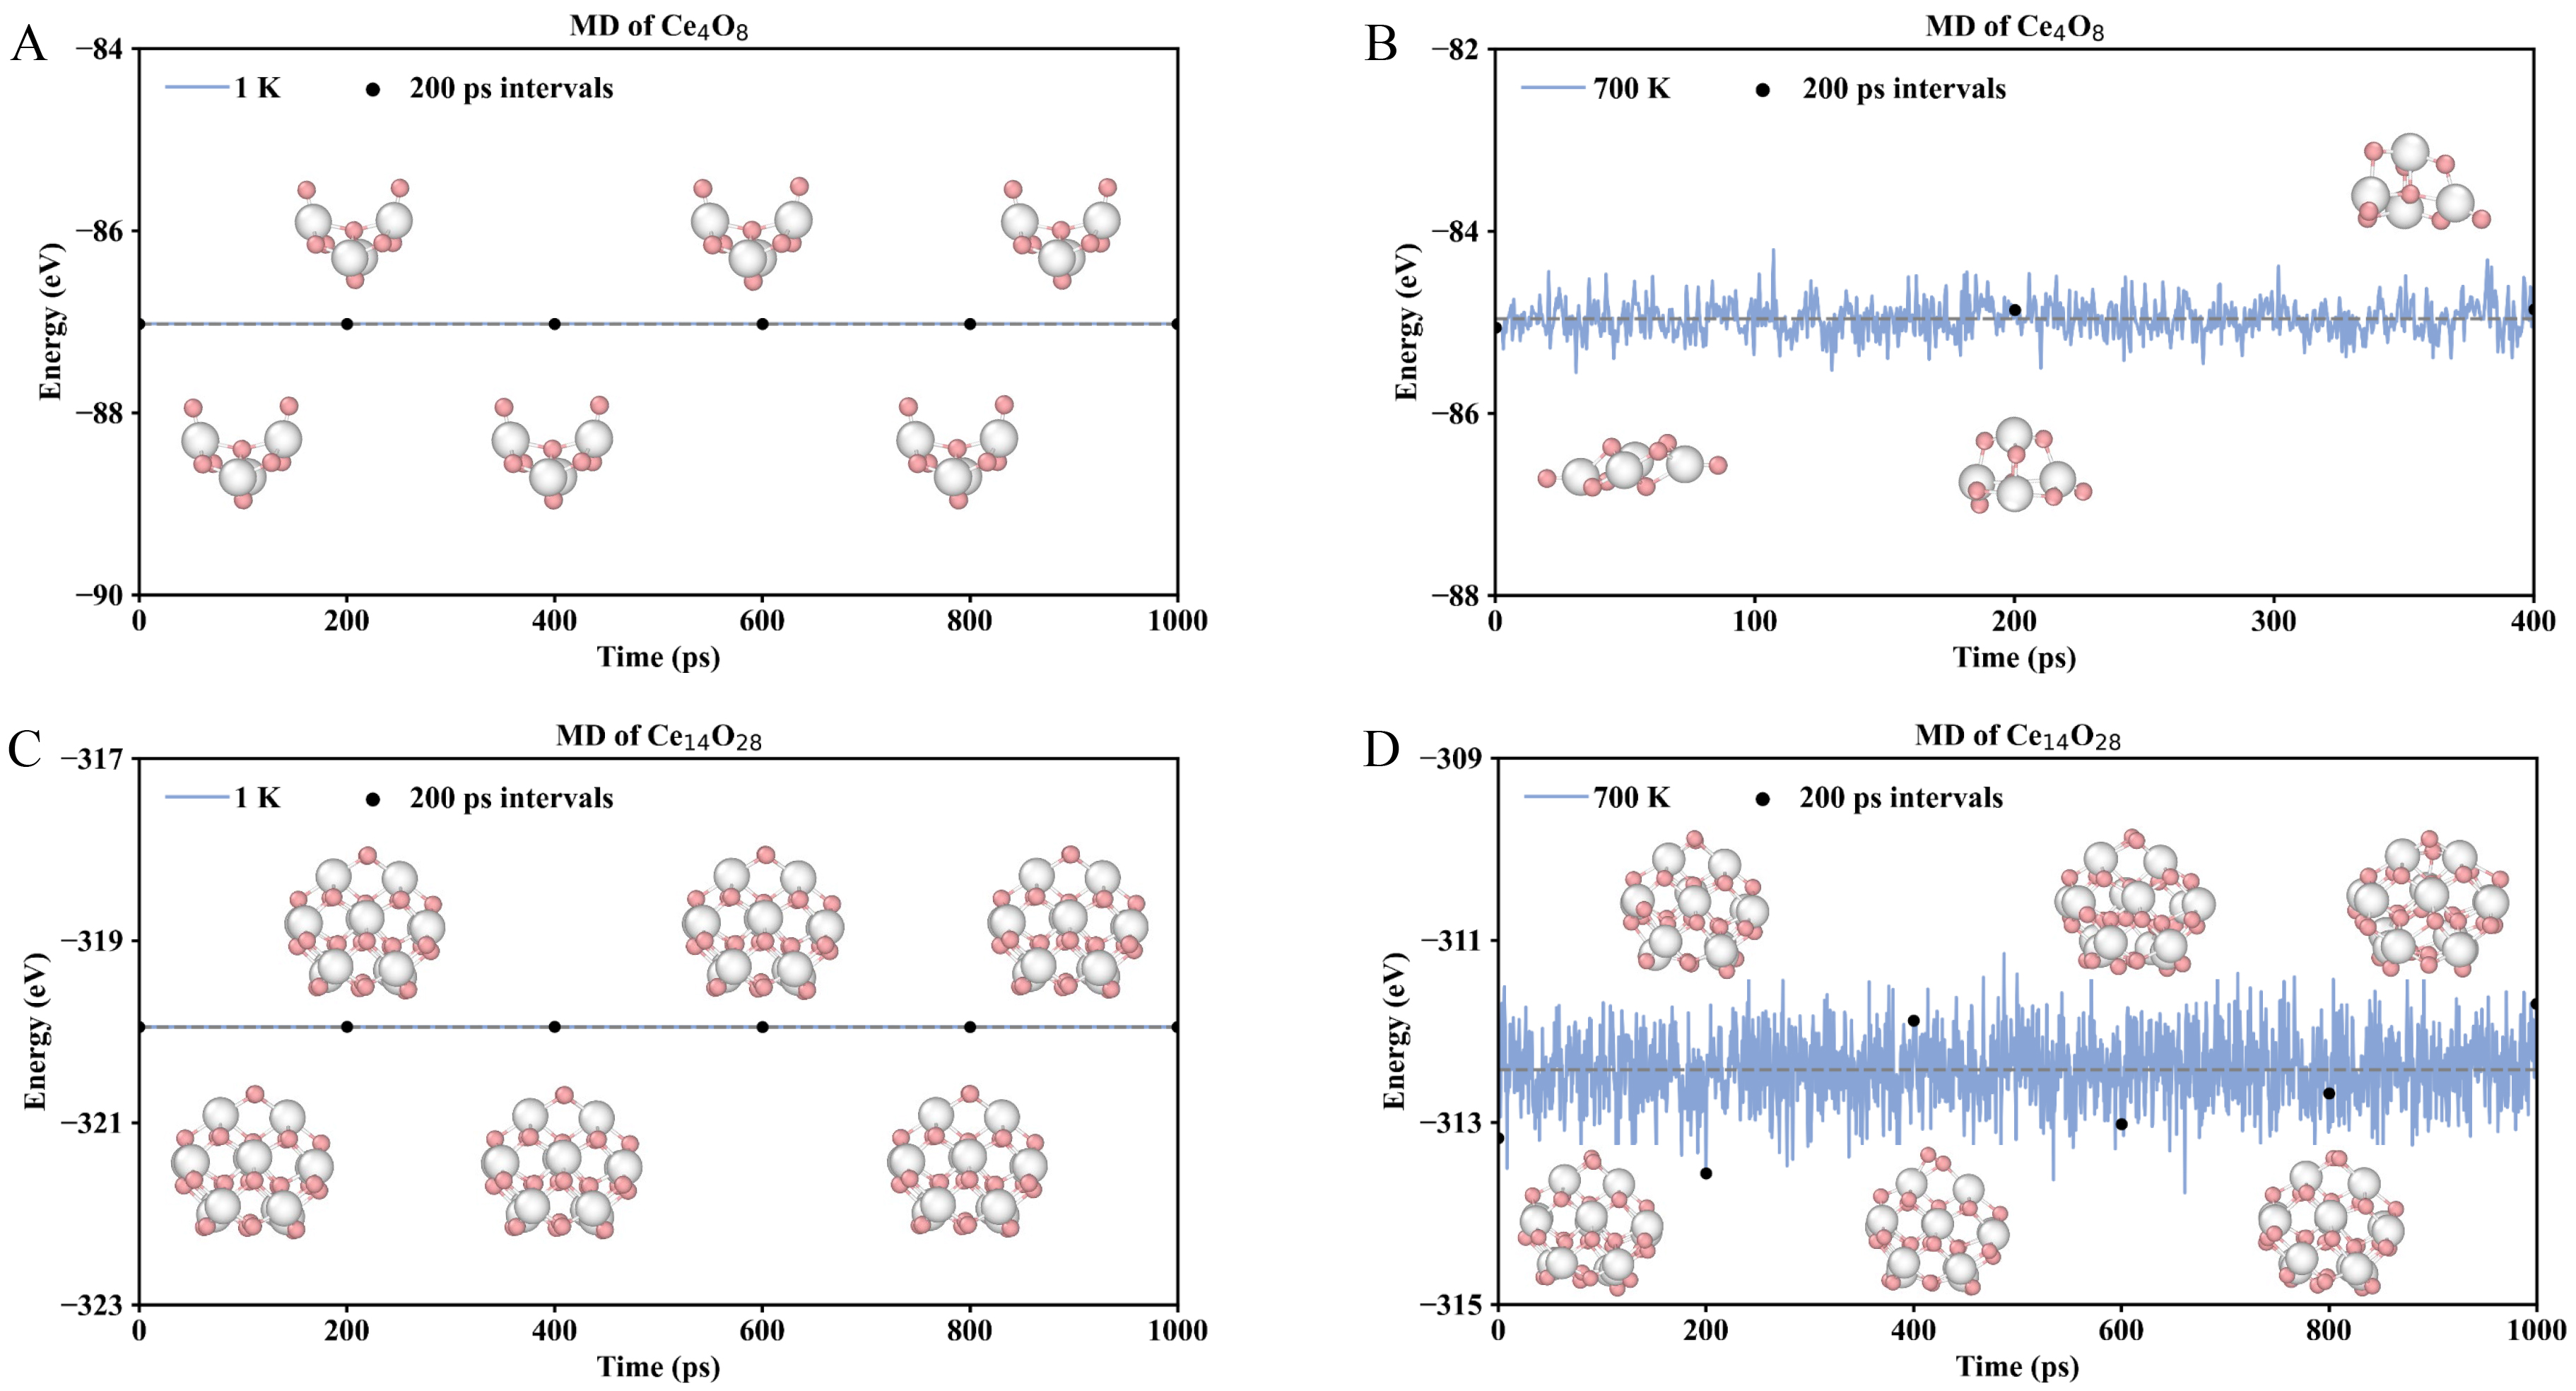
Figure 3. Molecular dynamics (MD) simulations of the cerium oxide nanocluster Ce4O8 and Ce14O28 at 1 K and 700 K, including energies during the simulations and snapshots taken every 200 ps. (A and B) MD simulations of Ce4O8; (C and D) MD simulations of Ce14O28. Color map: White, Ce atoms; Pink, O atoms.

