

fig2
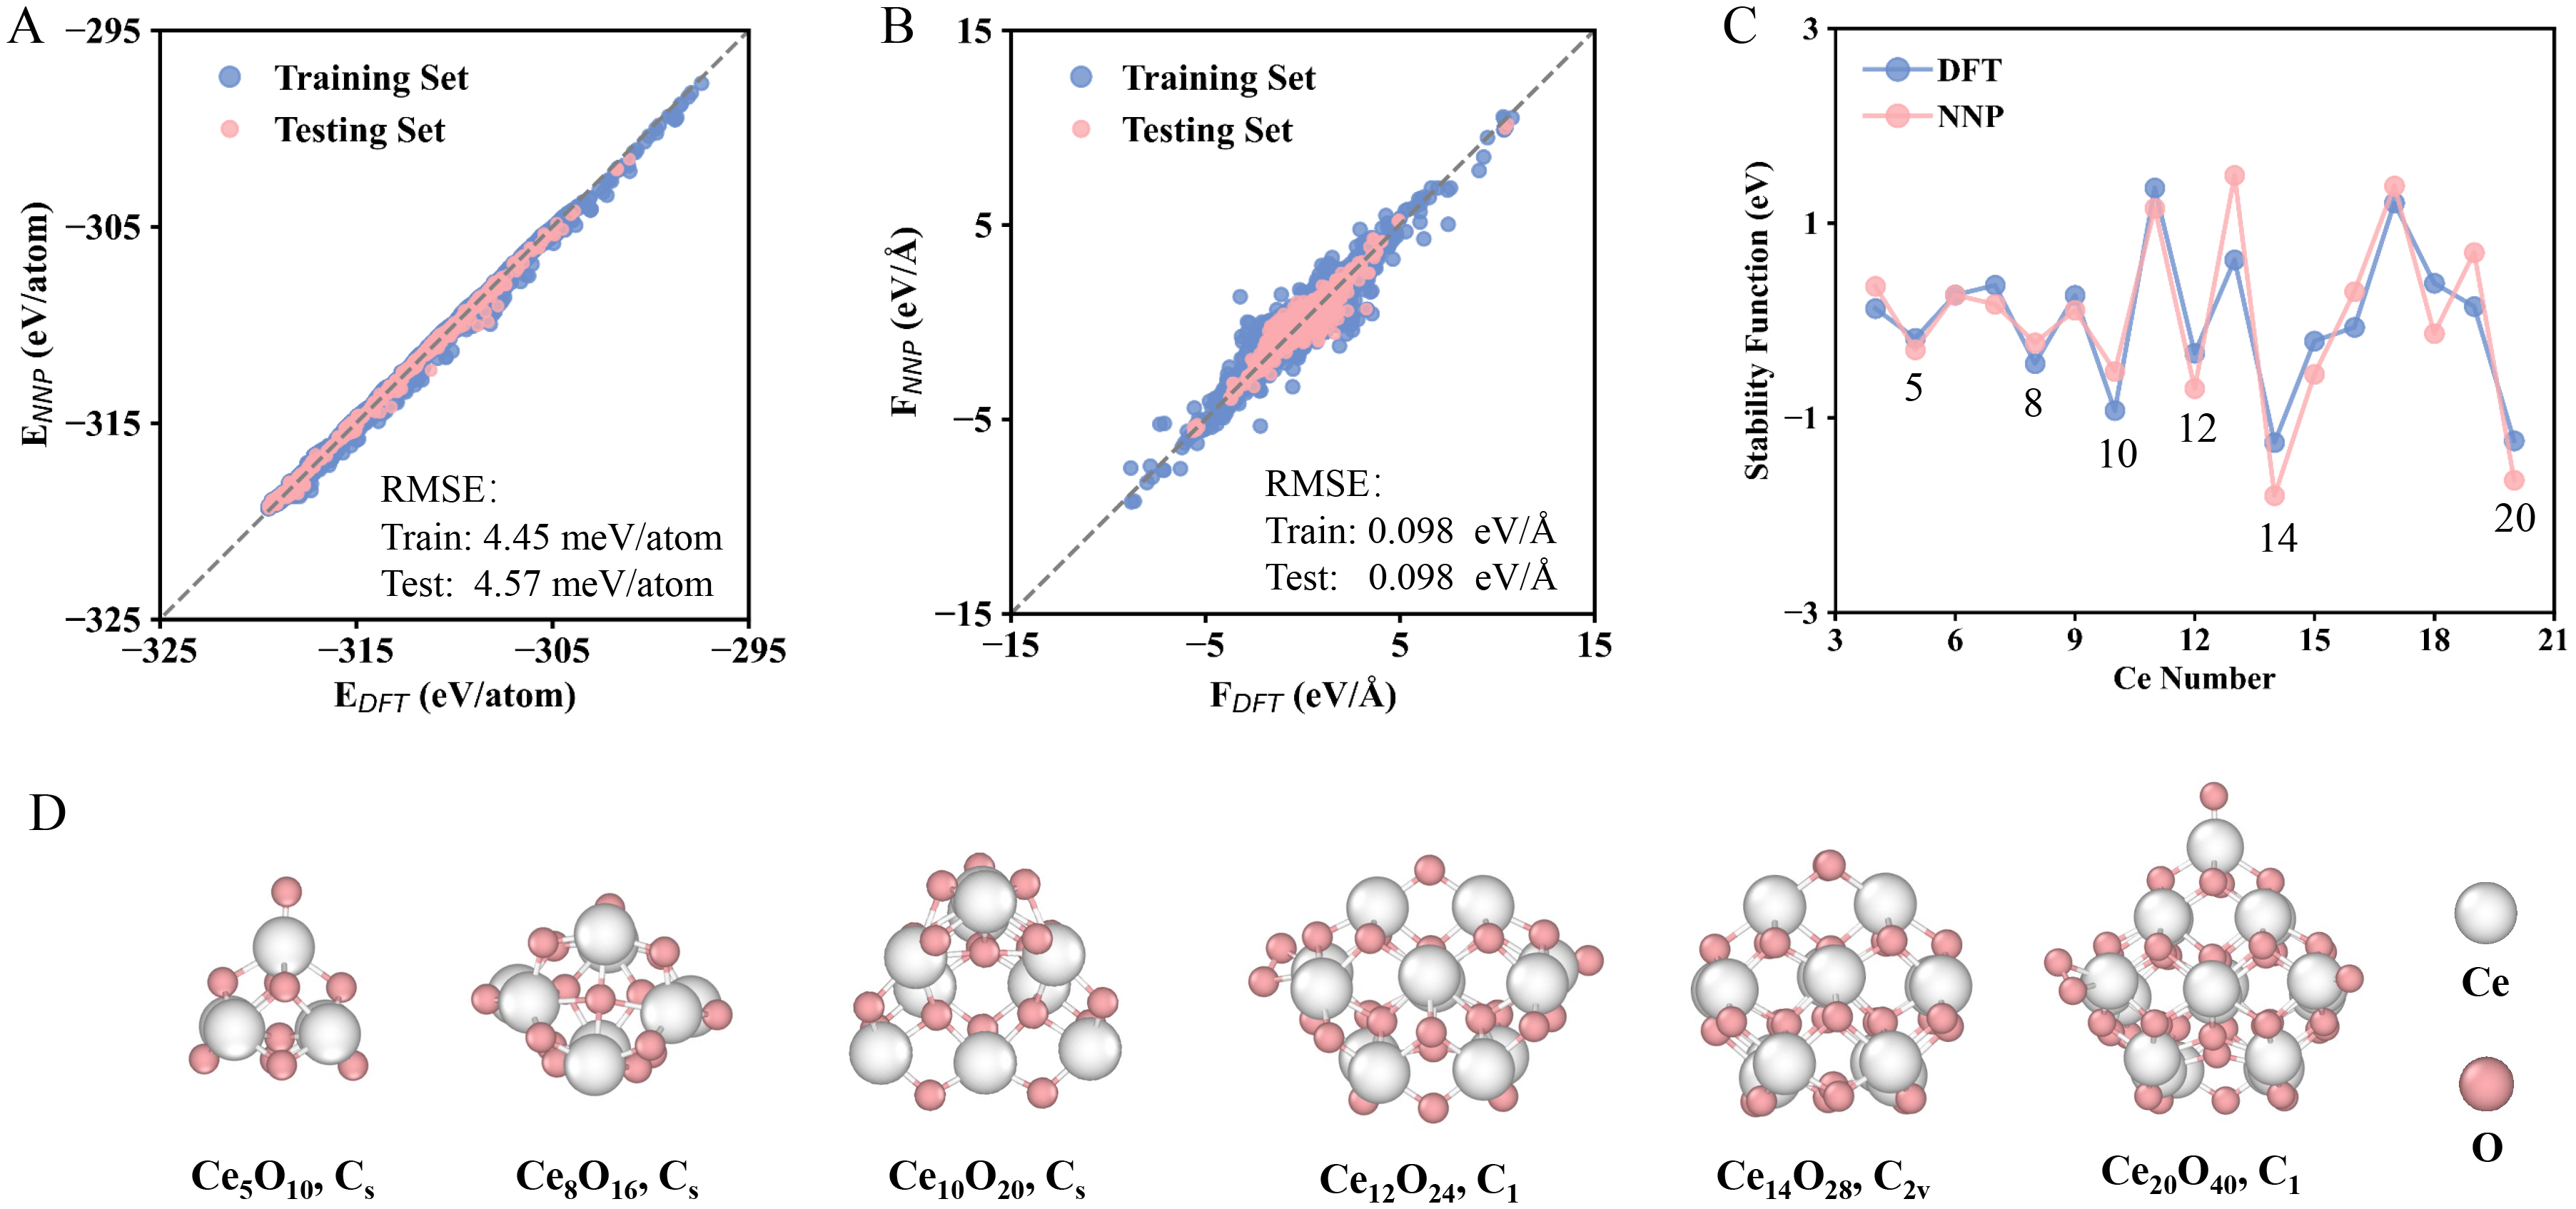
Figure 2. Accuracy and performance of the neural network potential. (A and B) Parity plots comparing the energies and forces predicted by NNP versus reference DFT calculations; (C) Stability function for nanoclusters ranging from Ce3O6 to Ce21O42, as calculated by both the NNP and DFT; (D) Structures of the top six relatively stable cerium oxide clusters identified from the stability function. Color map: White, Ce atoms; Pink, O atoms. NNP: Neural network potential; DFT: density functional theory; RMSE: root-mean-square error.

