

fig1
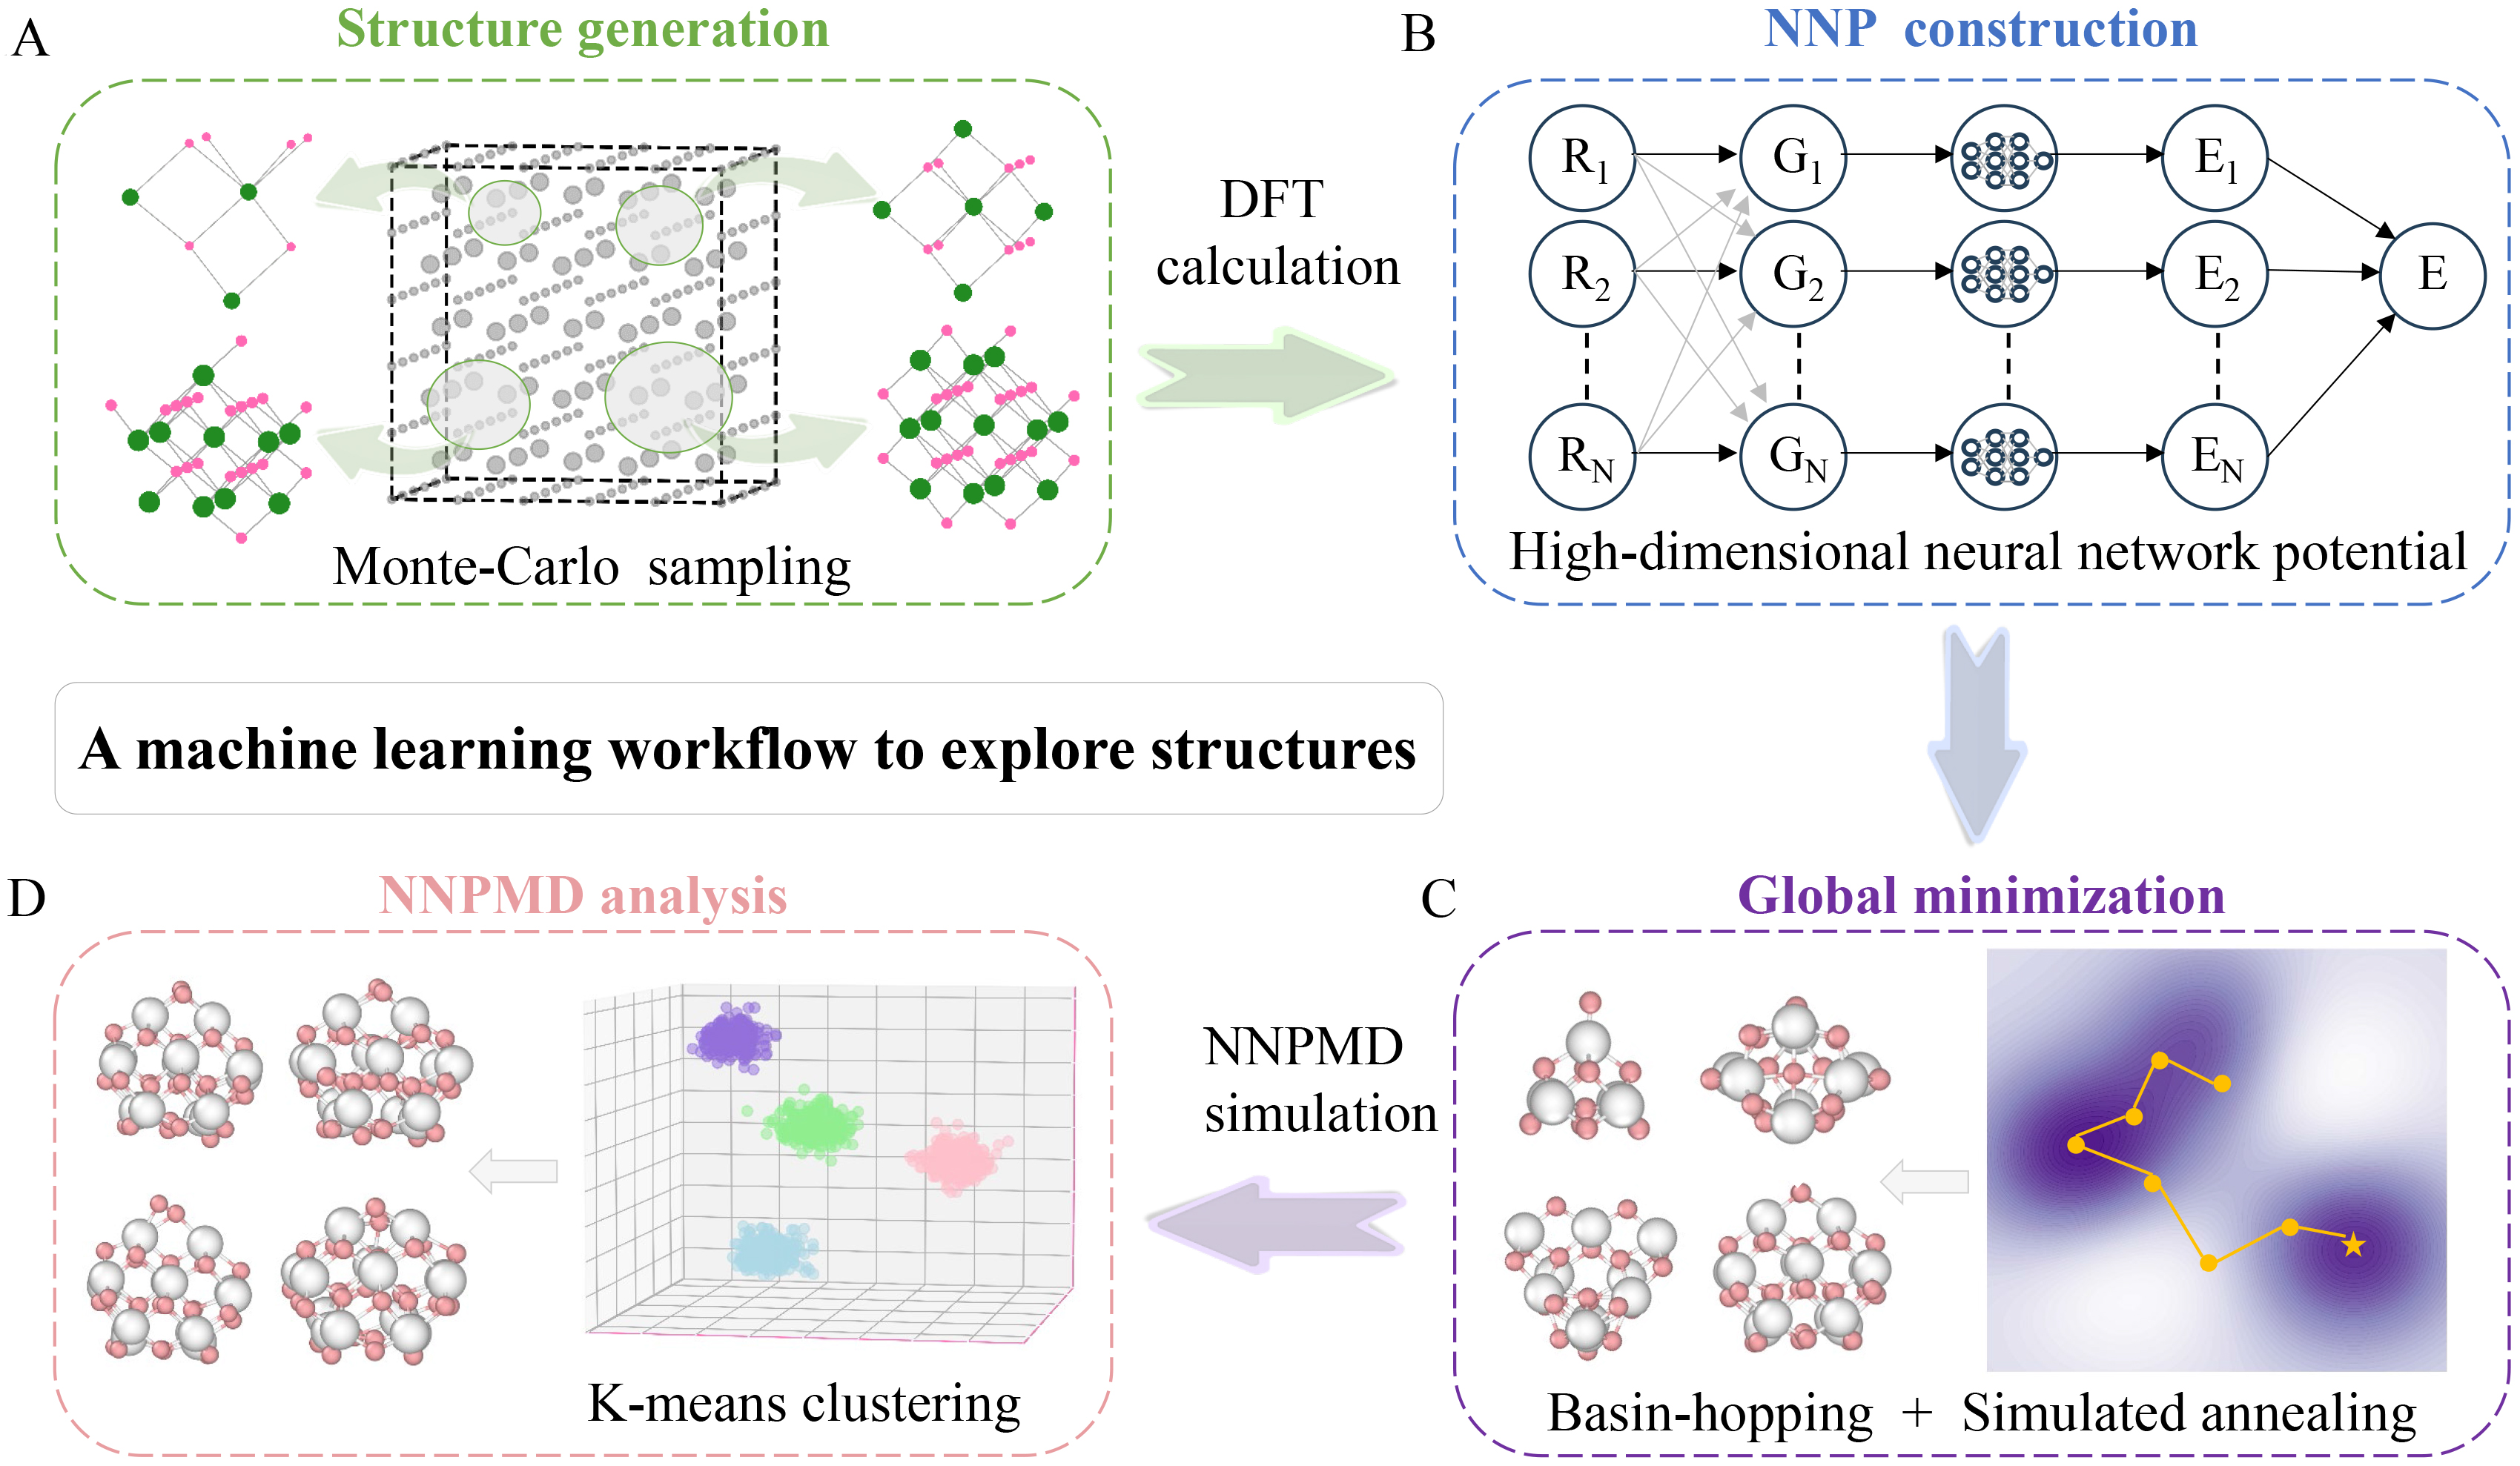
Figure 1. Machine learning workflow to explore structures of cerium oxide nanocluster. (A) Structure generation: Random initial structures are generated by Monte-Carlo sampling from a large bulk cerium oxide model (Gray: bulk atoms; Green: selected Ce atoms; Red: selected O atoms); (B) NNP construction: The high-dimensional neural network potential (HDNNP) maps atomic Cartesian coordinates (Rn) to symmetry functions (Gn), which are then summed to yield the total energy (E). (n: the number of atoms); (C) Global minimization: The right panel is a schematic diagram of the two-dimensional potential energy surface (PES), where search paths (yellow lines) identify the global minimum (yellow asterisk). The color gradient (purple to white) indicates increasing energy. The left panel displays schematic diagrams of the most stable nanocluster with different sizes. (White: Ce atoms; Pink: O atoms); (D) NNPMD analysis: The right panel shows the structures of MD trajectories via principal component analysis (PCA) where different colors represent distinct clusters obtained from K-means clustering. The left panel shows schematic diagrams of representative structures from different clusters (White: Ce atoms; Pink: O atoms). DFT: Density functional theory; NNP: neural network potential; NNPMD: neural network potential molecular dynamics.

