

fig5
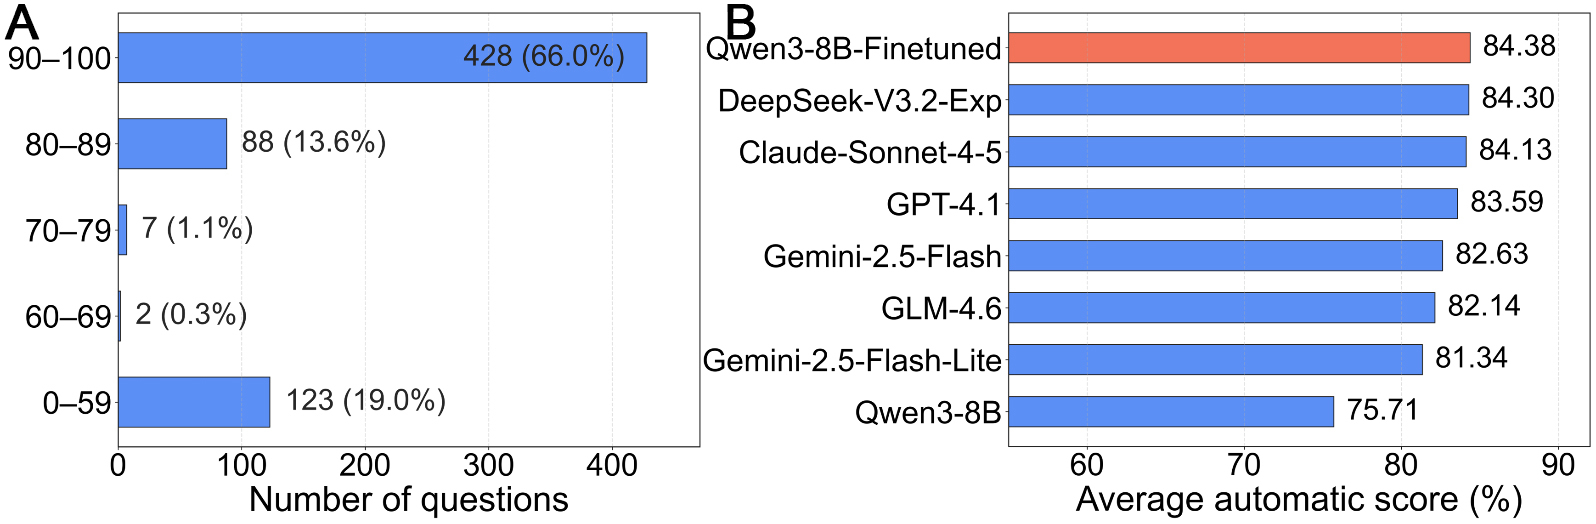
Figure 5. Comparative performance of evaluated models on HydroBench. (A) Score distribution of the FT-Only model (Qwen3-8B-fine-tuned) over all 648 test questions, showing that most answers are concentrated in the 90%-100% range; (B) Overall comparison of models using the harmonic mean (H-Score), highlighting the advantage of the fine-tuned model over both its base model and strong general-purpose LLMs. LLM: Large language model; FT: fine-tuned.

