
fig3
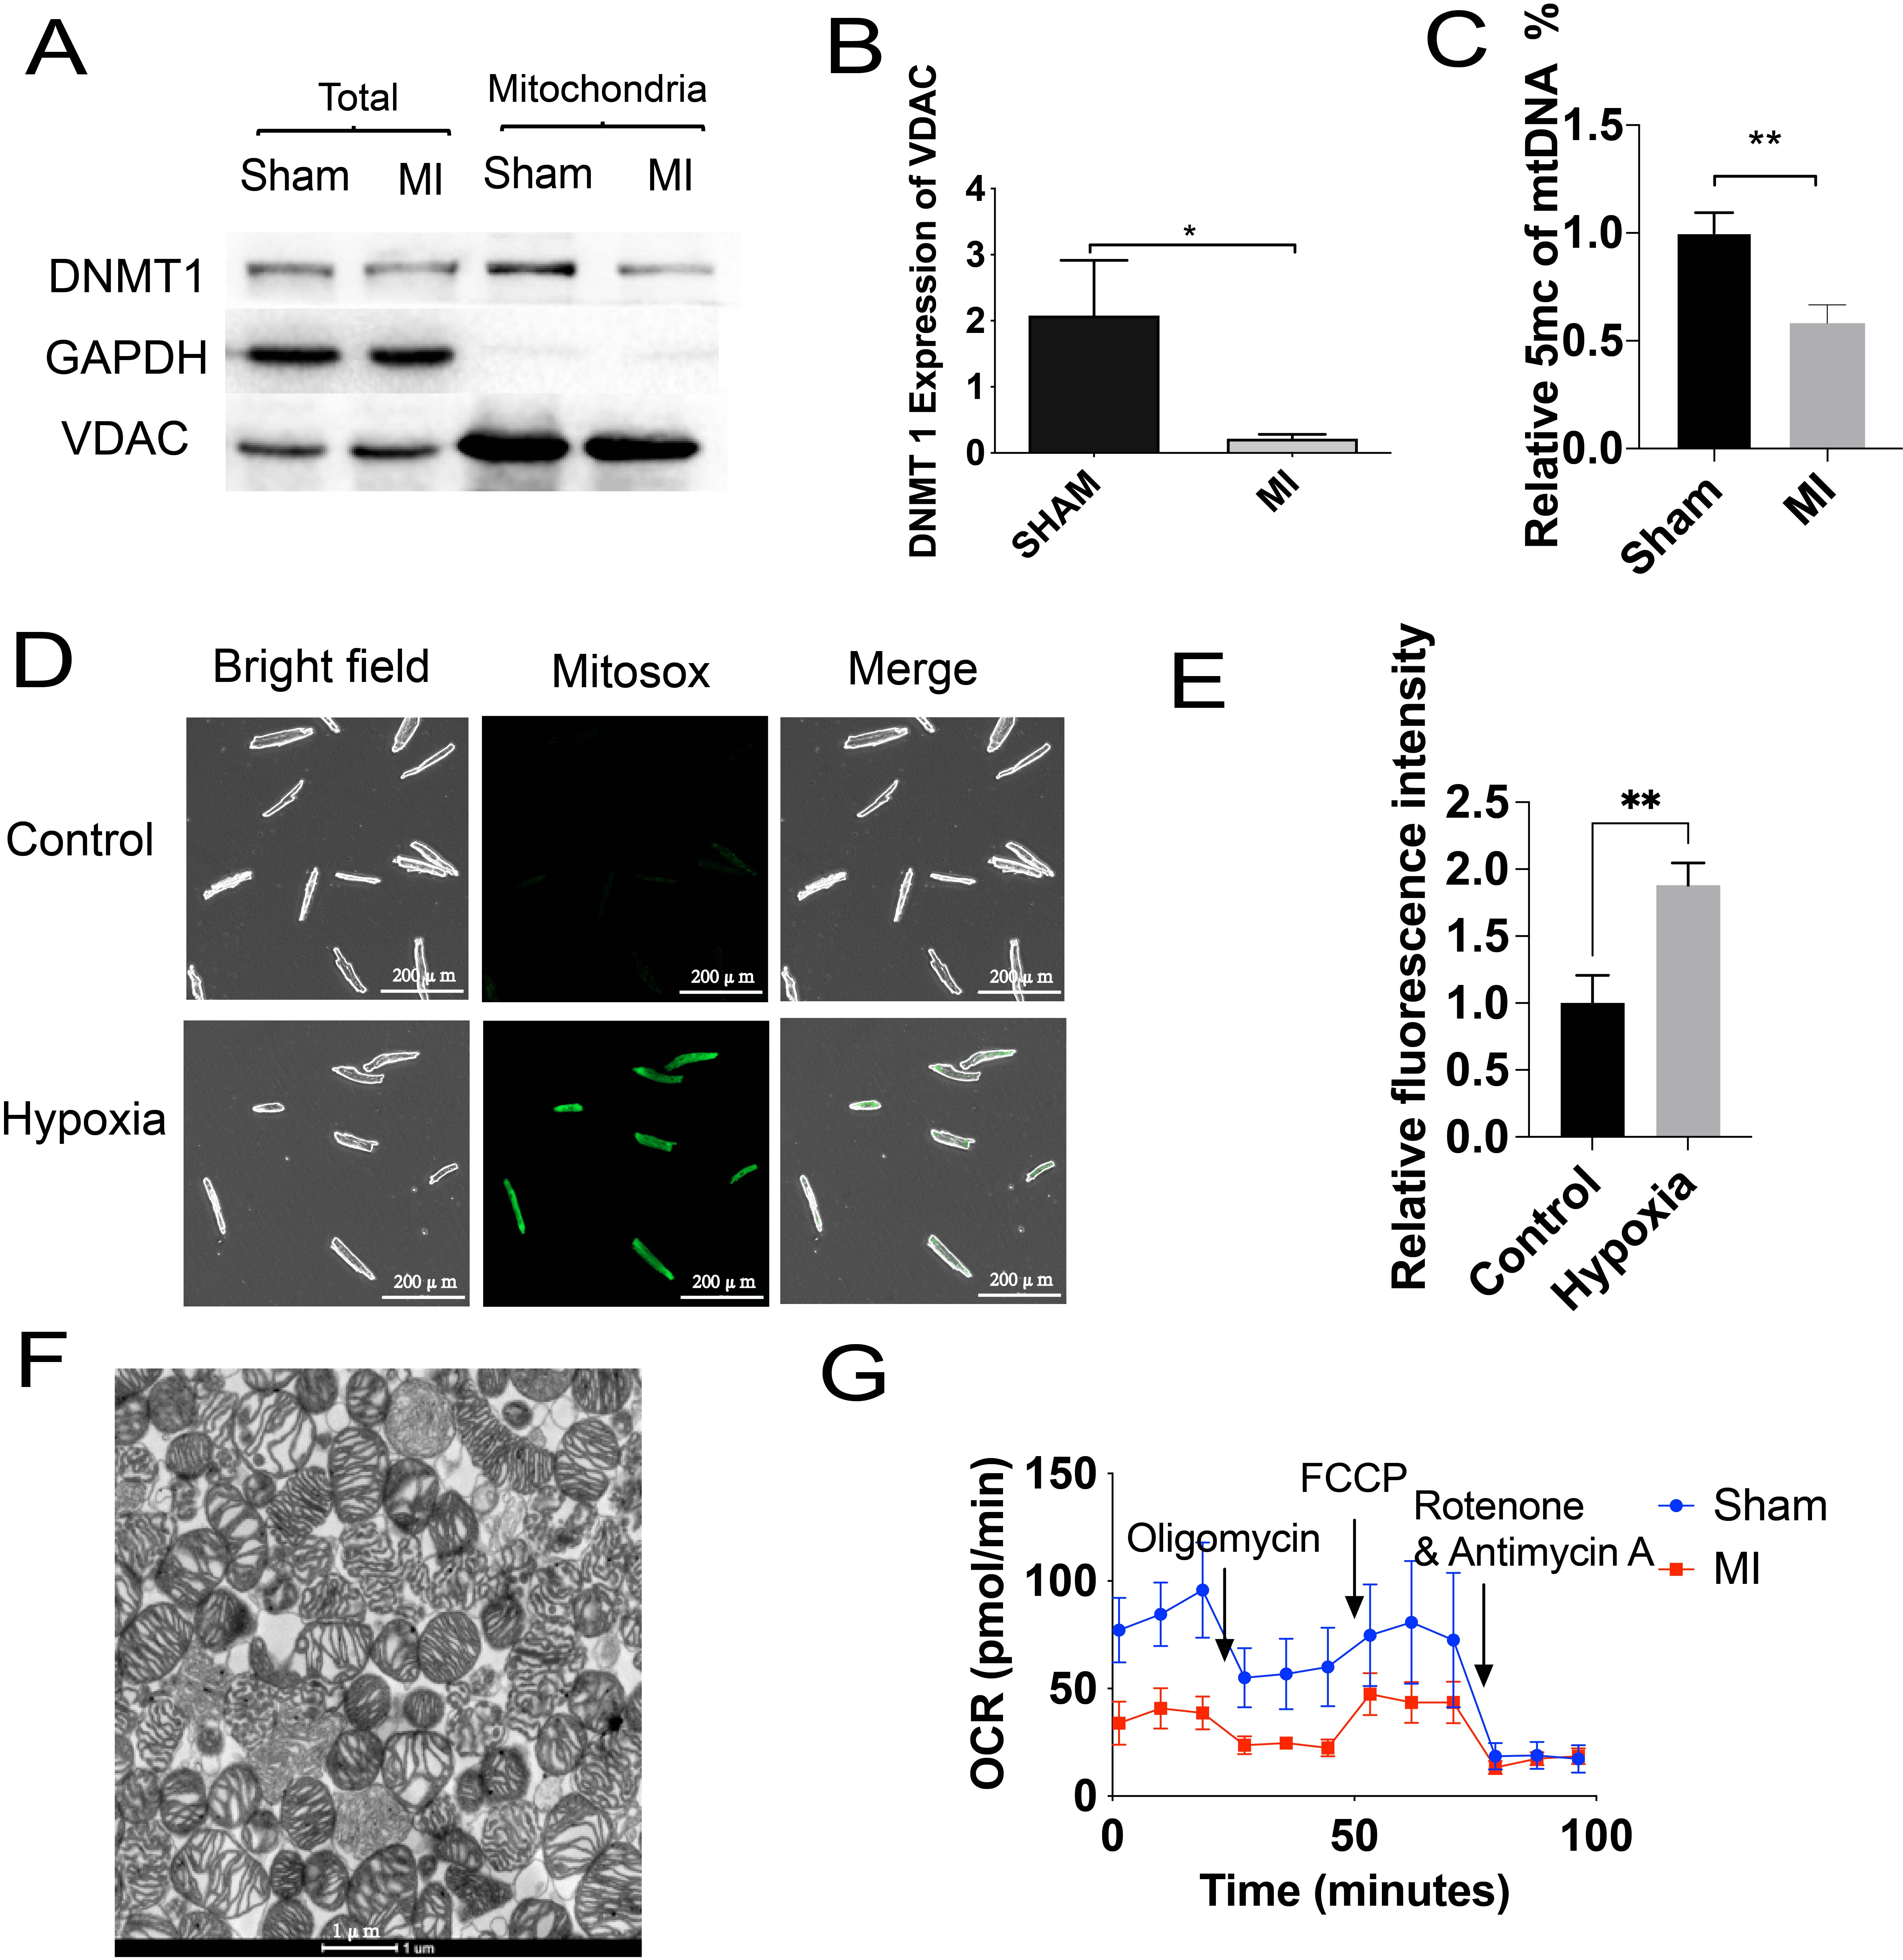
Figure 3. Methylation changes of mtDNA accompany mtROS accumulation in MI heart. (A) Western blotting analysis for DNMT1 levels in mitochondria post-MI for 4 weeks. (B) Quantitative analysis of mitochondrial DNMT1 expression in (A). (C) Detection of 5-mc levels in mtDNA in mitochondria post-MI for 4 weeks. (D and E) Mitochondrial ROS levels and statistical analysis in normal and hypoxic cardiomyocytes. (F) Representative TEM image of mitochondrial structure isolated from MI cardiomyocytes. Scale bar 1 μm. (G) Analysis of oxygen consumption rate (OCR) in mitochondria isolated from sham and MI hearts. All results are presented as mean ± SEM. Statistical significance for comparisons between two groups was determined by unpaired two-tailed Student’s t test. *P < 0.05, **P < 0.01.