


Functional classification of extrasystoles based on hemodynamic features and risk of arterial vascular complications
 0
0 Abstract
Aim: To develop a functional classification of extrasystoles (ES) based on cardiac biomechanics, arterial hemodynamics and kinetics, and the associated risk of arterial vascular events.
Materials and methods: This monocentric, prospective study included 634 patients with ≥ 700 ES per 24 h. The control group consisted of 106 patients with < 700 ES per 24 h. The main group was divided into two subgroups, A and B, according to the identified ES variant, categorized by the timing of ES ventricular systole within the cardiac cycle, independent of the ectopic focus location. Standard instrumental and laboratory assessments were performed. The prospective follow-up period was one year, with evaluations at 6 and 12 months. The composite endpoint was the occurrence of ischemic vascular events.
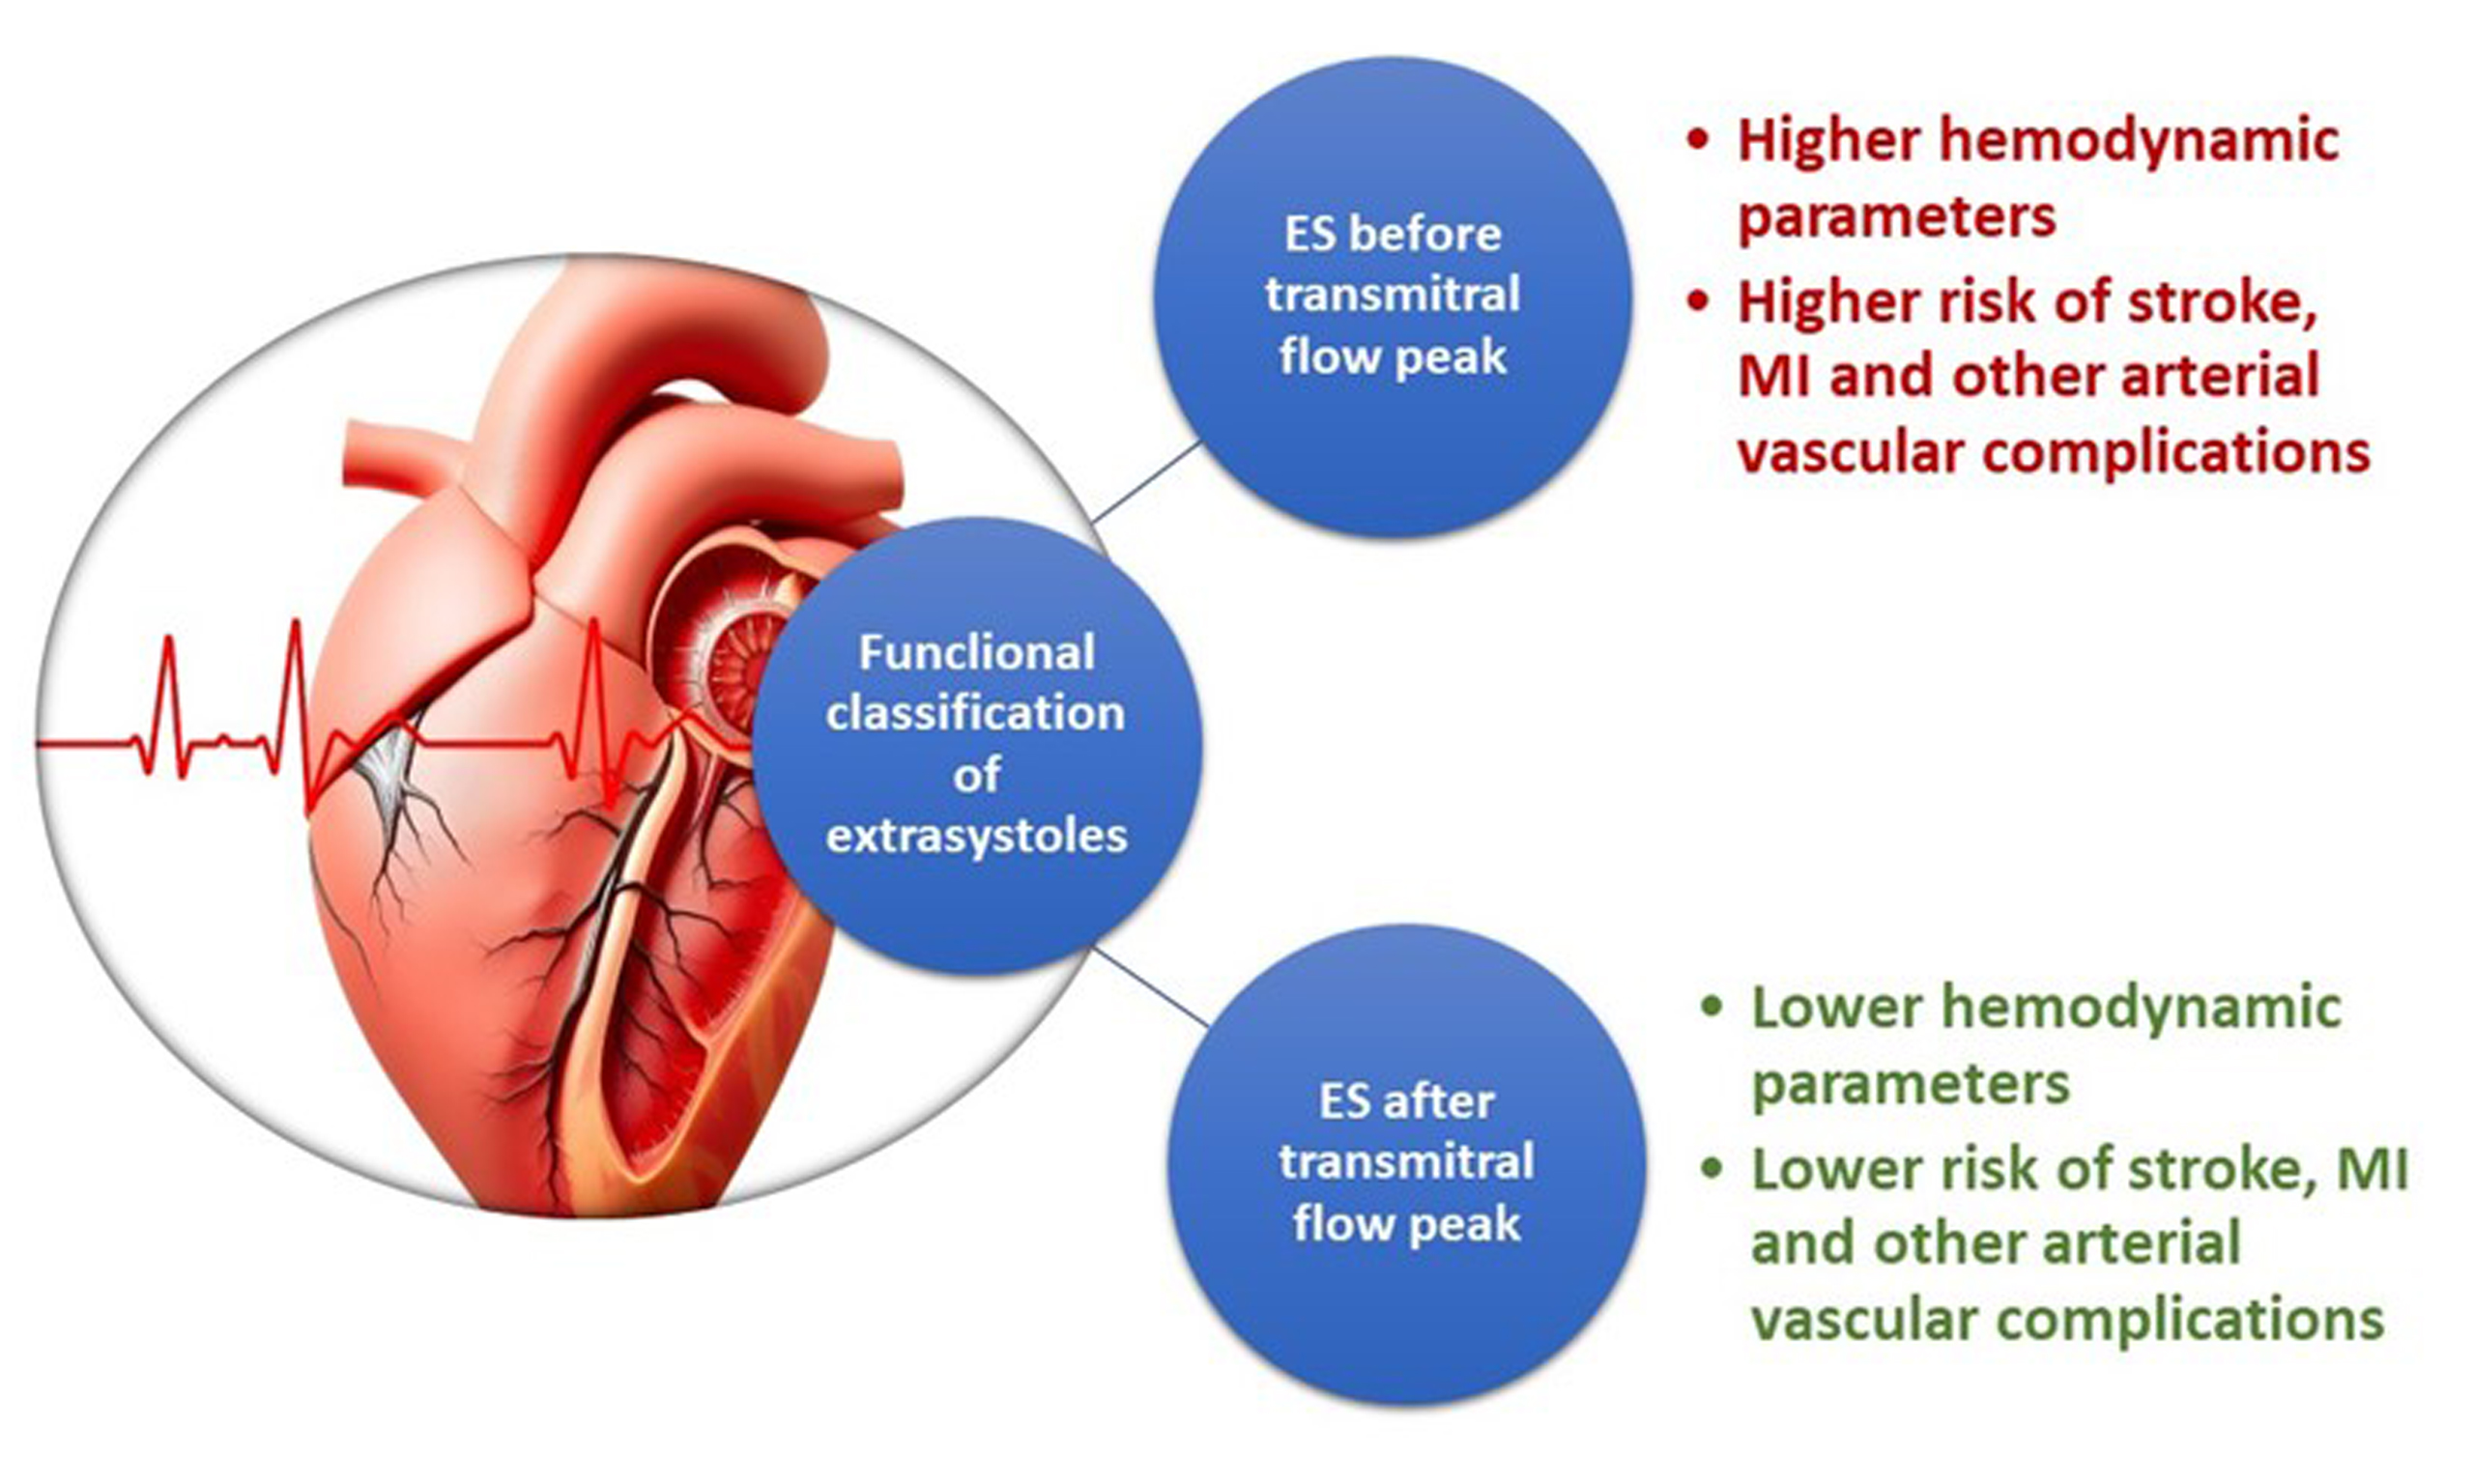
Results: Patients with ≥ 700 ES per 24 h had a significantly higher incidence of arterial vascular complications within 1 year, particularly those in subgroup A. The first postextrasystolic wave was characterized by an increase in hemodynamic parameters, especially in early ES occurring before the transmitral blood flow peak (E wave) on echocardiography.
Conclusions: Considering the impact on hemodynamics and the differences in ischemic vascular event rates (including cerebral ischemic events, myocardial infarction, and embolic events in other vascular territories), ES can reasonably be classified based on the timing of ventricular systole within the cardiac cycle: ES with ventricular systole occurring before the transmitral blood flow peak, and ES with ventricular systole occurring after the transmitral blood flow peak.
Keywords
INTRODUCTION
Extrasystoles (ES) is the most common form of arrhythmia, reported in up to 95% of individuals according to various studies[1-3]. The causes of this rhythm disturbance are diverse, encompassing both physiological and organic origins. The clinical significance of ES depends on its 24-h frequency, specific characteristics, clinical manifestations, and the presence of underlying structural heart disease[4-7].
Subsequent studies have explored the etiology, pathogenesis, and clinical manifestations of this arrhythmia. Sh. Kinoshita is particularly associated with describing the re-entry mechanism - a theory that remains highly relevant today. Several classifications (e.g., Lown, Ryan) were developed in the last century[8]. Current widely accepted classifications of ES primarily focus on electrocardiographic (ECG) patterns, determining the ectopic focus and the frequency of occurrences per hour[9-11]. However, these classifications do not account for the timing of ES in relation to the biomechanical phases of the cardiac cycle.
In clinical practice, cardiologists must not only establish the presence of ES but also determine its type, identify the underlying cause, and assess the necessity of intervention. Consequently, even rare or isolated ES events typically receive therapeutic attention, regardless of their timing within the cardiac cycle. Nevertheless, when evaluating the need for antiarrhythmic therapy and the risk of complications, the timing of extrasystolic ventricular contractions is often overlooked. Importantly, the term “early” ES currently refers specifically to the “R-on-T” phenomenon as detected on ECG, rather than to its placement within the heart’s biomechanical cycle.
Furthermore, assessments of cardiac biomechanics and arterial kinetics are not routinely performed in patients with ES. Non-invasive methods such as digital apexcardiography (ACG) and sphygmography (SG) are not included in the standard diagnostic workup for arrhythmias. Yet, clinical observations indicate that major kinetic parameters of the arteries undergo marked changes during rhythm disturbances, contributing to pathogenic mechanisms in patients with cardiovascular disease. Therefore, arterial and cardiac biomechanics should be considered when evaluating patients with arrhythmia.
Given that existing classifications of ES do not consider the timing of contractions within the cardiac cycle or their impact on arterial biomechanics, there is a need for a new functional framework. Therefore, the objective of this study is to develop a classification of ES based on cardiac biomechanics, arterial hemodynamics and kinetics, and the associated risk of vascular events.
MATERIALS AND METHODS
We conducted a monocentric, prospective study involving 634 patients with ≥700 ES per 24 h, without atrial fibrillation (AF). The control group consisted of 106 patients without AF who had < 700 ES per 24 h. The study was conducted at the Clinics of the Samara State Medical University. All participants (740 patients in total) were admitted for elective procedures to confirm the diagnosis of coronary heart disease, evaluate stable angina pectoris, and determine the necessity of surgical intervention for coronary atherosclerotic lesions, including percutaneous coronary intervention, stenting, or coronary artery bypass grafting. The study was conducted in accordance with the Declaration of Helsinki, and the protocol was approved by the Ethics Committee of the Samara State Medical University (Protocol No. 248, dated April 27, 2022; Chairperson: Prof. L.T. Volova). Written informed consent was obtained from all patients.
Inclusion criteria for the main group: male or female; ≥ 18 years; ≥ 700 ES per 24 h on 24 h ECG monitoring; absence of AF; signed informed consent.
Inclusion criteria for the control group: male or female; ≥ 18 years; < 700 ES per 24 h; absence of AF.
Exclusion criteria (for both groups): arterial hypertension with blood pressure > 160/100 mmHg;
Patients in the main group were further divided into two subgroups, A and B, based on the timing of ventricular systole in relation to transmitral blood flow, regardless of the ectopic focus location. Subgroup A (early variant) included 192 patients in whom ventricular systole occurred before the peak of transmitral blood flow (before peak E on Doppler echocardiography). Subgroup B (late variant) consisted of 442 patients in whom ventricular systole occurred after the transmitral peak E. The smaller size of subgroup A reflects the lower prevalence of the early ES variant. The transmitral E peak is the first peak of transmitral flow measured by pulsed-wave Doppler echocardiography in the apical 4-chamber view, corresponding to the rapid filling phase of the left ventricle.
Figure 1 illustrates the rationale for selecting 700 ES/24 h as the cutoff for dividing patients into groups. Receiver operating characteristic (ROC) curve analysis identified 700 ES/24 h as the optimal cutoff, with an area under the curve (AUC) of 0.83, providing the best balance between sensitivity and specificity.
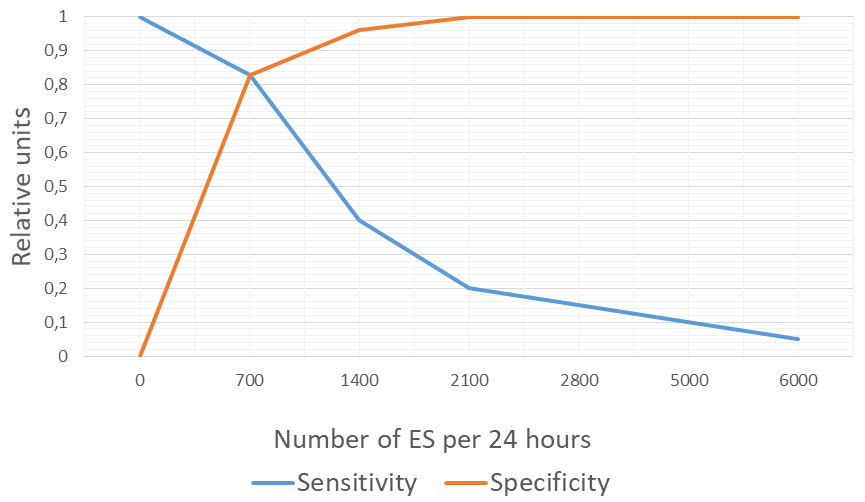
Figure 1. Sensitivity and specificity analysis for determining the threshold of 700 ES/24 h. ES: Extrasystoles.
The overall study design is presented in Figure 2.
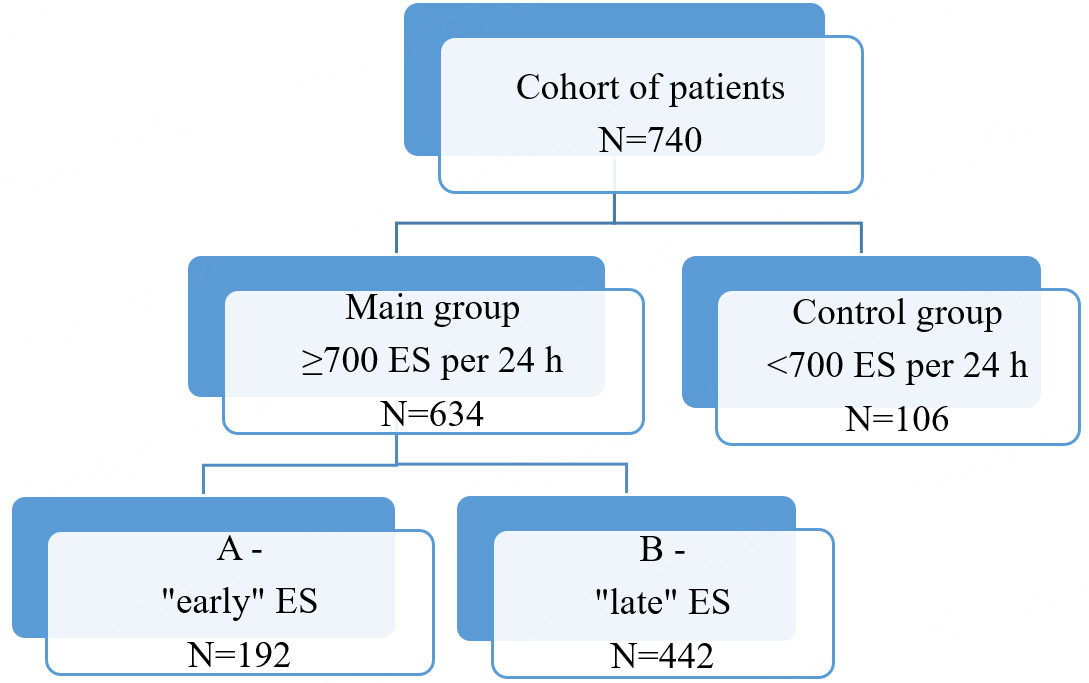
Figure 2. Study design scheme. ES: Extrasystoles.
All patients underwent mandatory laboratory tests, including complete blood count with leukocyte differential and platelet count, urinalysis, and biochemical blood tests (urea, creatinine and clearance, glucose, alanine transaminase (ALT), aspartate transaminase (AST), bilirubin, fibrinogen, prothrombin time, antithrombin III, activated partial thromboplastin time (APTT), creatine kinase-MB (MB-CK), international normalised ratio (INR), troponin T, myoglobin, and lipid profile: total cholesterol,
In the main group, both supraventricular and ventricular ES were detected in subgroups A and B. Most patients in both the main and control groups received β-blockers (bisoprolol 2.5-10 mg/day), mainly as part of complex therapy for coronary artery disease (98 patients in subgroup 1A, 228 in subgroup 1B, and 76 in the control group). Since β-blockers are the first-line treatment for ES (Lebedev DS, Mikhailov EN, 2021), antiarrhythmic drugs from other classes were prescribed less frequently, and only in cases of symptomatic ES (propafenone in 4 patients in subgroup A and 8 patients in subgroup B). No patients in this study underwent catheter ablation. To correct lipid profiles, all patients received statins (atorvastatin, rosuvastatin, or pitavastatin) or therapeutic doses of ethyl esters of omega-3 fatty acids starting at the outpatient stage. Under this therapy, lipidogram parameters were comparable between subgroups. Treatment was continued both during hospitalization and after discharge. Some patients in the main and control groups also received antiplatelet therapy (acetylsalicylic acid 70-100 mg/day) at the outpatient stage (101 patients in subgroup A, 269 in subgroup B, and 68 in the control group). Coronary angiography was performed in all patients; Percutaneous coronary intervention (PCI) with coronary stenting was performed in 36, 92, and 24 patients in subgroups A, B, and the control group, respectively.
By days 2-7 after myocardial revascularization, some patients with symptomatic ES reported improvement or resolution of subjective arrhythmia symptoms. In all cases, drug-eluting stents were used. After PCI and stenting, patients received dual or triple antithrombotic therapy in accordance with clinical guidelines. Bleeding risk was assessed using the PRECISE-DAPT score. For patients with low risk (score < 25), dual therapy (clopidogrel 75 mg/day plus acetylsalicylic acid 70-100 mg/day) was prescribed for 6 months
The prospective clinical phase involved one year of follow-up, with visits scheduled at 6 and 12 months. The composite endpoints included ischemic vascular complications within one year: cerebral ischemic events, myocardial infarction, and thrombosis or embolism in other vascular territories.
Data were analyzed using evidence-based medicine principles. Sample size was determined with free online power calculators (https://www.sealedenvelope.com/power/binary-superiority/), assuming a significance level (α) of 5%. Statistical methods were selected considering that with large sample sizes, the law of averages applies even when data distributions deviate from normality. Each parameter was tested for normality. If normally distributed, parametric methods were employed: quantitative variables were expressed as mean
For all statistical tests, significance was defined as P ≤ 0.05. Analyses were performed using MedCalc® Statistical Software version 20.118 (MedCalc Software Ltd, Ostend, Belgium; https://www.medcalc.org; 2022), GraphPad Prism version 10.1.0 (GraphPad Software, San Diego, California, USA; www.graphpad.com), and the R open-source environment (https://cran.rstudio.com/).
Potential sources of bias were considered, and preventive measures were applied. Measurement errors were minimized by using standardized, authorized equipment and quantitative data evaluation. Selection bias was avoided through strict inclusion and exclusion criteria. Observation and recall biases were minimized by relying on quantitative measurements. Confirmation bias was prevented by using objective data and prospective analysis.
The minimum required sample size was calculated as 512 participants using the above-mentioned online power calculators.
RESULTS
At baseline, the clinical and instrumental data showed no significant differences between the main subgroups and the control group. The primary distinction between subgroups A and B was related to the characteristics of the diagnosed ES - specifically, the timing of the onset of ventricular systole in relation to the cardiac cycle (i.e., whether it occurred before or after the peak of transmitral blood flow) [Table 1].
Clinical characteristics of the patients
| Parameter | Category | Group | Statistics | ||
| A N = 192 | B N = 442 | Control N = 106 | |||
| Age, years, Median (Q1, Q3)1 | 64 (59; 69) | 64 (58; 68) | 62 (55; 67) | P = 0.056 | |
| Body mass index, Median (Q1, Q3) 1 | 27 (24.0; 31.0) | 27 (23.0; 31.0) | 27 (23.0; 30.0) | P = 0.983 | |
| Gender, n (%)2 | Men | 98 (51.0) | 226 (51.1) | 54 (50.9) | P = 0.999 |
| Women | 94 (49.0) | 216 (48.9) | 52 (49.1) | ||
| Smoking, n (%)2 | 39 (20.3) | 97 (22.0) | 22 (20.8) | P = 0.887 | |
| Arterial hypertension, n (%)2 | None | 16 (8.3) | 44 (10.0) | 7 (6.6) | P = 0.852 |
| Grade 1 | 78 (40.6) | 174 (39.4) | 44 (41.5) | ||
| Grade 2 | 98 (51.0) | 224 (50.7) | 55 (51.9) | ||
| Type 2 diabetes mellitus, n (%)2 | 20 (10.4) | 48 (10.9) | 18 (17.0) | P = 0.175 | |
| Chronic heart failure, n (%)2 | NYHA I | 115 (59.9) | 238 (53.9) | 61 (57.6) | P = 0.347 |
| NYHA II | 77 (40.1) | 204 (46.2) | 45 (42.5) | P = 0.348 | |
| Stable angina pectoris, n (%)2 | None | 32 (16.7) | 68 (15.4) | 18 (17.0) | P = 0.978 |
| Class I | 95 (49.5) | 220 (49.8) | 54 (50.9) | ||
| Class II | 65 (33.9) | 154 (34.8) | 34 (32.1) | ||
| History of ischemic stroke or transient ischemic attack, n (%)2 | 13 (6.8) | 34 (7.7) | 7 (6.6) | P = 0.880 | |
| History of myocardial infarction, n (%)2 | 38 (19.8) | 87 (19.7) | 21 (19.8) | P = 0.954 | |
| History of arterial thrombosis or embolism of other arteries, n (%)2 | 1 (0.5) | 3 (0.7) | 1 (0.9) | P = 0.913 | |
| Impaired local contractility of the left ventricle, n (%) | 48 (25.0) | 131 (29.6) | 20 (18.9) | P = 0.063 | |
| Coronary angiography: any narrowing, n (%) | 160 (83.3) | 374 (84.6) | 88 (83.0) | P = 0.877 | |
| Carotid stenosis, hemodynamically insignificant, n (%) | 67 (34.9) | 156 (35.3) | 38 (35.9) | P = 0.986 | |
| Carotid atheroma with signs of instability (Doppler ultrasound), n (%) | 31 (16.2) | 69 (15.6) | 16 (15.1) | P = 0.970 | |
| Peripheral arterial atheromas, hemodynamically insignificant, n (%) | 21 (10.9) | 53 (12.0) | 13 (12.3) | P = 0.917 | |
However, a follow-up analysis of control endpoints after one year showed a statistically significant increase in arterial vascular events - including ischemic stroke (IS), transient ischemic attack (TIA), and thrombosis or embolism of peripheral arteries - among patients experiencing 700 or more ES per 24 h. This effect was particularly pronounced in subgroup A, in which ES occurred before the peak of transmitral blood flow [Table 2].
Arterial vascular complications within 1 year by group
| Complication | Group | P, Fisher’s exact test | |||
| A N = 192 | B N = 442 | Control N = 106 | |||
| Ischemic stroke or transient ischemic attack, n (%) | Yes | 18 (9.4) | 17 (3.9) | 1 (0.9) | 0.002 |
| No | 174 (90.6) | 425 (96.2) | 105 (99.1) | ||
| Myocardial infarction, n (%) | Yes | 11 (5.7) | 12 (2.7) | 2 (1.9) | 0.131 |
| No | 181 (94.3) | 430 (97.3) | 104 (98.1) | ||
| Peripheral arterial thrombosis or embolism, n (%) | Yes | 7 (3.7) | 1 (0.2) | 0 (0.0) | 0.001 |
| No | 185 (96.4) | 441 (99.8) | 106 (100.0) | ||
| All complications mentioned before, n (%) | Yes | 36 (18.8) | 30 (6.8) | 3 (2.8) | < 0.001 |
| No | 156 (81.3) | 412 (93.2) | 103 (97.2) | ||
In patients with ES occurring before the transmitral blood flow peak at rates of 700 or more per 24 h, the OR for arterial vascular complications was 7.923 (95%CI: 2.377, 26.406), z = 3.370, P < 0.001. Conversely, for ES occurring after the peak, the OR was 2.500 (95%CI: 0.748, 8.353), z = 1.489, P = 0.137. Overall, individuals with ES ≥ 700 per 24 h had an OR of 3.989 (95%CI: 1.231, 12.930), z = 2.306, P = 0.021 for developing any arterial vascular complication within one year. These findings indicate that the risk of arterial vascular complications is influenced not only by the quantity of ES exceeding 700 per 24 h but also by their timing within the cardiac cycle.
To better understand these results, we analyzed hemodynamic parameters for each ES type across subgroups and the control group. Primary parameters included linear blood flow velocity and volumetric blood flow in the common carotid and posterior tibial arteries, measured by Doppler ultrasound. For subgroups A and B, these parameters were calculated for regular, ES, and first postextrasystolic (1PES) cardiac cycles. Key hemodynamic parameters for each group are presented in Table 3.
Linear and volumetric blood flow in 1PES for subgroups A, B, and controls
| Parameter/Group | Artery | Group | Statistics | ||
| A N = 192 | B N = 442 | Control N = 106 | |||
| Linear blood flow velocity (cm/sec), Median (Q1; Q3)1 | Common carotid artery | 108.0 (82.8; 126.0) | 89.0 (75.0; 102.0) | 61.0 (52.3; 74.8) | H = 239.380, P < 0.001 |
| Posterior tibial artery | 63.0 (52.0; 70.3) | 54.0 (46.0; 63.0) | 39,5 (30.0; 48.8) | H = 187.833, P < 0.001 | |
| Volumetric blood flow (ml/min), Median (Q1; Q3)1 | Common carotid artery | 507.5 (489.0; 522.3) | 420.0 (408.3; 432.0) | 318.5 (306.3; 335.0) | H = 566.521, P < 0.001 |
| Posterior tibial artery | 45.0 (38.0; 52.0) | 37.0 (31.0; 42.0) | 29.0 (24.0; 34.0) | H = 239.191, P < 0.001 | |
In addition to the analyzed hemodynamic parameters, we calculated key data on cardiac biomechanics and arterial kinetics (common carotid artery and posterior tibial artery) using digital ACG and SG in patients with ES from subgroups A and B, as well as during regular heart contractions in the control group [Figure 3].
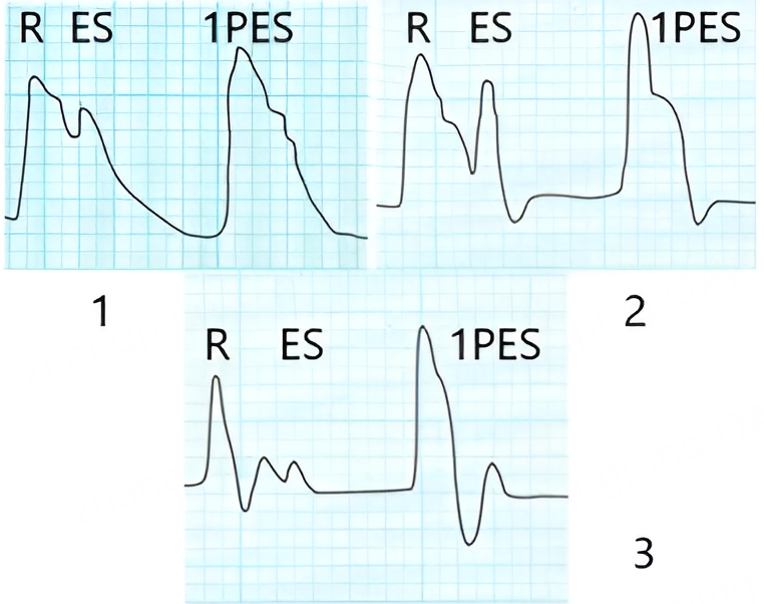
Figure 3. Apexcardiography (1) and sphygmography of the common carotid artery (2) and posterior tibial artery (3) in patients with ES. R - regular pulse wave; ES - extrasystole; 1PES - first postextrasystolic wave. 1PES: First postextrasystolic; ES: extrasystole.
For subgroups A and B, we calculated key biomechanical and kinetic parameters (velocity, acceleration, power, and work) for ES, regular, and 1PES pulse waves. Comparing the 1PES parameters in patients of subgroups A and B with those recorded during regular pulse waves in the control group revealed a clear trend: all kinetic parameters measured by ACG and SG - velocity, acceleration, power, and work - increased during 1PES. This effect was most pronounced in subgroup A, representing patients with “early” ES, where the ventricular systole of the ES occurs before the peak of transmitral blood flow. The most comprehensive parameter, work, is presented in Figure 4. Work was calculated automatically based on the physical formula A = P*t (where A = work, P = power, t = time). All analyzed parameters and detailed group data are provided in Supplementary Table 1
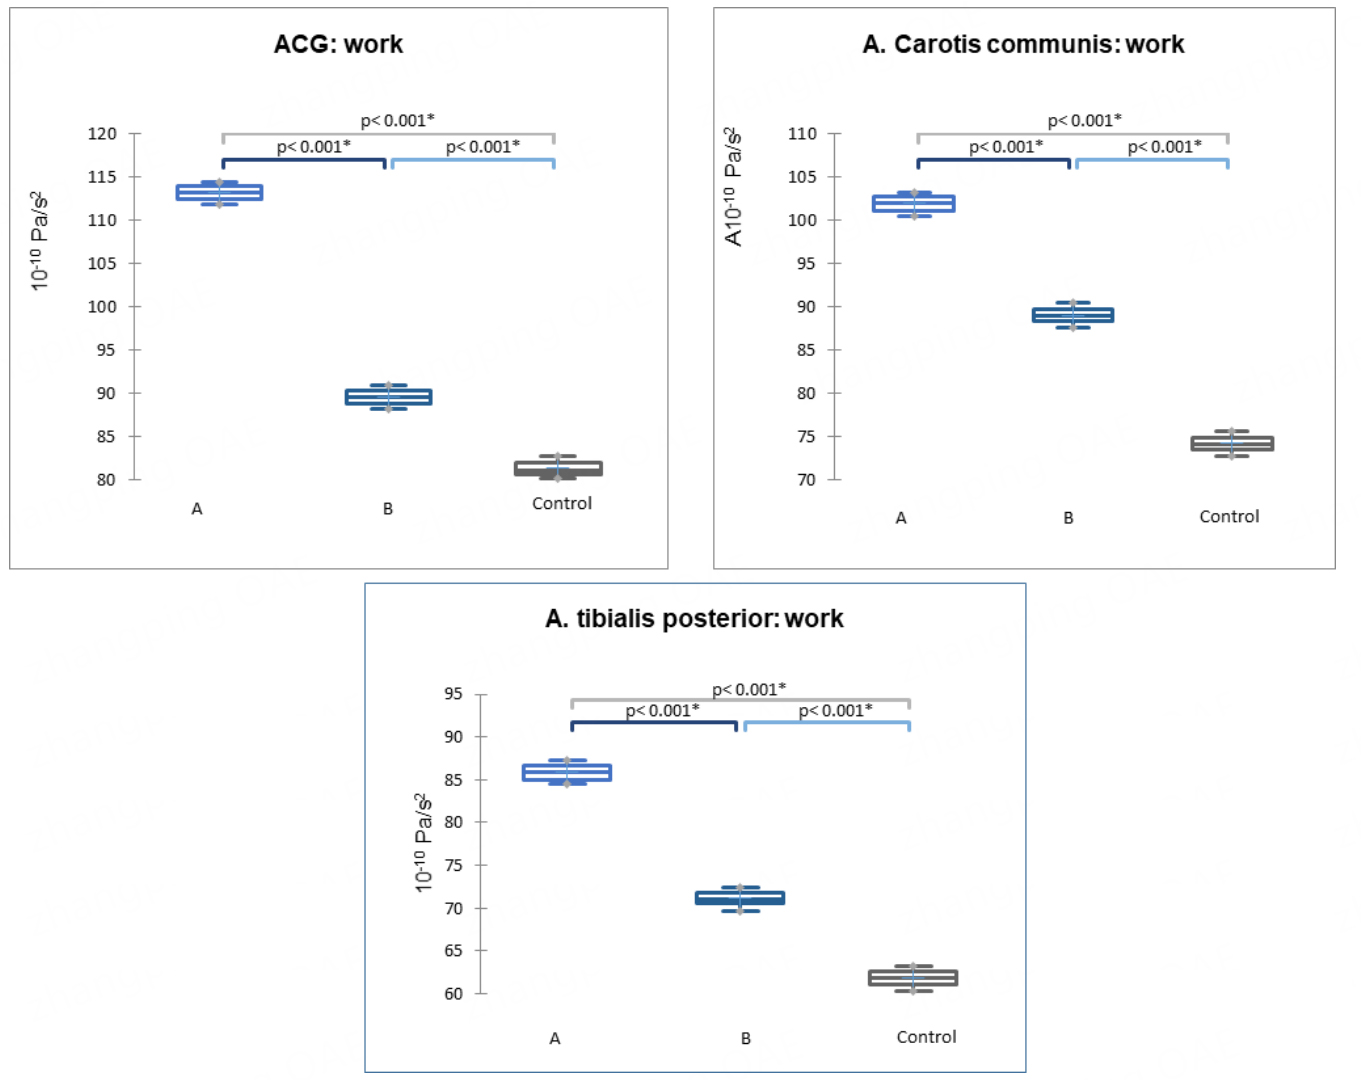
Figure 4. Work parameter based on digital ACG and SG data from the common carotid and posterior tibial arteries (P < 0.001) in subgroups A, B, and the control group. Data are presented as medians (horizontal line), means (cross), 1st and 3rd quartile boundaries (box edges), and minima and maxima (whisker ends). ACG: Apexcardiography; SG: sphygmography.
During 1PES, hemodynamic parameters notably increase, particularly during early type of the ES, prior to the peak of transmitral blood flow E observed on EchoCG within the cardiac cycle. This indicates that the timing of ventricular systole during ES is critical in modulating hemodynamic parameters associated with the subsequent 1PES.
The timing of ventricular systole in ES plays a decisive role in determining changes in cardiac hemodynamics, heart biomechanics, and arterial kinetics (velocity, acceleration, power, and work). Specifically, it affects the 1PES’s ability to restore adequate blood flow, thereby determining cardiac output, the characteristics of the 1PES contraction, and the magnitude of its hemodynamic effect.
Discussion
The study of intra-arterial hemodynamics and arterial kinetics is both scientifically and clinically important for tailoring management to individual patients with ES, particularly in effectively managing ES and preventing potential complications.
Research on ES has generally focused on several key areas: identifying the etiology and pathogenesis of various ES types and characterizing their features; classifying ES based on the location of the ectopic focus within the cardiac conduction system, fundamentally distinguishing between supraventricular and ventricular ES; investigating functional and structural causes; analyzing associated risk factors and their relative significance; examining ES in the context of diseases affecting other organs and systems (e.g., gastrointestinal diseases); and classifying ES according to their potential to trigger life-threatening arrhythmias. Current classification frameworks primarily rely on the ectopic focus location (supraventricular vs. ventricular), the regularity of ES occurrences, and their potential danger in provoking fatal arrhythmias.
In our study, all patients underwent echocardiography, Doppler ultrasound of the common carotid and posterior tibial arteries, as well as digital ACG and SG. Typically, during instrumental examination, the ultrasound specialist records hemodynamic parameters based on the regular pulse wave, while measurements taken during ES are excluded from the final report.
Analysis of hemodynamic parameters - including linear blood flow velocity and volumetric blood flow in the common carotid and posterior tibial arteries - revealed an increase in these parameters during the 1PES contraction. This increase was most pronounced during “early” ES, which occurs before the transmitral blood flow peak in the cardiac cycle, regardless of ectopic location.
We recorded and analyzed parameters such as velocity, acceleration, power, and work derived from digital ACG and SG for patients in subgroups A, B, and the control group. Digital SG provides integral curves representing the mechanical displacement of a section of the arterial wall beneath the sensor. Since the first derivative of displacement represents the rate of change (velocity) and the second derivative represents acceleration, we used these derivatives to quantify arterial wall motion. These values further enabled us to compute power and work associated with wall movement. We have previously applied these methods to evaluate cardiac biomechanics and arterial kinetics[12,13].
Our analysis revealed a significant increase in velocity, acceleration, power, and work - key parameters of cardiac biomechanics and arterial kinetics - in subgroup A patients during the 1PES compared with subgroup B and the control group. Subgroups A and B were defined by the timing of ventricular systole in ES relative to the transmitral flow peak: either before (“early”) or after (“late”). The earlier the ventricular systole occurred, the greater the observed increase in velocity, acceleration, power, and work during the 1PES wave.
The occurrence and timing of ventricular systole in ES affect left ventricular stroke volume, the characteristics of the 1PES, and the contribution of arterial vessels to the transmission of stroke volume to the periphery. Digital ACG and SG provide valuable information in conjunction with other methods, enabling assessment of left ventricular mechanical activity and analysis of arterial wall parameters across different cardiovascular phases, particularly when blood flow is discrete.
We also determined that the risk of arterial events (such as cerebral ischemia, myocardial infarction, and thrombosis or embolism in other vascular territories) is 3.989 times higher in patients with ≥ 700 ES per 24 h compared to those with fewer than 700, assuming other risk factors are equal. This risk is particularly elevated in patients with “early” ES. Based on predictors of complication risk in ES patients, we developed a predictive model for ischemic vascular events across arterial territories, named “Ex-Prognosis”[14]. Possible mechanisms include propagation of the 1PES pulse wave, which elevates key hemodynamic parameters, potentially causing mechanical injury to unstable atherosclerotic plaques and resulting in atherothrombosis with subsequent arterial embolism. Patients with multifocal atherosclerosis are particularly vulnerable, as even a single 1PES pulse wave with such characteristics may trigger cardiovascular complications.
Based on observed differences in hemodynamics, cardiac biomechanics, arterial kinetics, and complication risks, we propose a functional classification of ES, independent of the electrical ectopic focus. This classification is primarily based on the timing of ventricular systole within the biomechanical cardiac cycle:
(1) Early ES - ventricular systole occurs before the peak of transmitral blood flow.
(2) Late ES - ventricular systole occurs after the peak of transmitral blood flow.
This classification reflects the differing contributions of each ES type. The timing of ventricular systole in the cardiac cycle is crucial for hemodynamic changes and for the 1PES contraction’s ability to restore adequate blood flow.
Implementing this functional classification in clinical practice is both relevant and justified, complementing existing classifications. It is physiological, intuitive, and clinically informative. Identifying the ES type can guide management strategies, optimize pharmacological interventions for rhythm disturbances, and influence the prognosis of thrombotic and embolic complications. Both the quality of ES (early vs. late ventricular systole) and the frequency of occurrences should be considered, as the likelihood of complications increases notably when ES frequency exceeds 700 per 24 h.
Limitations of the study
This was a prospective, single-center study conducted on a cohort of patients admitted for elective procedures aimed at confirming the diagnosis of coronary heart disease, clarifying the presence of stable angina pectoris, and evaluating the necessity of surgical intervention for atherosclerotic coronary lesions (including percutaneous coronary intervention, stenting, or coronary artery bypass grafting). The findings may be generalizable to patients with frequent ES in other centers. The methods described in the research are standard and reproducible, and the proposed classification can be applied to individual clinical cases. We believe that the next step in this line of research is to investigate whether oral anticoagulants can be administered to patients with frequent ES at the same dosages used for atrial fibrillation, with the goal of preventing arterial thrombotic and thromboembolic complications.
CONCLUSIONS
Given the impact on hemodynamics and the differences in the occurrence of ischemic arterial events (such as cerebral ischemic events, myocardial infarction, and thrombotic or embolic events in other vascular territories), it is reasonable to further classify ES based on the timing of ventricular contractions within the cardiac cycle.
This classification includes:
(1) Early ES: ventricular systole occurs before the peak of transmitral blood flow in the cardiac cycle.
(2) Late ES: ventricular systole occurs after the peak of transmitral blood flow in the cardiac cycle.
The highest risk of ischemic vascular events in various arterial regions is associated with early ES, in which ventricular contractions occur before the peak of transmitral blood flow (the E wave on echocardiography). This risk becomes clinically significant when ES frequency reaches 700 or more episodes per 24 h, regardless of the ectopic origin.
DECLARATIONS
Authors’ contributions
Conception, study design, data collection, data interpretation, statistical analysis, and manuscript drafting: Germanova OA
Critical revision of the manuscript: Reshetnikova YB, Ermolayeva KV, Galati G
Availability of data and materials
All data supporting this manuscript are stored at the International Centre for Education and Research in Cardiovascular Pathology and Cardiovisualization, Samara State Medical University. Further information about the projects is available at the official website: https://samsmu.ru/centers/cardiovascular/.
Financial support and sponsorship
None.
Conflicts of interest
All authors declared that there are no conflicts of interest.
Ethical approval and consent to participate
The research was conducted in accordance with the Declaration of Helsinki. The protocol was approved by the Ethics Committee of the Samara State Medical University (Protocol No. 248, dated April 27, 2022; Chairperson: Prof. Larisa Teodorovna Volova). Written informed consent was obtained from all patients prior to participation.
Consent for publication
Not applicable.
Copyright
© The Author(s) 2025.
Supplementary Materials
REFERENCES
1. Timmis A, Townsend N, Gale CP, et al; European Society of Cardiology. European Society of Cardiology: cardiovascular disease statistics 2019. Eur Heart J. 2020;41:12-85.
2. Hoogendijk MG, Géczy T, Yap SC, Szili-Torok T. Pathophysiological Mechanisms of Premature Ventricular Complexes. Front Physiol. 2020;11:406.
3. Luebbert J, Auberson D, Marchlinski F. Premature Ventricular Complexes in Apparently Normal Hearts. Card Electrophysiol Clin. 2016;8:503-14.
4. Katritsis DG, Boriani G, Cosio FG, et al. European Heart Rhythm Association (EHRA) consensus document on the management of supraventricular arrhythmias, endorsed by Heart Rhythm Society (HRS), Asia-Pacific Heart Rhythm Society (APHRS), and Sociedad Latinoamericana de Estimulación Cardiaca y Electrofisiologia (SOLAECE). Eur Heart J. 2018;39:1442-5.
5. Kerola T, Dewland TA, Vittinghoff E, Heckbert SR, Stein PK, Marcus GM. Modifiable predictors of ventricular ectopy in the community. J Am Heart Assoc. 2018;7:e010078.
6. von Rotz M, Aeschbacher S, Bossard M, et al. Risk factors for premature ventricular contractions in young and healthy adults. Heart. 2017;103:702-7.
7. Slaven S, Garg L, Sabzwari R, et al. Burden of Premature Ventricular Complexes and Risk of Cardiomyopathy: A Cross-Sectional Study. JACC Clin Electrophysiol. 2025;11:894-903.
9. Shaposhnik II, Lebedev EV. Extrasystole: algorythm of diagnostics and treatment in general medical practice. Therapy. 2017:8:26-34. Available from: https://journals.eco-vector.com/2412-4036/article/view/279207 [Last accessed on 17 Sep 2025].
10. Sattar Y, Hashmi MF. Ventricular premature complexes. In: StatPearls [Internet]. Treasure Island (FL): StatPearls Publishing; 2025.
11. Latchamsetty R, Bogun F. Frequent premature ventricular complexes are benign!? Europace. 2023;25:251-2.
12. Germanova O, Shchukin Y, Germanov V, Galati G, Germanov A. Extrasystolic arrhythmia: is it an additional risk factor of atherosclerosis? Minerva Cardiol Angiol. 2022;70:32-9.
13. Galati G, Germanova O, Iozzo RV, et al. Hemodynamic arterial changes in heart failure: a proposed new paradigm of “heart and vessels failure”. Minerva Cardiol Angiol. 2022;70:310-20.
Cite This Article
How to Cite
Download Citation
Export Citation File:
Type of Import
Tips on Downloading Citation
Citation Manager File Format
Type of Import
Direct Import: When the Direct Import option is selected (the default state), a dialogue box will give you the option to Save or Open the downloaded citation data. Choosing Open will either launch your citation manager or give you a choice of applications with which to use the metadata. The Save option saves the file locally for later use.
Indirect Import: When the Indirect Import option is selected, the metadata is displayed and may be copied and pasted as needed.
About This Article
Special Issue
Copyright

Data & Comments
Data
0


Comments
Comments must be written in English. Spam, offensive content, impersonation, and private information will not be permitted. If any comment is reported and identified as inappropriate content by OAE staff, the comment will be removed without notice. If you have any queries or need any help, please contact us at [email protected].