


fig6
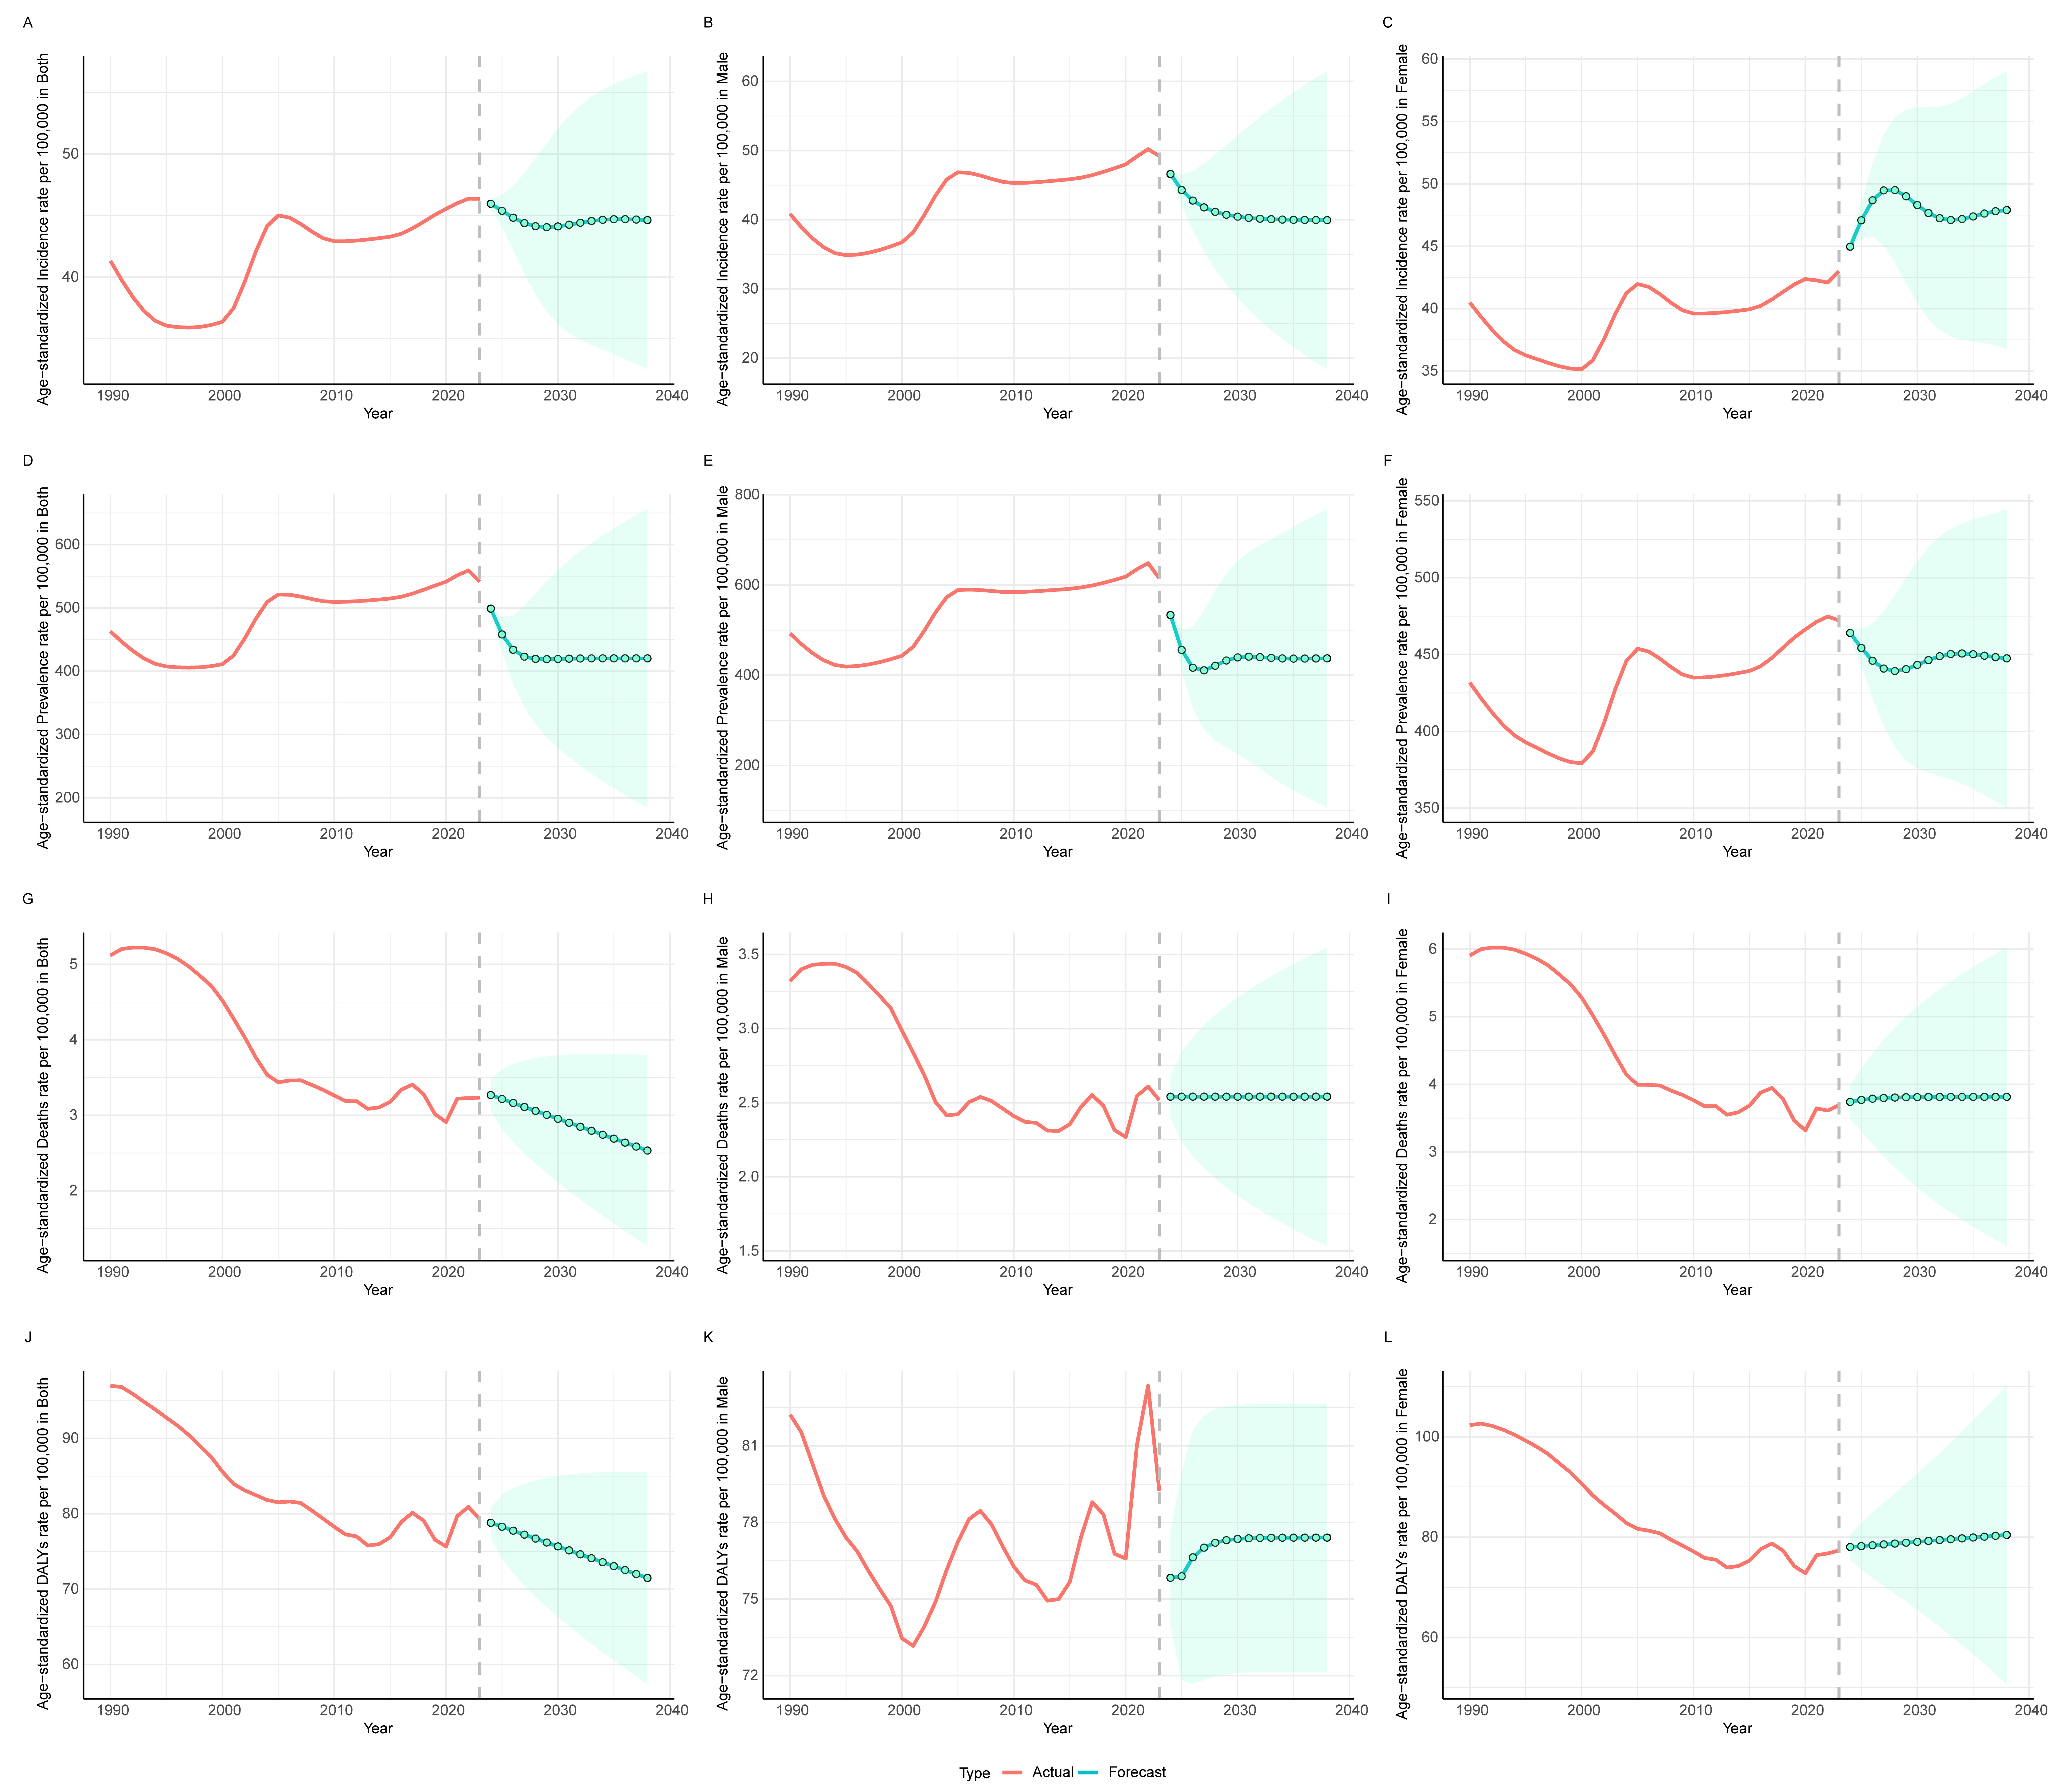
Figure 6. ARIMA forecasts of disease burden trends among males and females in China from 2024 to 2038. Panels (A-C) show the projected incidence rates for both sexes (A), males (B), and females (C); Panels (D-F) present the projected prevalence rates for both sexes (D), males (E), and females (F); Panels (G-I) depict the projected mortality rates for both sexes (G), males (H), and females (I); and Panels (J-L) illustrate the projected DALYs for both sexes (J), males (K), and females (L) over the 15-year period. The red solid line represents the trend of observed values from 1990 to 2023, the green dots indicate the projected values over the subsequent 15 years, and the green shaded area denotes the 95% confidence interval of the forecasts. ARIMA: Autoregressive integrated moving average; DALYs: disability-adjusted life years.


