
fig6
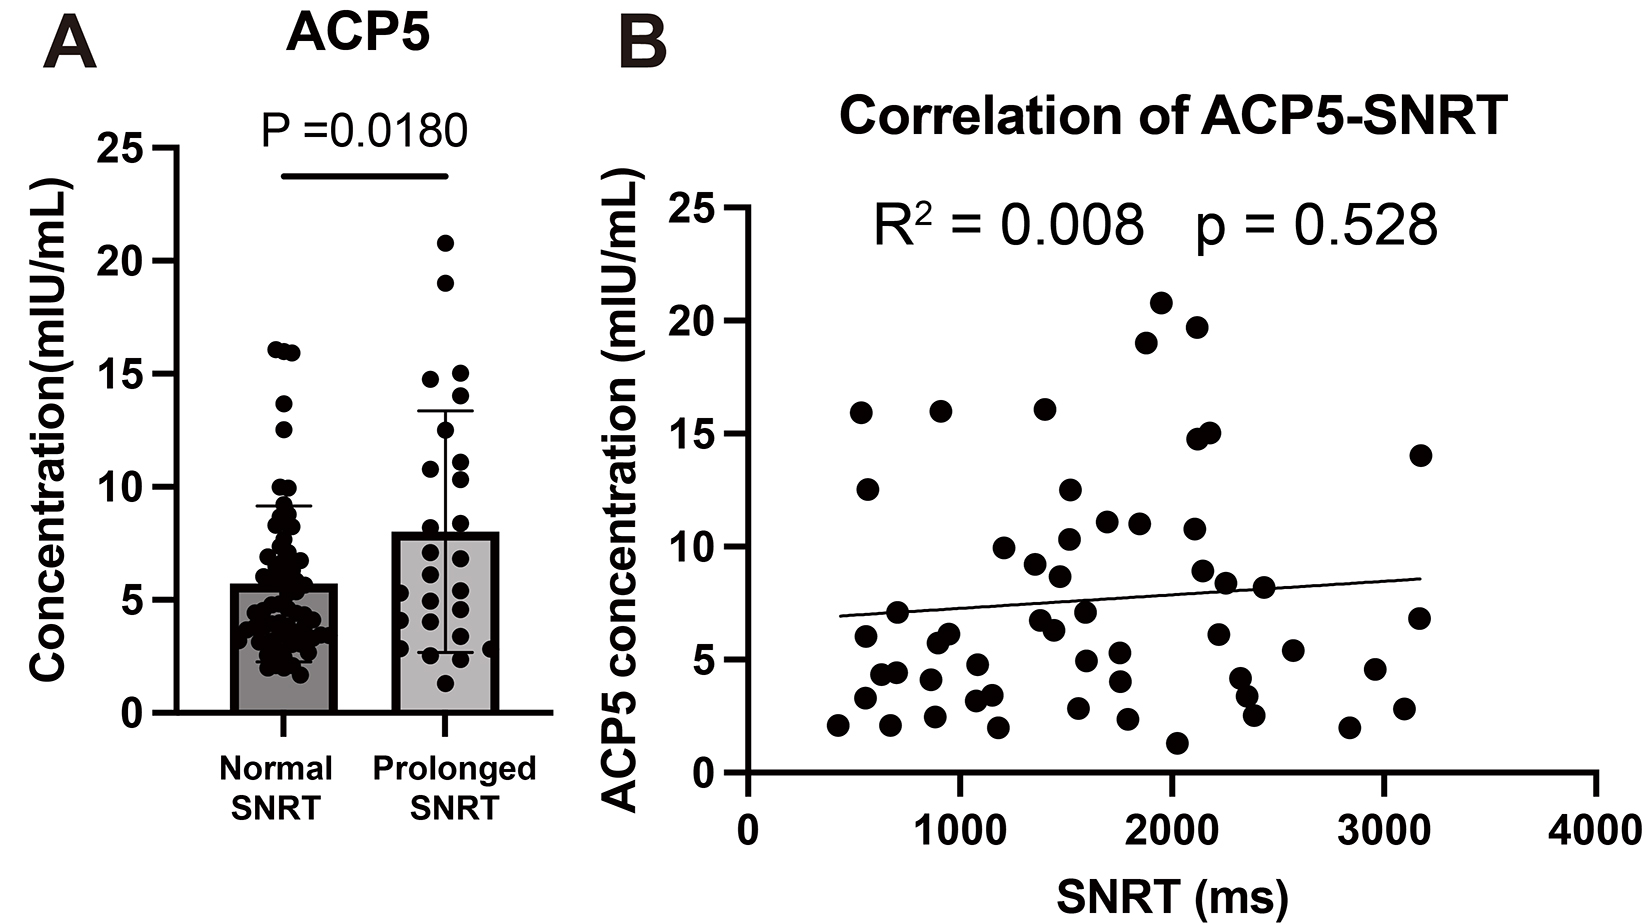
Figure 6. ELISA assessment of plasma ACP5 in the matched cohort. (A) Plasma levels of ACP5 were compared between the normal-SNRT and prolonged-SNRT groups. Data are presented as mean ± SD. Statistical significance was assessed using an unpaired two-tailed Student’s t-test. (B) Correlation between plasma ACP5 concentration and SNRT duration in the matched cohort. The association was evaluated using Pearson correlation analysis. ACP5, acid phosphatase 5.