


fig5
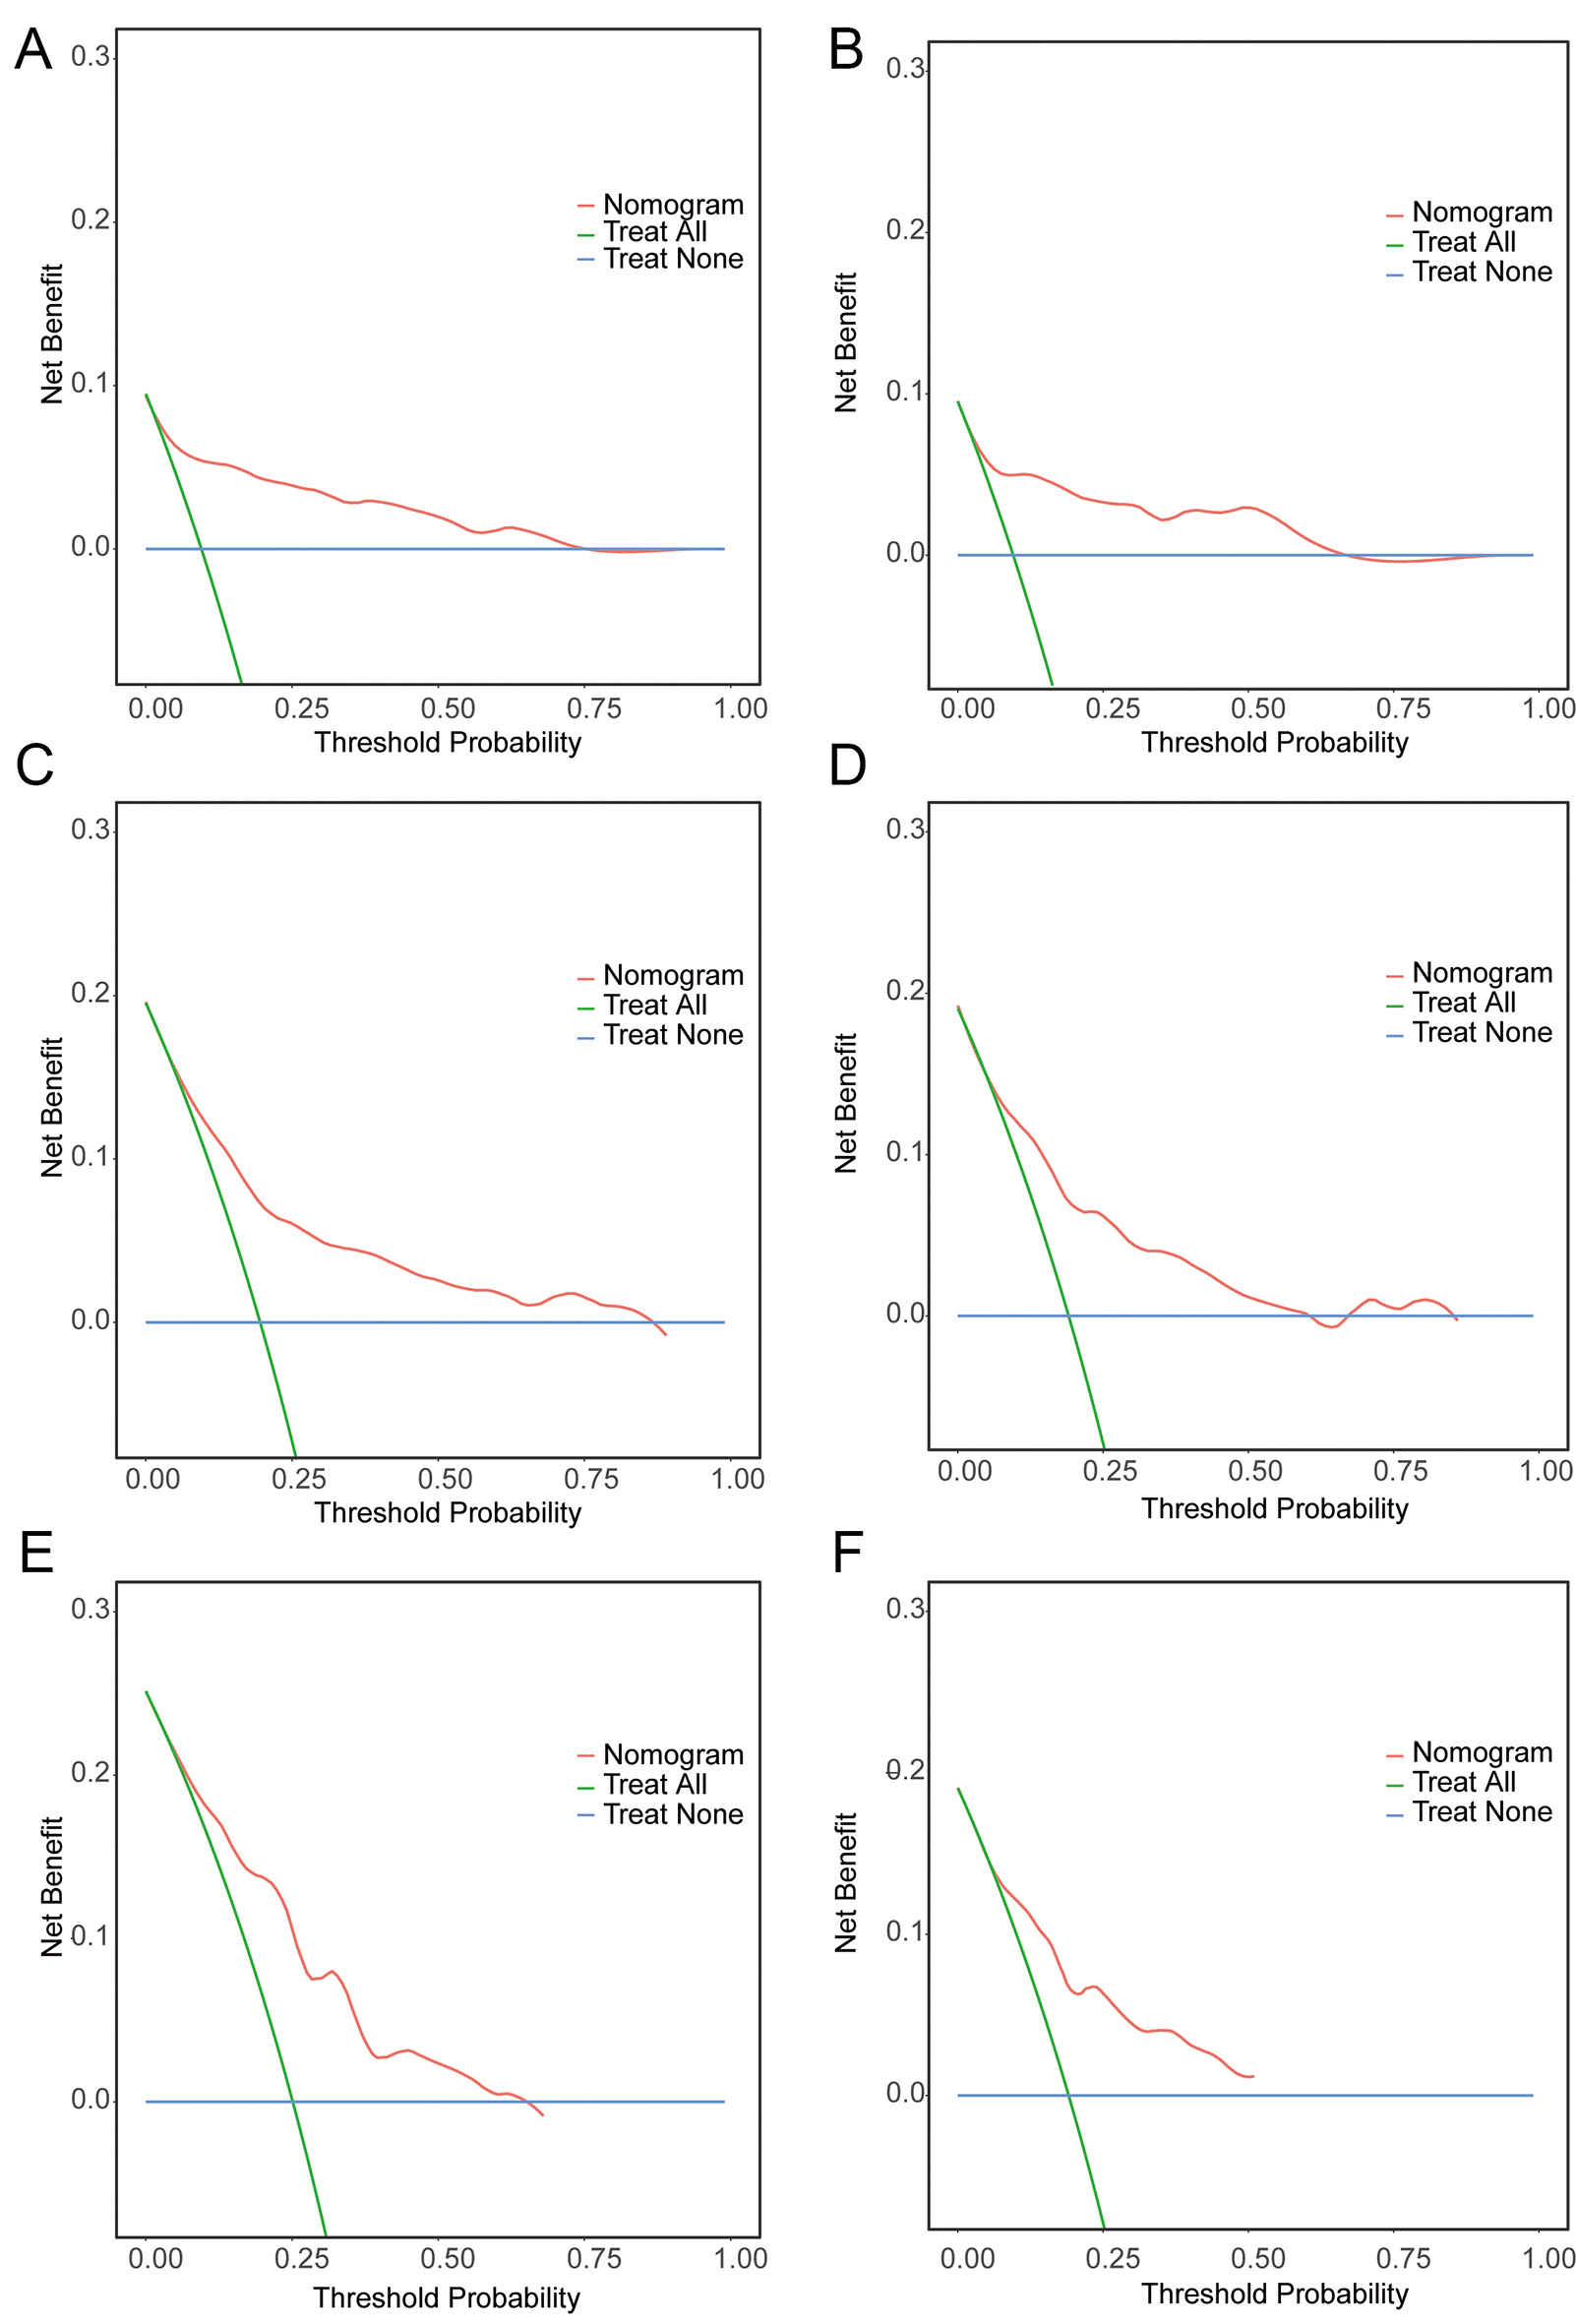
Figure 5. DCA curves show the net benefit, represented by a backslash with a negative slope, in the training (A-C) and validation (D-F) cohorts.
Figure 5. DCA curves show the net benefit, represented by a backslash with a negative slope, in the training (A-C) and validation (D-F) cohorts.

All published articles are preserved here permanently:
https://www.portico.org/publishers/oae/

