


fig4
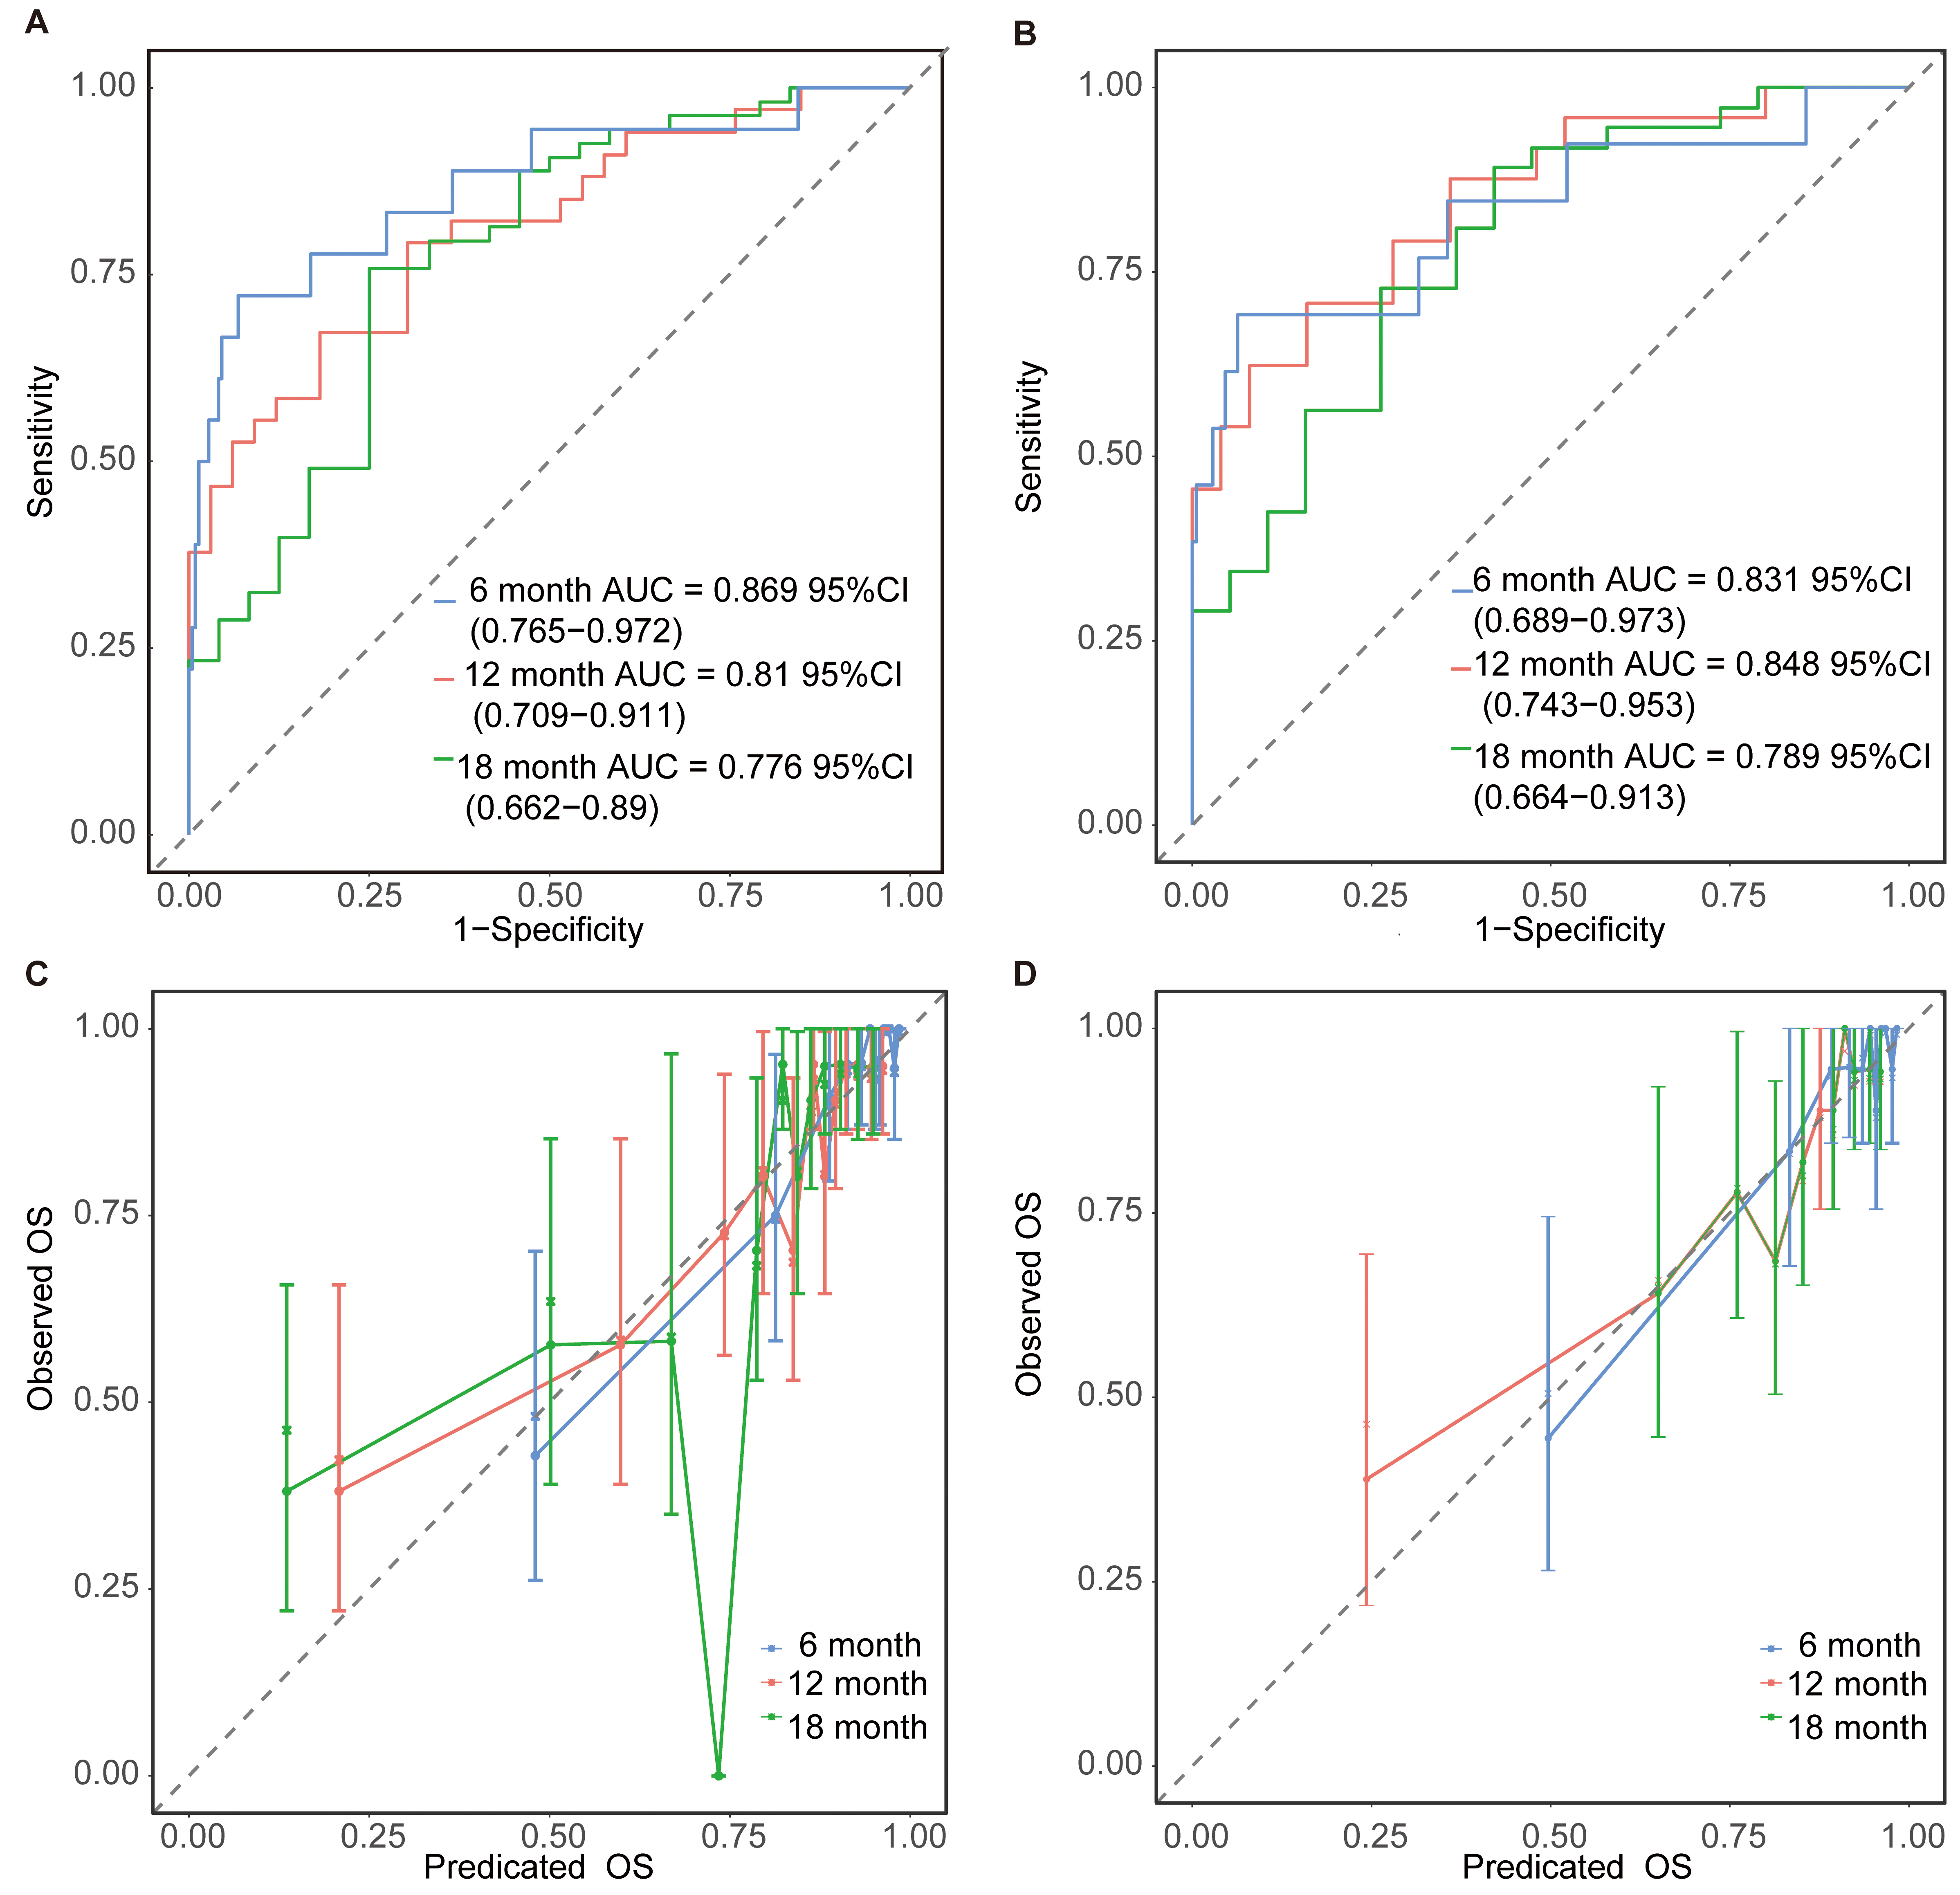
Figure 4. ROC curves of the nomogram for predicting 6-, 12-, and 18-month recurrence in the training cohort (A) and validation cohort (B). Calibration plots of the nomogram for predicting 6-, 12-, and 18-month recurrence in the training cohort (C) and validation cohort (D).


