


fig2
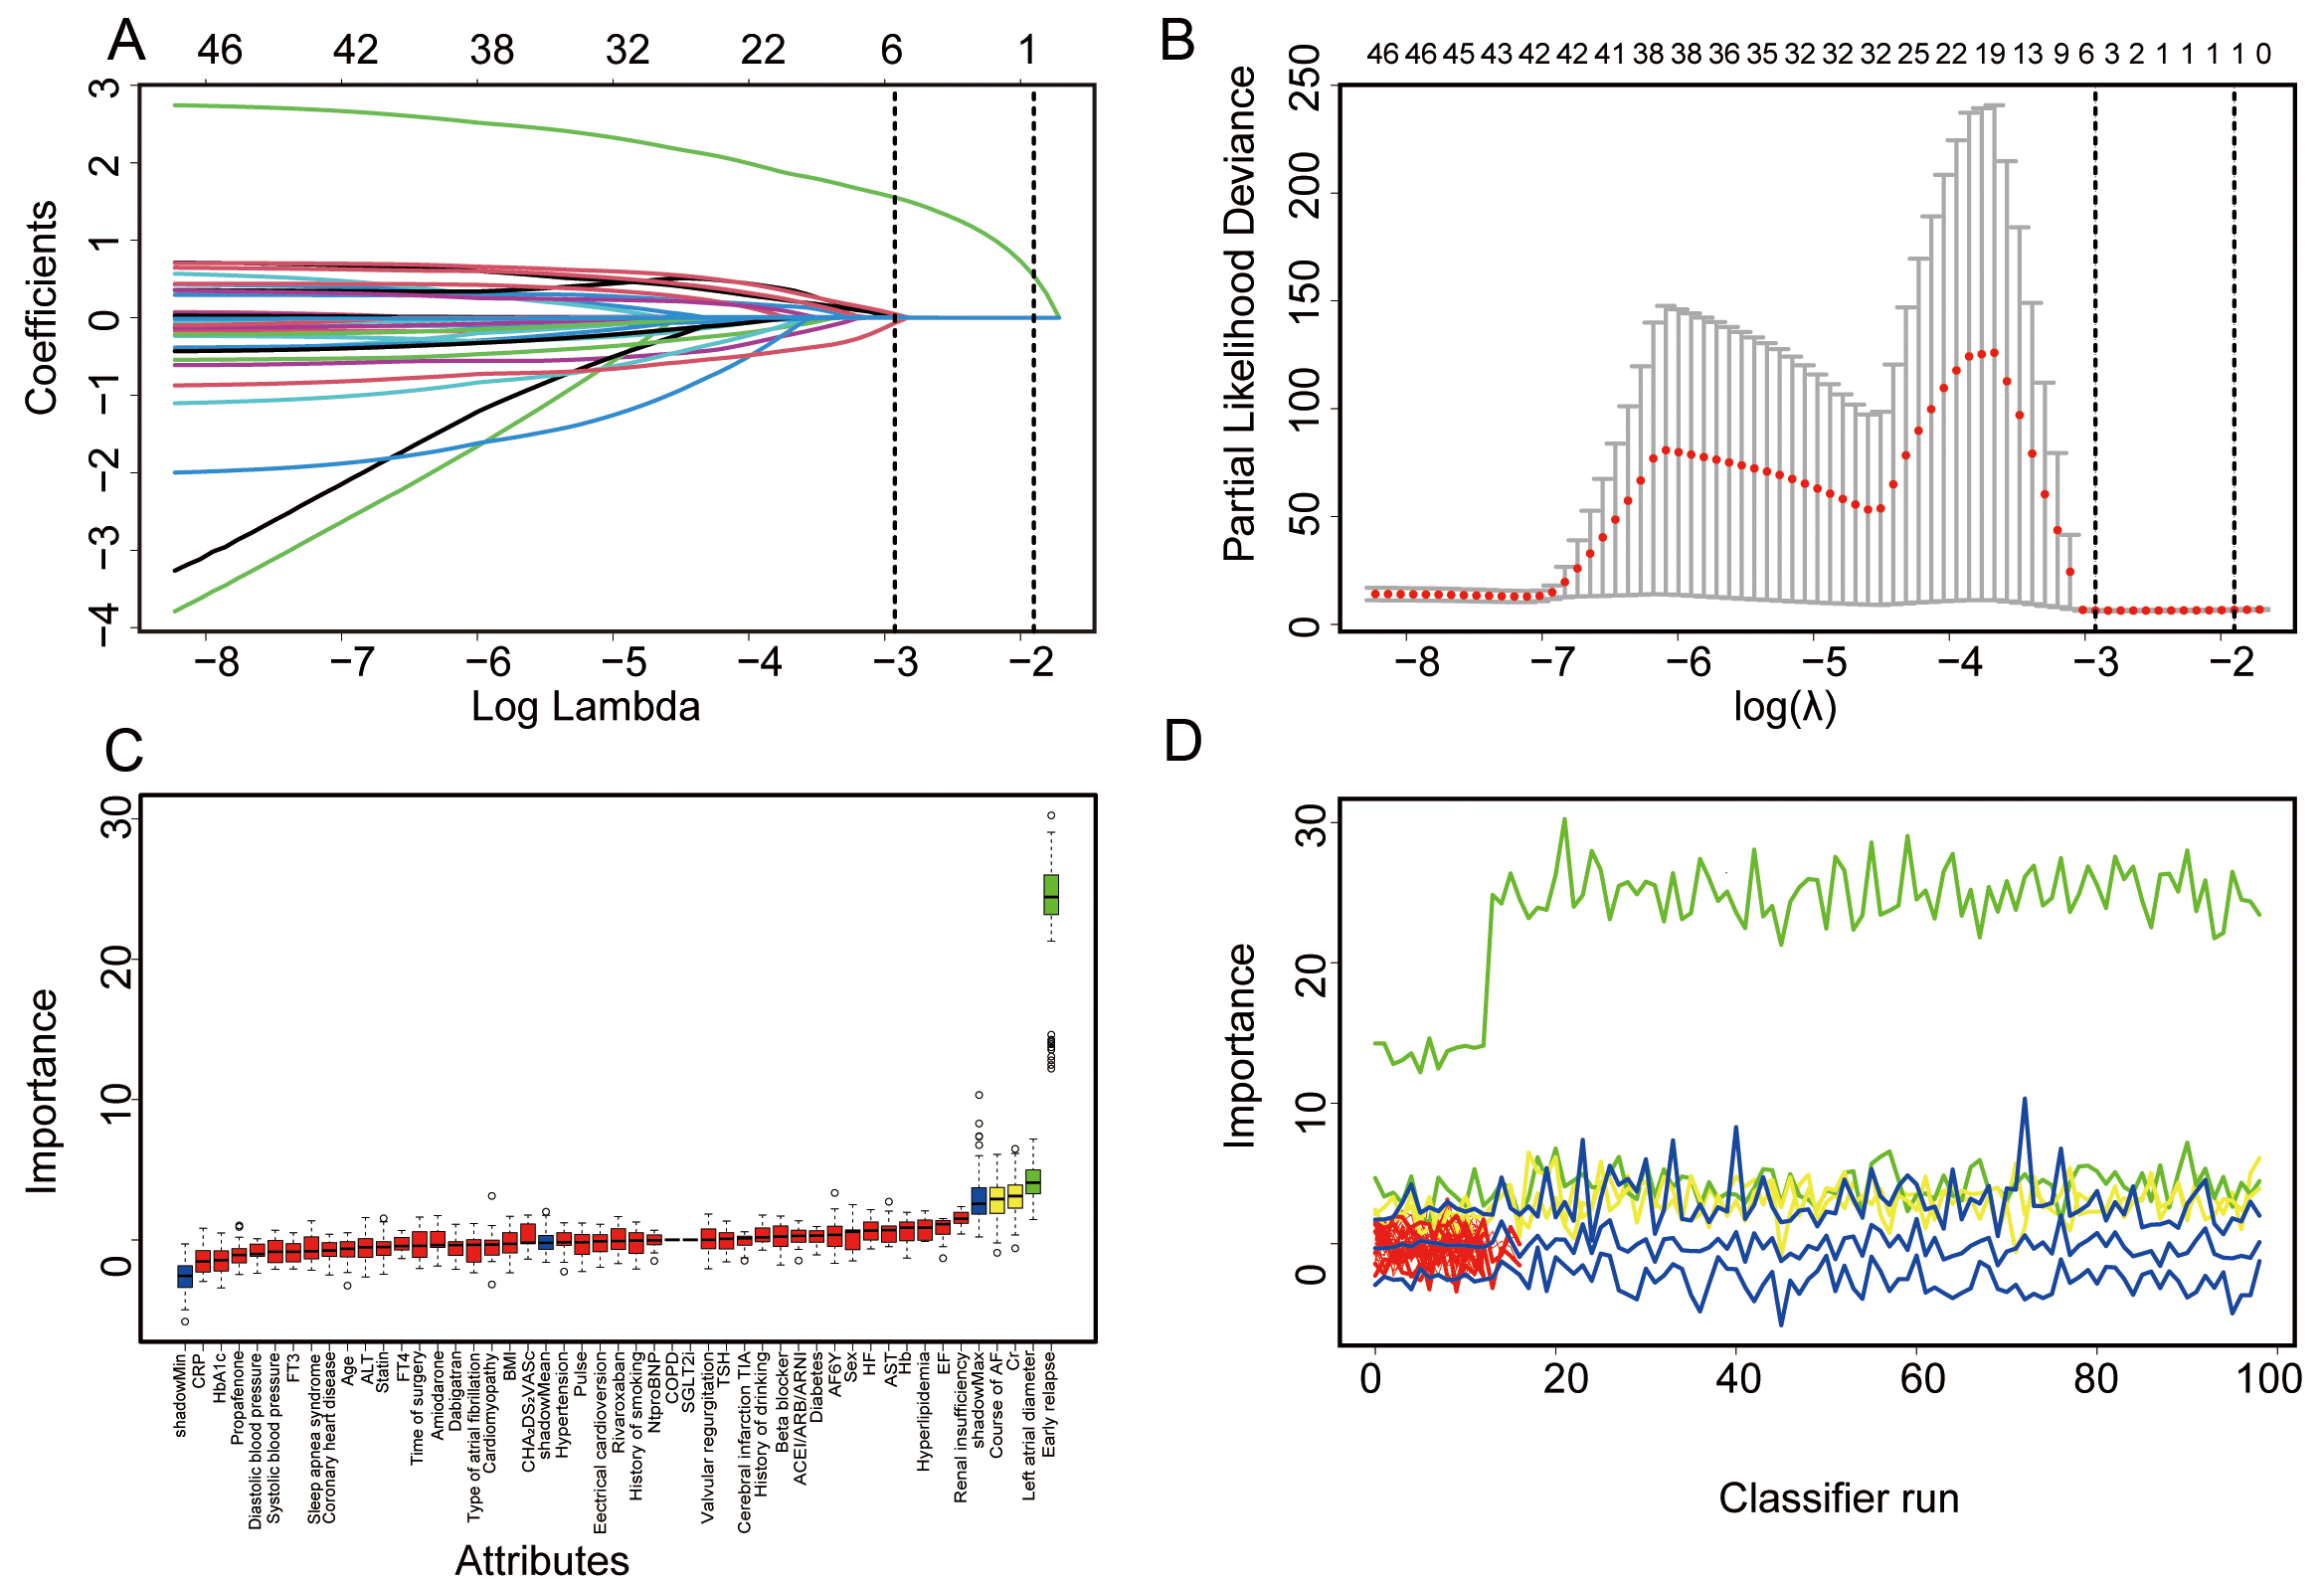
Figure 2. Feature selection using LASSO regression and the Boruta algorithm. (A) LASSO coefficient profiles plotted against log(λ); five variables with nonzero coefficients were retained at the optimal λ value. (B) Partial likelihood deviance (binomial deviance) curve used to identify the optimal λ; vertical dashed lines represent the minimum deviance and the 1-standard-error rule. (C) Boruta-based feature selection for predicting late recurrence. The y-axis shows Z-scores indicating feature importance; candidate predictors are listed on the x-axis. (D) Evolution of Z-scores across Boruta iterations. The x-axis shows iteration cycles; the y-axis indicates Z-score values. Color coding: blue = shadow features, green = confirmed predictors, red = rejected variables. Box plots display the range (min, mean, max) of Z-scores at each step.


