fig5

Development and external validation of a nomogram to predict adverse outcomes following delayed PCI in STEMI

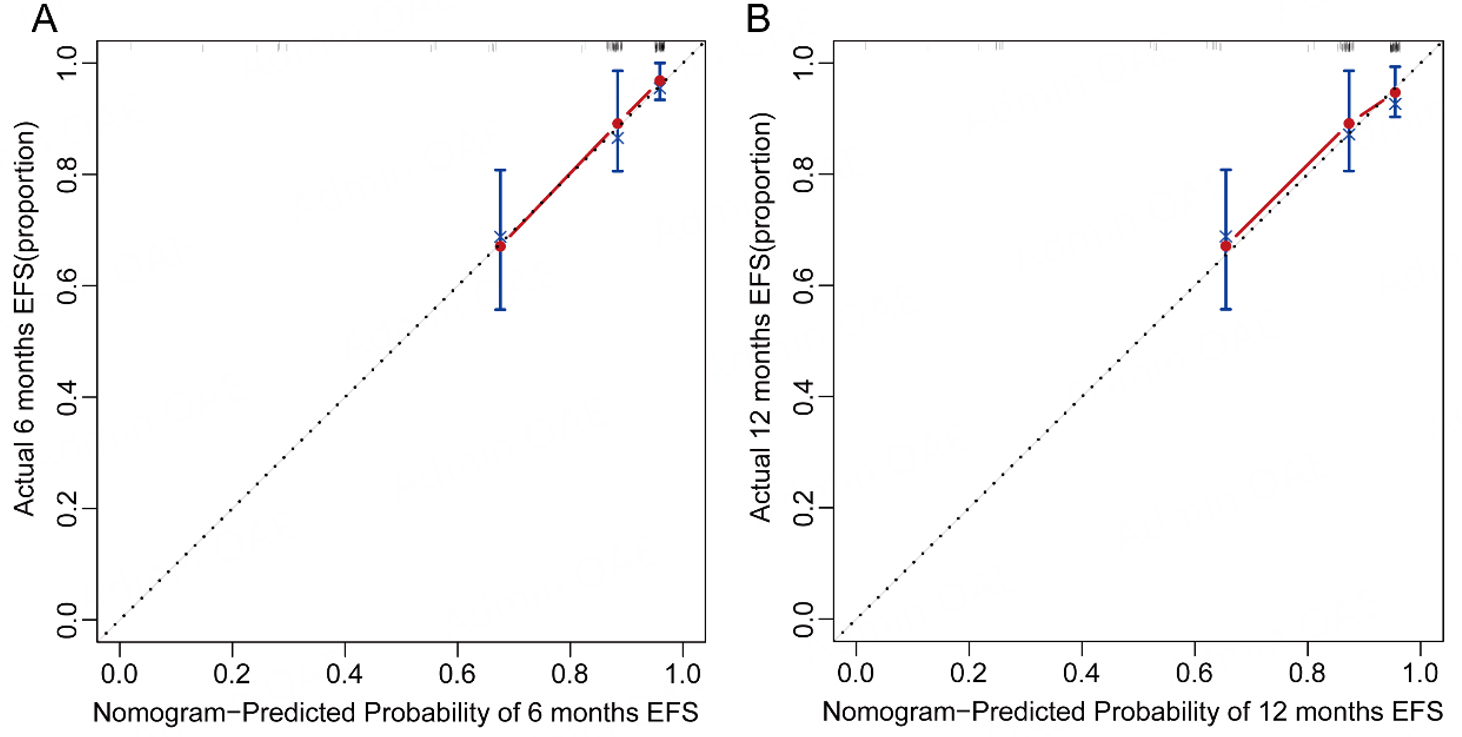
Figure 5. Calibration curves of the nomogram for predicting 6-month (A) and 12-month (B) EFS. Dots represent deciles of predicted risk. The diagonal line indicates ideal agreement between predicted and observed outcomes, and the solid line represents the bootstrap-corrected calibration curve based on 1,000 bootstrap resamples.

Vessel Plus
ISSN 2574-1209 (Online)
Follow Us

Portico

All published articles are preserved here permanently:

https://www.portico.org/publishers/oae/

Portico

All published articles are preserved here permanently:

https://www.portico.org/publishers/oae/