


A systematic review of comparative economic analyses of systemic therapies for hepatocellular carcinoma
 0
0 
Abstract
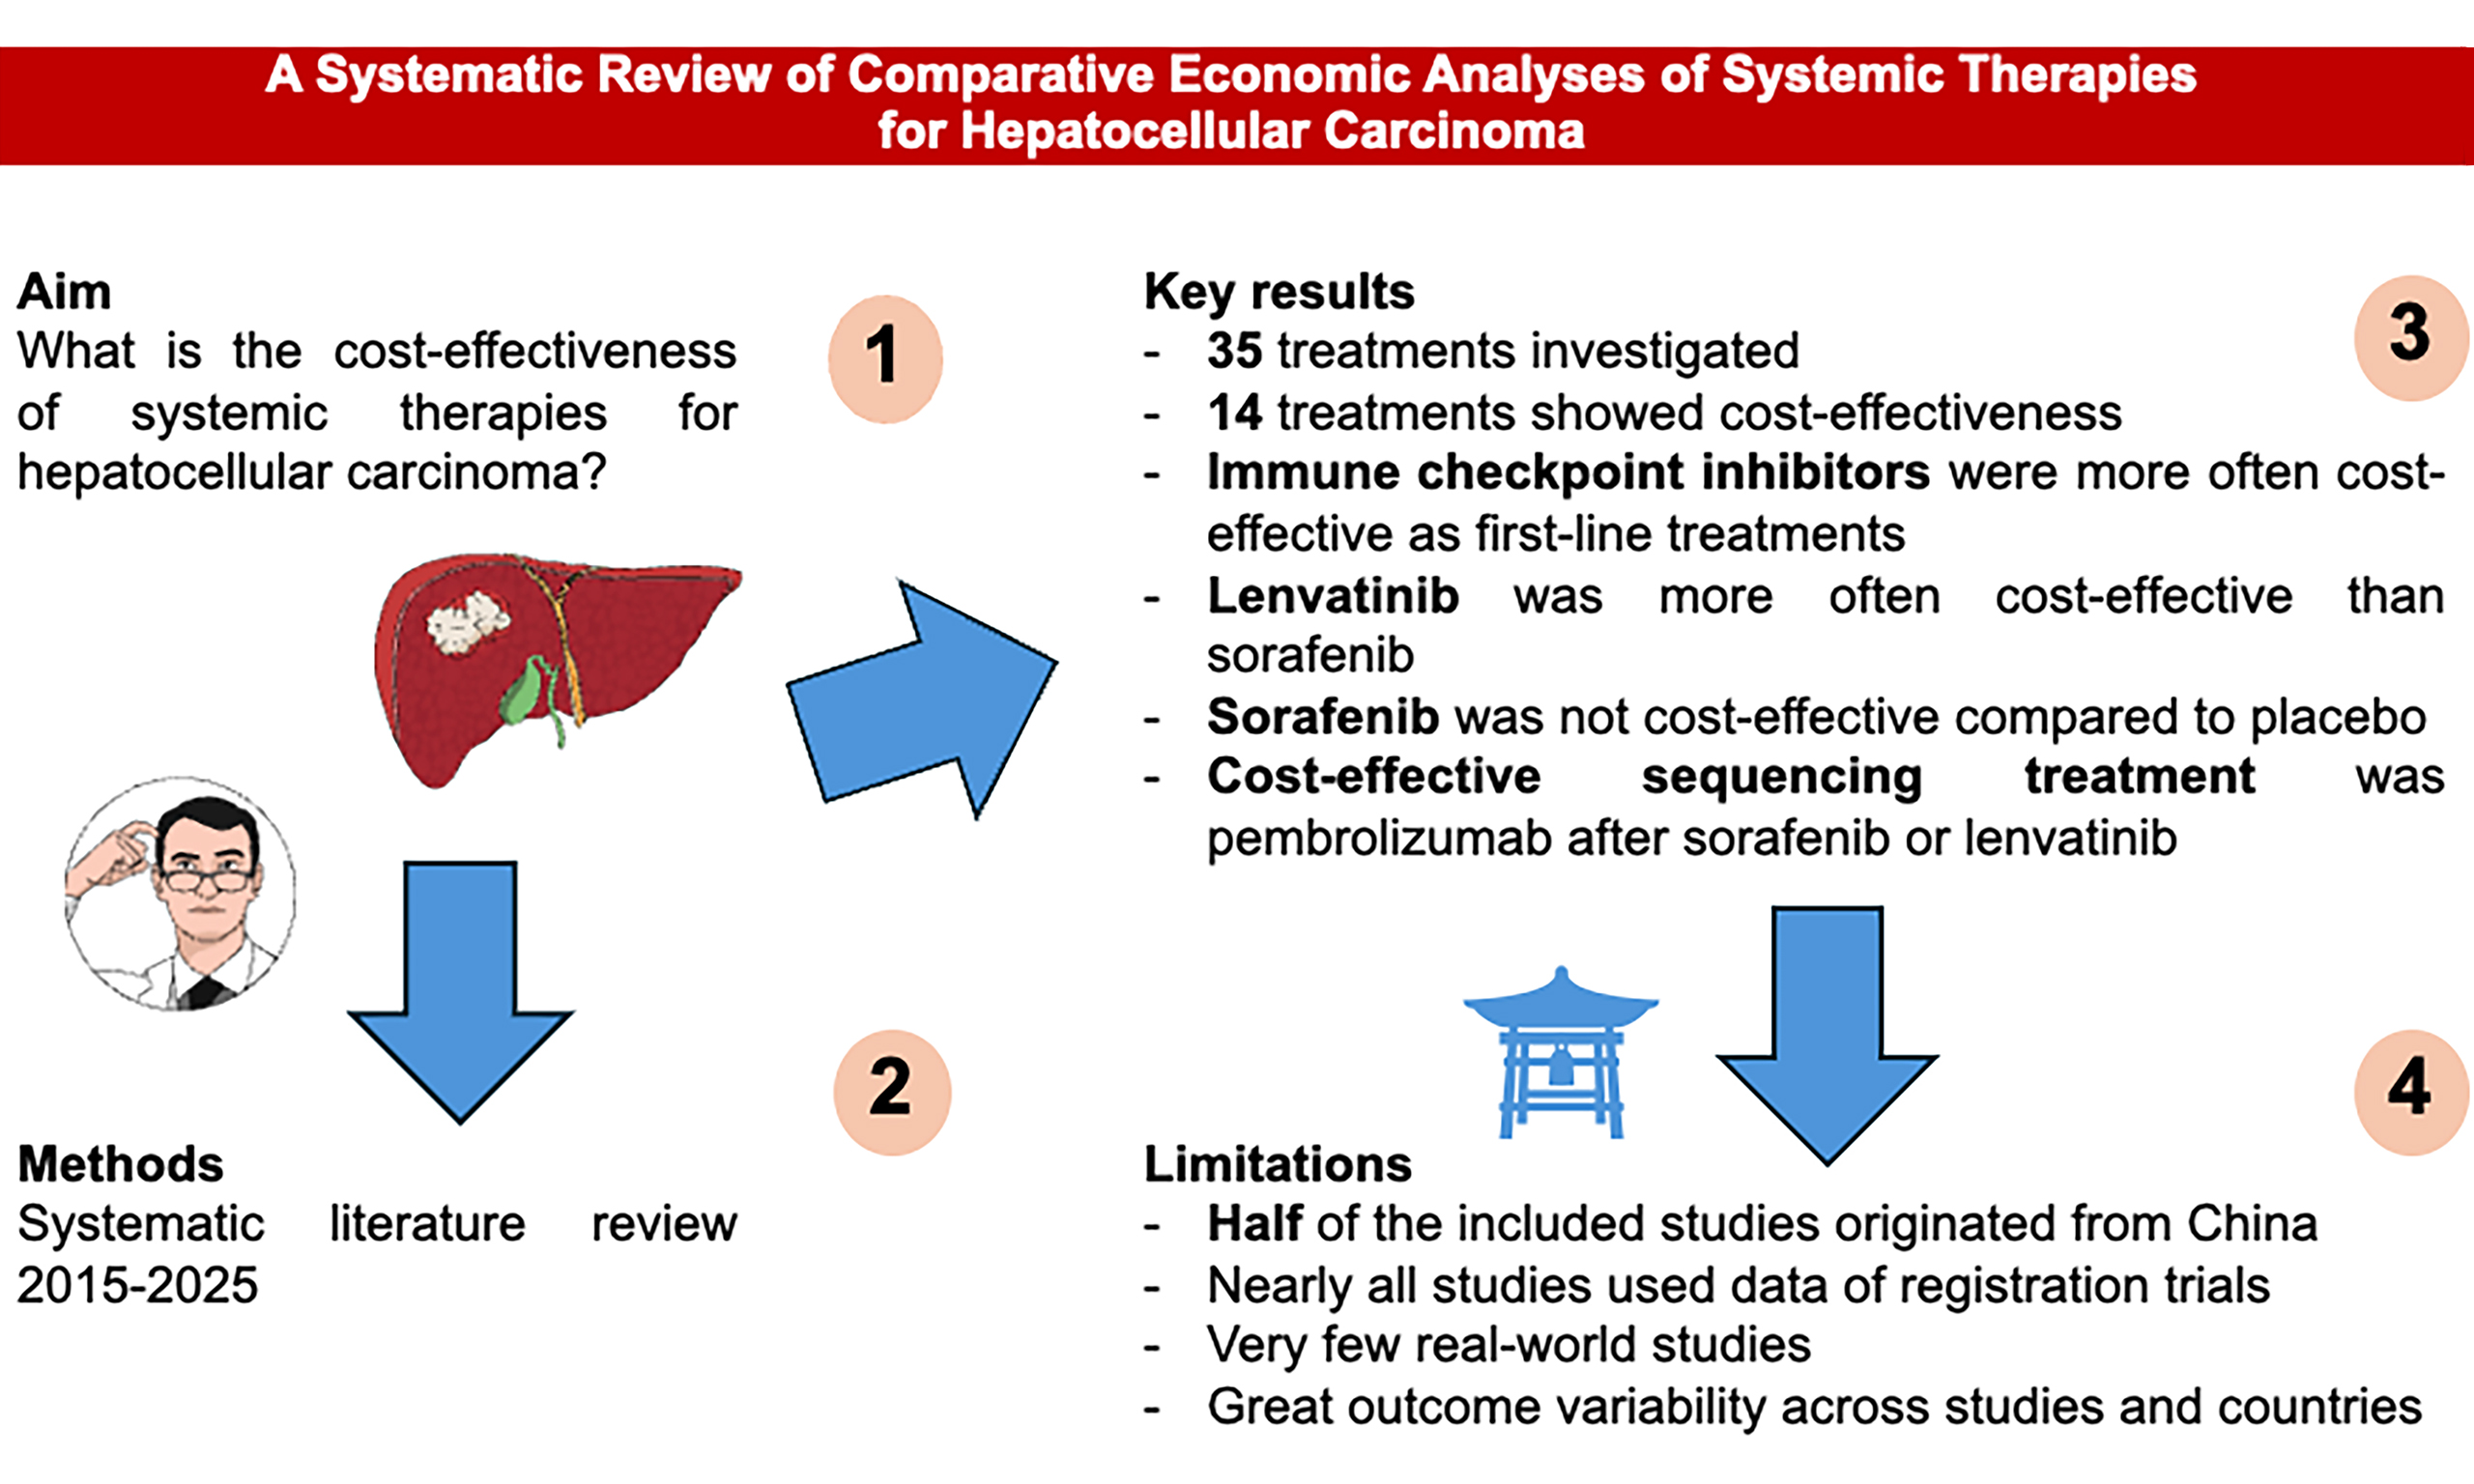
Aim: We conducted a systematic synthesis of comparative economic evaluations assessing systemic therapies for hepatocellular carcinoma (HCC) to establish their cost-effectiveness.
Methods: We searched six bibliographic databases for English-language studies published from 2015 through June 2025. Extracted endpoints included counts and types of regimens deemed cost-effective, quality-adjusted life years (QALYs), incremental cost-effectiveness ratios (ICERs), and ICER relative to national willingness-to-pay (WTP) thresholds.
Results: Fifty-four studies met the inclusion criteria, producing four treatment subgroupings and 35 distinct treatment comparisons. QALYs were reported in 96.3% of articles, ICERs in 90.7%, and WTP thresholds in 92.6%. Fourteen regimens (40.0% of comparisons) were judged cost-effective. Regimens that included immunotherapy were more often cost-effective, while lenvatinib outperformed sorafenib in most analyses. Nearly all studies (94.4%) relied, to varying degrees, on data from 14 randomized controlled trials; 48.1% focused on the Chinese healthcare environment; 27.8% used a lifetime horizon; and 38.9% reported a median [interquartile range (IQR)] horizon of 10 (9) years. Only 5.5% adopted a societal perspective.
Conclusion: Less than half of the evaluated systemic therapies were cost-effective, focusing mainly on immunotherapy-based regimens. Harmonized methodological standards are needed to ensure that economic evaluations keep pace with real-world practice as systemic treatments become more widely adopted. [International Platform of Systematic Review and Meta-Analysis Protocols (INPLASY) registration number: 2025100049].
Keywords
INTRODUCTION
Understanding the costs and cost drivers of medical treatments is vital to maintaining the viability of modern health systems in an era of constrained resources[1]. This concern is especially acute in oncology, where rising expenditures do not always correspond to substantial improvements in survival or quality of life[2,3]. Containing healthcare spending remains a persistent challenge, and expenditures are expected to continue climbing[4].
Management of hepatocellular carcinoma (HCC) now spans image-guided procedures, surgical resection, liver transplantation (LT), systemic drugs, and multimodal combinations[5-7], with associated costs steadily increasing[8,9]. One cost-control approach is to match patients to the therapies most likely to achieve a cure, prioritizing treatments with curative potential regardless of cost[1]. Another strategy emphasizes earlier diagnosis and rapid initiation of care[1]. Global surveillance recommendations for patients with chronic liver disease have improved early tumor detection and the chance for curative therapy[10]. Screening of asymptomatic high-risk individuals can uncover HCC at stages suitable for potentially curative interventions[11,12] thereby reducing treatment costs and improving outcomes[8].
Over the last decade, systemic options for HCC have expanded to include oral targeted therapies, tyrosine kinase inhibitors (TKIs), vascular endothelial growth factor (VEGF) pathway inhibitors (VEGFi), and immune checkpoint inhibitors (ICIs)[13]. Agents that improve response rates, progression-free survival (PFS), and overall survival (OS) have become first-line choices for advanced (aHCC), unresectable (uHCC), or metastatic (mHCC) HCC[14]. They are also being integrated in combined or sequential approaches with interventional radiology to pursue curative aims, facilitate conversion to resection, or serve as adjuvant/neoadjuvant therapies[15,16].
Despite their clinical importance, formal economic evaluations are mostly missing from major HCC management guidelines. The Barcelona Clinic Liver Cancer (BCLC)[5], the Japanese Society of Hepatology-HCC (JSH-HCC)[17], the Chinese guidelines[18], the European Association for the Study of the Liver (EASL)[19], and the American Association for the Study of Liver Disease (AASLD)[20] do not systematically include cost-effectiveness analyses. Differences in costing methods across studies, countries, and systems make it difficult to include economic data in effectiveness research. However, gaining a better understanding of the financial factors affecting HCC management could help clinicians make informed decisions within budget limits and involve administrators, payers, policymakers, patients, and other stakeholders in the process.
To address this gap, we reviewed comparative economic studies of contemporary HCC therapies, exploring differences by patient characteristics, tumor stage, institution, and geography. This paper concentrates on systemic agents used as first- or second-line therapies for advanced HCC.
METHODS
Research design
This work is a systematic review of comparative economic evaluations of therapeutic approaches for HCC. The interpretation of review findings draws upon the principles described by Sukhera in 2022[21]. This approach was selected to provide a critical, sometimes subjective appraisal of available evidence and to offer perspectives on how the field might progress from diverse vantage points[21,22]. Accordingly, we followed the five key steps outlined in prior publications[21-23].
Rationale for the review
Evaluating the cost-effectiveness of HCC treatments is crucial for guiding clinical decisions. As new drugs and regimens are introduced rapidly, assessments of the economic value of systemic therapies need frequent updates[5,13,15]. The goals of this study were to gather evidence on: (1) the comparative economic effectiveness, utility, and benefits of HCC treatment options; and (2) factors that influence treatment costs, including perspectives from clinicians, hospital managers, policymakers, patients, and stakeholders. The review also examined international differences in financial aspects among providers, payers, and regions. In this scope, we specifically focused on first- and second-line systemic therapies.
Research question
The primary research question of the entire project was: What are the most cost-effective treatments for patients with HCC?
Within this framework, the research question of the current study was: What are the most cost-effective first- and second-line systemic therapies for patients with HCC?
Boundaries and definitions
We used the P (patients/disease), I (interventions), C (comparators), and O (outcomes) framework, where patients were those affected by HCC; interventions included all active strategies for treating HCC, both curative and palliative; comparisons involved best supportive care (BSC) or comparisons across treatments; and outcomes measured economic treatment metrics. Therapeutic interventions were based on the 2025 EASL guidelines for HCC treatment. These were categorized into (1) ablation; (2) intra-arterial therapies; and (3) systemic therapies[19]. Ablation includes conventional or drug-enhanced radiofrequency ablation (RFA) or microwave ablation (MW), selective internal radiotherapy (SIRT), stereotactic body radiation therapy (SBRT), liver resection (LR), and LT. Intra-arterial therapies included hepatic artery infusion chemotherapy (HAIC) and trans-arterial chemoembolization (TACE). We also expanded the research to include treatments not yet fully explored by the EASL guidelines, such as carbon ion therapy (CIT). Based on the available studies, these treatments were considered either alone or in combination.
Comparative economic evaluations were defined per international standards as cost-minimization analysis (CMA), cost-benefit analysis (CBA), cost-effectiveness analysis (CEA), cost-utility analysis (CUA), and cost-of-illness analysis (COIA)[24,25]. COIA papers were excluded because they lacked a comparator population[25,26]. Considerable overlap exists among these methods, particularly between CEA and CUA, and classifications vary across authors[27-29].
Inclusion criteria
PubMed (PubMed.gov), Google Scholar (https://scholar.google.com/), Cochrane (Wiley Online), Scopus, Web of Science (WoS), and Embase (Embase.com) were searched on July 1, 2025. The Preferred Reporting Items for Systematic Reviews and Meta-Analyses (PRISMA) and Consolidated Health Economic Evaluation Reporting Standards (CHEERS) guidelines were used to define the study’s eligibility criteria, conduct quality assessment, and analyze the results[30,31]. A PRISMA checklist for the abstract and paper is provided as Supplementary Materials.
The search terms used to retrieve the studies are illustrated in the Supplementary Materials. Only full-length articles in English or in English translations were included. Systematic reviews, commentaries, empirical articles, gray literature, trade publications, and digital media communications were excluded and used only to retrieve additional references not included in the original search strategy. Owing to various factors, such as the rising healthcare costs of HCC treatment[4,8], advancements in recent medical technologies for HCC, shifts in liver disease epidemiology with the emergence of metabolic dysfunction-associated liver disease (MASLD), and the increasing number of publications on HCC, the literature review was limited to studies published between 2015 and June 30, 2025. However, if the thematic coverage was insufficient, a second search was conducted without date restrictions, and key or seminal papers on the topic, along with other relevant manuscripts, were considered, regardless of their publication date.
Only articles comparing first- or second-line systemic treatments to active comparators, placebo, or BSC were included in the final analysis. Studies involving neoadjuvant or adjuvant therapies administered before or after radiology-assisted interventions or surgery, and systemic therapies compared with intrahepatic arterial infusion, were excluded.
The references were initially evaluated independently by two investigators (Longo D and De Simone P) based on the face value of their abstracts, with any disagreements resolved by a third reviewer (Peritore D). The reference lists of the articles were also checked for additional literature (snowballing). An artificial intelligence (AI)-based Rayyan platform was used to sort articles, assess abstracts and texts, and eliminate duplicates (https://www.rayyan.ai/). A shared Google Drive repository was used to collect and review articles from all team members.
Data extraction and interpretation
Extracted variables included year, authors, title, study type, country, population, interventions and comparators, and effectiveness measures [quality-adjusted life-years (QALYs) or life-years saved (LYS)]. Costing methods, time horizons, discount rates, currencies, sensitivity analyses, reported costs, and economic metrics were also recorded. HCC stage was classified according to the BCLC system, and interventions were categorized as curative or non-curative. International currencies were converted to US dollars using a currency converter[32]. No inflation adjustments were made to reported monetary values. Outcomes were assessed using three primary metrics: (1) QALYs and LYS as measures of clinical benefit; (2) incremental cost-effectiveness ratio (ICER) per QALY/LYS [or incremental cost-utility ratio (ICUR)] to show additional cost per unit benefit; and (3) ICER/willingness-to-pay (WTP) ratio to indicate cost-effectiveness, using WTP values reported in the studies or, when absent, the World Health Organization (WHO) guidance calculating WTP as three times the per capita gross domestic product (GDP)[33]. Data interpretation followed Sukhera[21].
Evaluation of the risk of bias
At least three investigators independently reviewed the included papers[34-87]. The risk of bias was first appraised using the Joanna Briggs Institute (JBI) checklist by three team members experienced in research quality assessment[88]. The JBI checklist comprises 11 items evaluating general and specific study attributes[88]. No minimum JBI score was required for inclusion; all studies meeting eligibility criteria were analyzed, though potential biases affecting cost-effectiveness outcomes were noted. Given that JBI does not cover all economic evaluation needs, we also assessed studies using the ECOBIAS checklist[89].
Data description and analysis
Clinical and demographic variables were described using reported means, standard deviations (SDs), medians, and percentages. Missing data were not imputed. Means were weighted across series when appropriate; medians were pooled via meta-analytic techniques when raw data were lacking, using a random-effects model with inverse-variance weighting to account for heterogeneity. Monetary values are those reported in the original articles; foreign currencies were converted to 2025 US dollars[32]. Data were tabulated (author, year, country assessed, treatments/comparators, QALYs/LYs, WTPs, and methodological notes) [Tables 1-4][34-87]. For clarity and to mirror clinical practice, data were stratified by treatment type and number of active regimens (immunotherapy, multiple comparators, oral agents, second-line vs. placebo/BSC). A methodological summary combining JBI and ECOBIAS inputs appears in Tables 5 and 6.
Results of comparative economic studies on head-to-head comparisons of ICI as first-line therapy
| # | Author[Ref.] | Year | Country | Indication | Treatments | QALYa | ICERb | WTPc | ICER/WTPd | Remarks |
| Atezolizumab + Bevacizumab | ||||||||||
| 1 | Chang et al.[34] | 2025 | Taiwan | aHCC | ATE + BEVA vs. SORA | 0.57 | US$117,000 | US$92,579.9 | 1.2 | Data extracted from the IMBrave150 trial Partitioned survival analysis with a 20-year horizon The perspective was that of the National Health Insurance Administration Discount 0%-5% |
| 2 | Liu et al.[35] | 2025 | USA & China | aHCC | ATE + BEVA vs. SORA | 0.57 (USA) 0.47 (China) | US$253,247.07 (USA) US$181.552,71 (China) | US$150,000 (USA) US$38,201.19 (China) | 1.68 (USA) 4.75 (China) | Data extracted from the IMBrave150 trial Partitioned survival analysis with a life-time horizon Discount 3% in USA and 5% in China |
| 3 | Chee et al.[36] | 2024 | Singapore | uHCC | ATE + BEVA vs. SORA | 1.09 | US$80,676.9 | US$89,432.5 | 0.9 | Data extracted from the IMBrave150 trial Partitioned survival model with a 10-year horizon |
| 4 | Sriphoosanaphan et al.[37] | 2024 | Thailand | uHCC | ATE + BEVA vs. SORA | 0.8309 | US$54,589 | US$4,678 | 11.66 | Data were extracted from a network meta-analysis of published studies Markov model with a life-time horizon Societal perspective Annual discount rate 3% |
| 5 | Tseng et al.[38] | 2023 | Taiwan | uHCC | ATE + BEVA vs. SORA | 1.7 | US$75,192 | US$92,579.9 | 0.81 | Data were extracted from the IMBrave-105 trial Partitioned survival analysis with a 15-year horizon Annual discount rate % |
| 6 | Gaugain et al.[39] | 2023 | France | a/uHCC | ATE + BEVA vs. SORA | 0.61 | €131,163 (i.e. US$155,352) | €150,000 (US$177,663) | 0.87 | Data were extracted from the French national real-world dataset and IMBrave150 Partitioned survival model over a lifetime horizon |
| 7 | Li et al.[40] | 2022 | China | a/uHCC | ATE + BEVA vs. NIV | 0.69 (1.13 LYS) | US$113,892 | US$150,000 Note: this WTP threshold is higher than what is used by most Chinese authors | 0.75 | Data were extracted from a network meta-analysis integrating IMBrave150 and CheckMate459 trials Partitioned survival analysis with a 10-year horizon |
| 8 | Zhang et al.[41] | 2021 | China | u/mHCC | ATE + BEVA vs. SORA | 0.484 (0.623 LYS) | US$322,500 | US$100,000-150,000 | 3.22-2.15 | Data were extracted from the IMBrave105 trial Partitioned survival analysis with a 6-year horizon The US payor perspective was used |
| 9 | Chiang et al.[42] | 2021 | Hong Kong | uHCC | ATE + BEVA vs. SORA | 0.44 | US$179,729 | US$100,000-150,000 | 1.79-1.19 Reducing the price of both drugs by 20% and 29% would satisfy the WTP thresholds (both scenarios) | Data extracted from the IMBrave105 trial Markov model with a lifetime horizon US payor’s perspective |
| 10 | Su et al.[43] | 2021 | USA | uHCC | ATE + BEVA vs. SORA | 0.530 (1.297 LYS) | US$169,223 (ICUR) | US$150,000 | 1.12 Cost-effectiveness can be improved by reducing the cost of either drug and adapting schedules to patients’ risk factors | Data extracted from the IMBrave105 trial and additional trials Partitioned survival analysis Annual discount rate 3% |
| 11 | Wen et al.[44] | 2021 | China | uHCC | ATE + BEVA vs. SORA | 0.53 | US$145,546.21 (China) US$168,030.21 (USA) | US$28,527.00 (China) US$150,000 (USA) | 5.1 1.12 | Data extracted from IMBrave105 Markov model Chinese and US perspectives were considered |
| Sintilimab + Bevacizumab or Bevacizumab biosimilar | ||||||||||
| 12 | Xu et al.[45] | 2023 | China | uHCC | SIN + BEVAb (IBI305)e vs. SORA | 0.33 | US$52,817.89 | US$38,334 | 1.37 | Data were extracted from the ORIENT-32 trial Markov model Chinese payors perspective |
| 13 | Peng et al.[46] | 2022 | China | uHCC | SIN + BEVAb vs. SORA | 1.27 (1.84 LYS) | US$23,352 | US$30,552 | 0.76 | Data were extracted from the ORIENT-32 trial Markov model with a lifetime horizon Chinese healthcare system’s perspective |
| 14 | Zhou et al.[47] | 2022 | China | u/mHCC | SIN + BEVAb vs. LEN | 0.493 | US$24,462 | US$12,516 (low-income areas) US$37,547 (national average) | 1.9 0.65 The cost-effectiveness ratio was particularly sensitive to the cost of biosimilar BEVA | Data were extracted from ORIENT-32 and REFLECT trials Partitioned survival analysis with a lifetime horizon Chinese healthcare system perspective |
| 15 | Zhou et al.[48] | 2021 | China | uHCC | SIN + BEVA vs. SORA | 0.5 | US$20,968 | US$33,592 | 0.62 Cost-effectiveness may further increase by reducing the dosage of BEVA to 7.5 mg/kg | Data were extracted from the ORIENT-32 trial Partitioned survival analysis with a lifetime horizon Chinese healthcare system’s perspective |
| STRIDE (Single dose tremelimumab and regular interval durvalumab) | ||||||||||
| 16 | Cheng et al.[49] | 2025 | USA | uHCC | TREM + DUR (STRIDE) vs. SORA | 0.57 | US$19,239 | US$150,000 | 0.13 | Data extracted from the HIMALAYA trial and network meta-analysis of published trials Partitioned survival analysis with a 20-year horizon Payer perspective |
| 17 | Xiong et al.[50] | 2024 | USA | uHCC | 1. TREM + DUR (STRIDE) 2. DUR alone vs. SORA | 0.2 (0.27 LYS) 0.08 (0.15 LYS) | 1.US$97,995.5 (STRIDE vs. SORA) 2.US$754,408 (STRIDE vs. DUR alone) | US$150.000 | 0.65 5.02 | Data extracted from the HIMALAYA protocol and STRIDE strategy Partitioned survival analysis with a 48-month horizon US societal perspective |
| 18 | Liao et al.[51] | 2024 | China | uHCC High AFP | TREM + DUR (STRIDE) vs. SORA | 0.29 | US$72,762 | US$150.000 | 0.48 | Data extracted from the HIMALAYA protocol and STRIDE strategy Markov model |
| Camrelizumab + Rivoceranib | ||||||||||
| 19 | Zhao et al.[52] | 2024 | China | uHCC | CAM + RIV vs. SORA | 0.80 | US$9,150.75 | US$16,426.80 (low-income regions) US$34,319.01 (medium-income regions) US$81,036.63 (high-income regions) | 0.56 0.27 0.11 | Data extracted from the CARES-310 trial Markov state transition model Sensitivity analysis stratified based on regions income |
| 20 | Wei et al.[53] | 2024 | USA & China | uHCC | CAM + RIV vs. SORA | 0.71 (USA) 0.64 (China) | US$122,388.62 (USA) US$30,410.56 (China) | US$100.000-150.000,00 (USA) US$23,932.5-35,898.8 (China) | 1.22-0.81 1.27-0.84 | Data extracted from the CARES-310 trial USA and Chinese payors perspective Partitioned survival model with a 15-year time horizon |
| Tislelizumab | ||||||||||
| 21 | Sun et al.[54] | 2024 | China USA Europe | uHCC | TIS vs. SORA | 0.56 (USA and Europe) 0.52 (China) | US$108,812.5 (USA) US$94,880.40 (Europe) (Europe) US$14,206.80 (China) | US$150.000(USA) US$100.000(Europe) US$38,186 (China) | 0.72 0.94 0.37 | Data extracted from the RATIONALE-301 trial Partitioned survival model Monte Carlo simulation |
| 22 | Zheng et al.[55] | 2024 | China | uHCC | TIS vs. SORA | 0.18 | US$10413.17 | US$37,304.34 | 0.27 | Data extracted from the RATIONALE-301 trial Partitioned survival model with a 10-year survival horizon |
| 23 | Chen et al.[56] | 2024 | China | uHCC | TIS vs. SORA | 0.568 | US$ 22,869.64 | $37,653 | 0.60 | Data extracted from the RATIONALE-301 trial Partitioned survival model with a lifetime horizon National Health Service perspective |
| Nivolumab | ||||||||||
| 24 | Shu et al.[57] | 2023 | China | aHCC | NIV vs. SORA | 0.27 | US$236,765.93 | US$38,201.1 | 6.19 | Data were extracted from the CheckMate-459 trial Partitioned survival model Chinese healthcare system perspective |
| 25 | Li et al.[58] | 2022 | China | aHCC | NIV vs. SORA | 0.32 (0.50 LYS) | US$220,864 | US$150,000 Note: this WTP threshold is higher than what is used by most Chinese authors | 1.47 However, cost-effectiveness increases for BCLC-B patients | Data were extracted from CheckMate459 trial Partitioned survival analysis with a 10-year lifetime horizon |
Results of economic studies comparing simultaneously multiple ICI- and TKI/VEGFi-based regimens as first-line therapy irrespective of the used comparator(s)
| # | Author | Year | Country | Indication | Treatments | QALYa | ICERb | WTPc | ICER/WTPd | Remarks |
| Sequencing treatments | ||||||||||
| 26 | Sherrow et al.[59] | 2020 | USA | uHCC 1st and 2nd-line treatment | 8 different 1st- and 2nd-line sequences using: SORA, REGO, CABO, PEM, NIV, LEN (SORA-REGO; SORA-CABO; SORA-NIV; SORA-PEM; LEN-REGO; LEN-CABO; LEN-NIV; LEN-PEM) | Not applicable due to multiple comparators | The strategies with the highest cost-effectiveness were TKI followed by ICI The 2 most cost-effective strategies were: SORA-PEM (US$227,741.03) LEN-PEM (US$230,371.17) | US$150,000-300,000 | A sequencing strategy of 1st-line TKI followed by 2nd-line ICI is more cost-effective than TKI-TKI SORA-PEM and LEN-PEM are the most cost-effective but well above the WTP threshold of US$150,000 | Data extracted from RCT on all drugs included in the study Markov model with 9 possible states |
| Multiple regimens comparisons | ||||||||||
| 27 | Lian et al.[60] | 2024 | China USA | uHCC | 1. ATE + BEVA; 2. TREM + DUR (STRIDE); 3. DUR; 4. LEN vs. SORA | 1. 1.92 (2.73 LYS) 2. 1.67 (2.40 LYS) 3. 1.52 (2.18) 4. 1.406 (2.05 LYS) | 1. US$196,704 2. US$800,755 3. Reported as dominant due to lower cost than SORA (US$178,200 vs. 202,831) 4. US$2,032,756 | US$150.000,00 | 1. 1.31 2. 5.33 3. Dominant 4. 13.55 | Data extracted from literatures studies and network meta-analysis Partitioned survival analysis with a 10-year horizon US healthcare and societal perspectives |
| 28 | Wen et al.[61] | 2024 | China | uHCC | 1. TREM + DUR (STRIDE); 2. ATE + BEVA; 3. SIN + BEVAb; 4. CAM + RIV; 5. PEM + LEN | 1 = 0.73 2 = 0.90 3 = 1.12 4 = 0.91 5 = 0.83 | 1. US$115,887.68 2. US$78,872.289 3. US$24,072.86 4. US$13,306.89 5. US$66,725.94 | US$35,526.9 | 3.2 2.2 0.67 0.37 1.87 | Data extracted from HIMALAYA, IMBrave150, ORIENT-32, CARES-310, and LEAP-002 trials Markov model with a 10-year horizon Monte Carlo simulations |
| 29 | Sun et al.[62] | 2022 | China, USA | aHCC | (China) 1. ATE + BEVA 2. SIN + BEVA 3. LEN 4. DONA 5. SORA (USA) 1. ATE + BEVA 2. LEN 3. NIV 4. SORA | (China) Compared with DONA 1. 0.46 2. 1.25 3. 0.77 4. -1.08 (USA) Compared with NIV 1. 3.76 2. 4.29 3. 1.92 | (China) Compared with DONA 1. US$85,607.88 2. US$12,109.27 3. US$1,651.47 (USA) Compared with NIV 1. 47,896.93 2. 25,022.13 3. 89,972.04 | US$11,101.70 (China) US$69,375.0 (USA) NOTE: the WTP thresholds are lower than what is reported by other authors and correspond to the lowest range of WHO’s recommendations | (China) Compared to DONA 1. 7.71 2. 1.09 3. 0.14 (USA) Compared to NIV 1. 0.69 2. 0.36 3. 1.29 | Network meta-analysis based on RCTs Markov model Annual discount rate 0%-8% in China and 0%-5% in USA |
| 30 | Li et al.[63] | 2022 | China | uHCC | 1. SIN + BEVAb 2. ATE + BEVA vs. SORA | 1. 0.617 2. 0.596 | 1. US$39,766.86 2. US$103,037.66 | US$33,500 | 1. 1.18 2. 3.07 SIN + BEVAb cost-effectiveness is favorable in the context of a patient-assisted program scenario | Data were extracted from IMBrave150 and ORIENT-32 trials Partitioned survival model with a 15-year lifetime horizon Annual discount rates 5% A patience-assisted program was included in sensitivity analysis |
| 31 | Gong et al.[64] | 2022 | China | aHCC | 1. LEN 2. ATE + BEVA 3. SIN + IBI305e vs. SORA | 1. 0.04 2. 0.31 3. 0.87 | 1. US$188.625 2. US$75,150.3 3. US$144,513 | US$36,600 | 1. 5.15 2. 2.05 3. 3.94 | Data were extracted from previous trials (NCT01761266, NCT0343437, NCT03794440) Partitioned survival model Interviews with clinicians were used to derive costs Annual discount rate of 5% |
| 32 | Wang et al.[65] | 2022 | China | aHCC | 1. SUN 2. LEN 3. DONA 4. SORA + ERL 5. SIN + IBI305e 6. LIN 7. BRIVA 8. ATE + BEVA vs. SORA | 1. 0.78 2. 0.45 3. 0.83 4. 0.81 5. 0.82 6. 0.82 7. 0.85 8. 0.85 | 1. US$551 2. US$121,059 3. US$68,869 4. US$95,545 5. US$115,760 6. US$128,527 7. US$115,760 8. US$160,049 | US$37,654.5 | 1. 0.01 2. 3.21 3. 1.82 4. 2.53 5. 3.07 6. 3.41 7. 3.07 8. 4.2 | A theoretical model for first-line therapies was constructed based on SHARP and NCT00492752 trials Markov model with a 10-year time horizon Chinese payors perspective and only direct costs included |
| 33 | Guan et al.[66] | 2022 | China | uHCC | 1. DONA 2. SORA 3. LEN | 1. 1.106 (1.755 LYS) 2. 0.999 (1.577 LYS) 3. 0.915 (1.410 LYS) DONA vs. LEN = 0.107 (0.178 LYS) DONA vs. SORA = 0.191 (0.345 LYS) LEN vs. SORA = 0.0084 (0,167 LYS) | 1. US$42,116 2. U$44,261 3. US$43,193 Only costs were provided and ICER was generically indicated to be dominated by DONA | U$31,315 | 1. 1.34 2. 1.41 3. 1.37 | Data were extracted from network meta-analysis using ZGDH-3 phase 2 and 3 trials and REFLECT trial Partitioned survival analysis with a lifetime horizon |
| 34 | Zhao et al.[67] | 2022 | China | uHCC | 1. SORA 2. LEN 3. DONA 4. SIN + BEVAb 5. ATE + BEVA | Compared to SORA: LEN = 0.16 (0.25 LYS) DONA = 0.19 (0.30 LYS) SIN + BEVAb = 0.51 (0.95 LYS) ATE + BEVA = 0.86 (1.46 LYS) | Compared to SORA: LEN = US$40,667.92 DONA = US$27,630.63 SIN + BEVAb = US$51,877.36 ATE + BEVA = US$130,508.44 | US$33,521 | LEN = 1.21 DONA = 0.82 SIN + BEVAb = 1.54 ATE + BEVA = 3.89 | Network meta-analysis of 4 trials (IMBrave105, REFLECT, ORIENT-32, ZGDH-3) Partitioned survival analysis Chinese healthcare system’s perspective |
| 35 | Giuliani et al.[68] | 2021 | Italy | aHCC | 1. LEN 2. ATE + BEVA vs. SORA | Not reported | €139.24 (per month of PFS) €9198.82 (per month of PFS) | Not reported | Not reported | Data were extracted from the IMBrave105 and REFLECT trials Survival model not clearly indicated PFS rather than overall survival was used to compute ICER Perspective of a National Health System hospital facility |
Results of economic studies on head-to-head comparison of TKI/VEGFi-based regimens only as first-line therapy irrespective of the used comparator(s)
| # | Author | Year | Country | Indication | Treatments | QALYa | ICERb | WTPc | ICER/WTPd | Remarks |
| TKI/VEGFi | ||||||||||
| 36 | Meng et al.[69] | 2022 | China | u/mHCC | DONA vs. SORA | 0.184 | US$41,081.52 US$13,439.10 (if the branded price of SORA was considered) | USS$10,499.74 TKI/VEGFi TKI/VEGFi 31,499.23 | 3.9-1.3 1.2-0.42 (if a reduced DONA price is considered) | Data were extracted from network using ZGDH-3 phase 2 and 3 trials Partitioned survival analysis with a lifetime horizon Chinese healthcare system’s perspective Annual discount rates 5% Scenario analysis with the brand and generic price of SORA |
| 37 | Meyers et al.[70] | 2021 | Canada | uHCC | LEN vs. SORA | 0.17 (0.22 LYS) | -US$5021 (as ICUR) | Not reported | LEN is dominant on SORA due to its reduced cost | Data extracted from the REFLECT trial Partitioned survival analysis over a 10-year horizon Canadian health provider’s perspective |
| 38 | Ikeda et al.[71] | 2021 | Japan | uHCC | LEN vs. SORA | 0.31 | -JPY156799 (US$1060,15) | Not reported | LEN dominates on SORA due to reduced costs and improved QALY | Data extracted from the Japanese population of the REFLECT trial Partitioned survival model with a lifetime horizon Japanese healthcare system’s perspective Annual discount rate of 2% |
| 39 | Saiyed et al.[72] | 2020 | Australia | uHCC | LEN vs. SORA | 0.119 | A$33,028 (US$21,792.3) | AU$50,000 (US$32,990.7) | 0.66 | Data extracted from the REFLECT trial Partitioned survival model with a 10-year horizon A health-system perspective was adopted |
| 40 | Cai et al.[73] | 2020 | China | uHCC | LEN vs. SORA | 1.122 (< 60 kg) 1.122 ( 60 kg) | US$11,825.94 (< 60 kg) US$28,627.12 ( 60 kg) | US$29,306.37 | 0.40 0.97 | Data extracted from the REFLECT trial Chinese patients Markov model with transition states Annual discount rate 3% The China National Healthcare Medical Administration perspective was used |
| 41 | Kim et al.[74] | 2020 | Canada | aHCC | LEN vs. SORA | 0.132 | In the full-price SORA scenario, LEN dominated on SORA and was associated with a 23,719.34US$ cost saving In the 90%-discount SORA scenario, LEN ICER was US$104,668.71 | US$0-50,000 | LEN is cost-saving as compared to SORA and its cost-effectiveness is well below the WTP threshold in the full-price SORA scenario However, introduction of a generic SORA formulation or SORA discounted price might reduce LEN cost savings | Data extracted from the REFLECT trial State-transition model with a 5-year horizon Annual discount rate 1.5% Different scenarios were considered based on SORA discount rates (20%-90% discount rate) |
| 42 | Kobayashi et al.[75] | 2019 | Japan | uHCC | LEN vs. SORA | 0.23 (0.27 LYS) | -JPY406,307 (US$2,745.67) | JPY5,000,000 (US$33,788.1) | LEN is associated with cost savings vs. SORA and improved QALY | Data were extracted from the REFLECT trial Partitioned survival analysis with a lifetime horizon |
Results of comparative economic studies on first- or second-line therapies with placebo and/or BSC as the comparator
| # | Author | Year | Country | Indication | Treatments | QALYa | ICERb | WTPc | ICER/WTPd | Remarks |
| Second-line cabozantinib | ||||||||||
| 43 | Sieg et al.[76] | 2020 | Germany USA | aHCC second-line treatment | CABO vs. BSC | 0.15 (0.18 LYS) | US$375,470 (Germany) US$1,189,796 (US pricing) | US$163,371 (Germany) US$150,000 (USA) | 2.29 7.93 | Data extracted from the CELESTIAL trial Markov model with a lifetime horizon German statutory health insurance perspective compared with the US scenario and prices |
| 44 | Shlomai et al.[77] | 2019 | Israel | aHCC second-line treatment | CABO vs. placebo | 0.16 (0.22 LYS) | US$469,374 | US$230,000 | 2.04 | Data extracted from the CELESTIAL trial Markov model with a 5-year time horizon National health system perspective |
| 45 | Liao et al.[78] | 2019 | China | aHCC second-line treatment | CABO vs. placebo | 0.13 | US$833,497 (USA) US$304,177 (UK) US$156,437 (China) | US$150,000 (USA) US$76,671 (UK) US$26,481 (China) | 5.55 3.96 5.91 | Data extracted from the CELESTIAL trial Markov model with a 10-year horizon China, US and UK payors’ perspectives were used |
| 46 | Soto-Perez-de-Celis et al.[79] | 2019 | Brazil | aHCC second-line treatment | CABO vs. placebo | 0.067 | US$1,040,675 | US$100,000 | 10.41 | Data extracted from the CELESTIAL trial Decision-analytic model with 3 mutually exclusive health states US healthcare system’s perspective |
| Second-line regorafenib | ||||||||||
| 47 | Shlomai et al.[80] | 2018 | Israel | uHCC second-line treatment after SORA | REGO + BSC vs. placebo + BSC | 0.25 (0.38 LYS) | US$201,797-268,506 | US$150,000 | 1.34-1.79 | Data extracted from the RESORCE trial Markov model Annual discount rate 3% |
| 48 | Parikh et al.[81] | 2017 | USA | aHCC | REGO vs. BSC | 0.18 | US$224,362 | US$100,000 | 2.24 Reducing REGO price would increase acceptability | Data extracted from RESORCE trial Markov model US healthcare perspective |
| Second-line pembrolizumab | ||||||||||
| 49 | Chiang et al.[82] | 2021 | China | uHCC second line after SORA | PEM vs. placebo (both with BSC) | 0.138 | US$340,409 | US$150,000 NOTE: the authors used the US national WTP | 2.26 The model was sensitive to cost of PEM, OS, PFS, and health utility of placebo | Data extracted from the KEYNOTE-240 trial. Quality measures were extracted from a bladder cancer trial. Health utility measures of placebo were extracted from the RESORCE trial (regorafenib vs. placebo as second line therapy) Markov model with a lifetime horizon |
| Second-line ramucirumab | ||||||||||
| 50 | Zheng et al.[83] | 2019 | China | aHCC second- line treatment | RAMU vs. placebo in patients with AFP 400 ng/mL | 0.07 | US$782,104.57 | US$100,000 NOTE: the authors used a WTP threshold different than 3 times the per capita GDP | 7.82 | Data extracted from the REACH-2 trial Markov model and a 10-year horizon USA payors’ perspective |
| First-line sorafenib vs. placebo/BSC | ||||||||||
| 51 | Gupta et al.[84] | 2018 | India | aHCC | SORA vs. placebo | 0.19 (0.25 LYS) | US$7861 | Not reported | SORA cost-effectiveness is 4.2 higher than GDP | Data were extracted from the Asia-Pacific SORA trial Markov model with a lifetime horizon Societal perspective |
| 52 | Hamdy Elsisi et al.[85] | 2018 | Egypt | aHCC | SORA vs. placebo | 3.96 | US$286,776 | US$41,372 | 6.9 | Data extracted from the SHARP trial Markov model with a 4-year horizon |
| 53 | Parikh et al.[86] | 2017 | USA | aHCC8 (stageIII/ IV AJCC) | SORA vs. no treatment | 0.24 | US$224,914 | US$100,000 | 2.24 | Data were extracted from MEDICARE beneficiary’s dataset (SEER) Treated patients were matched with controls trough PSM Univariate and multivariate analyses were used to identify predictors of survival |
| 54 | Zhang et al.[87] | 2015 | China | aHCC | SORA vs. BSC | 0.18 | US$101,399.11 | US$20,301.00 | 4.99 Costs are sensitive to Child-Pugh status | Data extracted from medical records Markov model |
Summary of the risk bias evaluation of the 54 included studies according to the JBI[88]
| Item | Remarks |
| Is there a well-defined question? | In all included studies |
| Is there comprehensive description of alternatives? | Only studies with multiple comparators[59-67] - All included studies except for references [39,86,87] extracted data from previous phase II/III trials - References [29,86,87] used real-world data without comprehensive description of alternatives |
| Are all important and relevant costs and outcomes for each alternative identified? | In all included studies |
| Has clinical effectiveness been established? | In all included studies |
| Are costs and outcomes measured accurately? | In all included studies except for references [59,68] where ICERs were not clearly reported |
| Are costs and outcomes valued credibly? | In all studies except for references [40,62,58,68,70,71,82-84] - Studies [40,58,82,83] used higher WTPs than those recommended - Reference [62] used a lower WTP than what usually recommended - References [68,70,71,84] did not report any WTP |
| Are costs and outcomes adjusted for differential timing? | In all included studies |
| Is there an incremental analysis of costs and consequences? | In all studies except for references [59,68] |
| Were sensitivity analyses conducted to investigate uncertainty in estimates of cost or consequences? | In all included studies except for reference [68] |
| Do study results include all issues of concern to users? | Only in studies [37,50,84] |
| Are the results generalizable to the setting of interest in the review? | With caution - References [35,40-42,44-48,51-58,60-67,69,73,78,82,83,87] originate from or focus on the Chinese health market and may have a limited transferability to other international settings - References [45-48,52-56,61,65-67,69] included or focused on drugs that are currently limited to the Chinese healthcare market To assist in evaluation of current evidence, please refer to Supplementary Table 1 for a list of drugs approved in the Chinese (NMPA), US (FDA) and European (EMA) markets |
Summary of qualitative evaluations of included comparative economic studies on systemic therapies for HCC obtained from the ECOBIAS toolkit[89]
| Item | N (%) studies |
| Type of studies | |
| CEA/CUA* CBA | 54 (100) 0 (0) |
| Countries explored | |
| China (%) USA (%) China-USA (%) Taiwan (%) Canada (%) Japan (%) Israel (%) Germany-USA (%) Singapore (%) Thailand (%) Italy (%) France (%) China-USA-Europe (%) Australia (%) Egypt (%) India (%) Brazil (%) | 26 (48.1) 6 (11.1) 4 (7.4) 2 (3.7) 2 (3.7) 2 (3.7) 2 (1.8) 1 (1.8) 1 (1.8) 1 (1.8) 1 (1.8) 1 (1.8) 1 (1.8) 1 (1.8) 1 (1.8) 1 (1.8) 1 (1.8) |
| Data sourcing | |
| National/international registration trials Real-world | 51 (94.4)[34-38,40-85] 3 (5.6)[39,86,87] |
| Economic metrics | |
| Outcomes QALYs (%) LYS (%) ICER (%) ICUR (%) Alternative outcome measures (%) WTP (%) | 52 (96.3)[34-58,67,69-87] 15 (27.8)[40,41,43,46,50,58,60,66,67,70,75-77,80,84] 49 (90.7)[34-42,44-65,67-69,71-87] 2 (3.7)[43,70] 3 (5.5)[66,68,74] 50 (92.6%)[34-67,69,72-83,85-87] |
| Methodology | |
| Partitioned survival analysis (%) Markov model (%) Other/not clearly reported (%) Lifetime horizon (%) Defined horizon (%) Median (IQR) years | 28 (51.8)[34-36,38-41,43,47-50,53-58,60,63,64,66,67,69,70-72,75] 23 (42.6)[37,42,44-46,51,52,59,61,62,65,73,74,76-78,80-85,87] 3 (5.6)[68,79,86] 15 (27.8)[35,37,39,42,46-48,56,66,69,71,75,76,82,84] 21 (38.9)[34,36,38,40,41,49,50,53,55,58,60,61,63,65,70,72,74,77,78,83,85] 10 (9) |
| Perspective | |
| National/regional healthcare (%) Payor (%) Societal (%) Not clearly indicated (%) | 18 (33.3)[34,44,46-48,56,57,60,67,68,70-73,76,77,79,81] 9 (16.7)[41-43,45,49,65,78,83,85] 3 (5.5)[37,50,84] 24 (44.4)[35,36,38-40,51-55,58,59,61-64,66,69,74,75,80,82,86,87] |
Ethic issues
The current study was exempt from ethics committee review under Italian national regulations. This study was registered with the International Platform of Systematic Review and Meta-Analysis Protocols (INPLASY) at www.inplasy.com (#INPLASY2025100049; DOI: 10.37766/inplasy2025.10.0049).
RESULTS
Quantitative analysis
The article-sorting algorithm is illustrated in Figure 1. We began with 30,500 references retrieved from the databases using “cost of treatment for HCC” as the primary keyword combination. Of these, 842 (100%) were retained, and their abstracts were screened for potential alignment with the study framework’s objectives, based on general hints of economic considerations. Finally, 164 (19.5%) references were selected for full-text review because they included economic analyses.
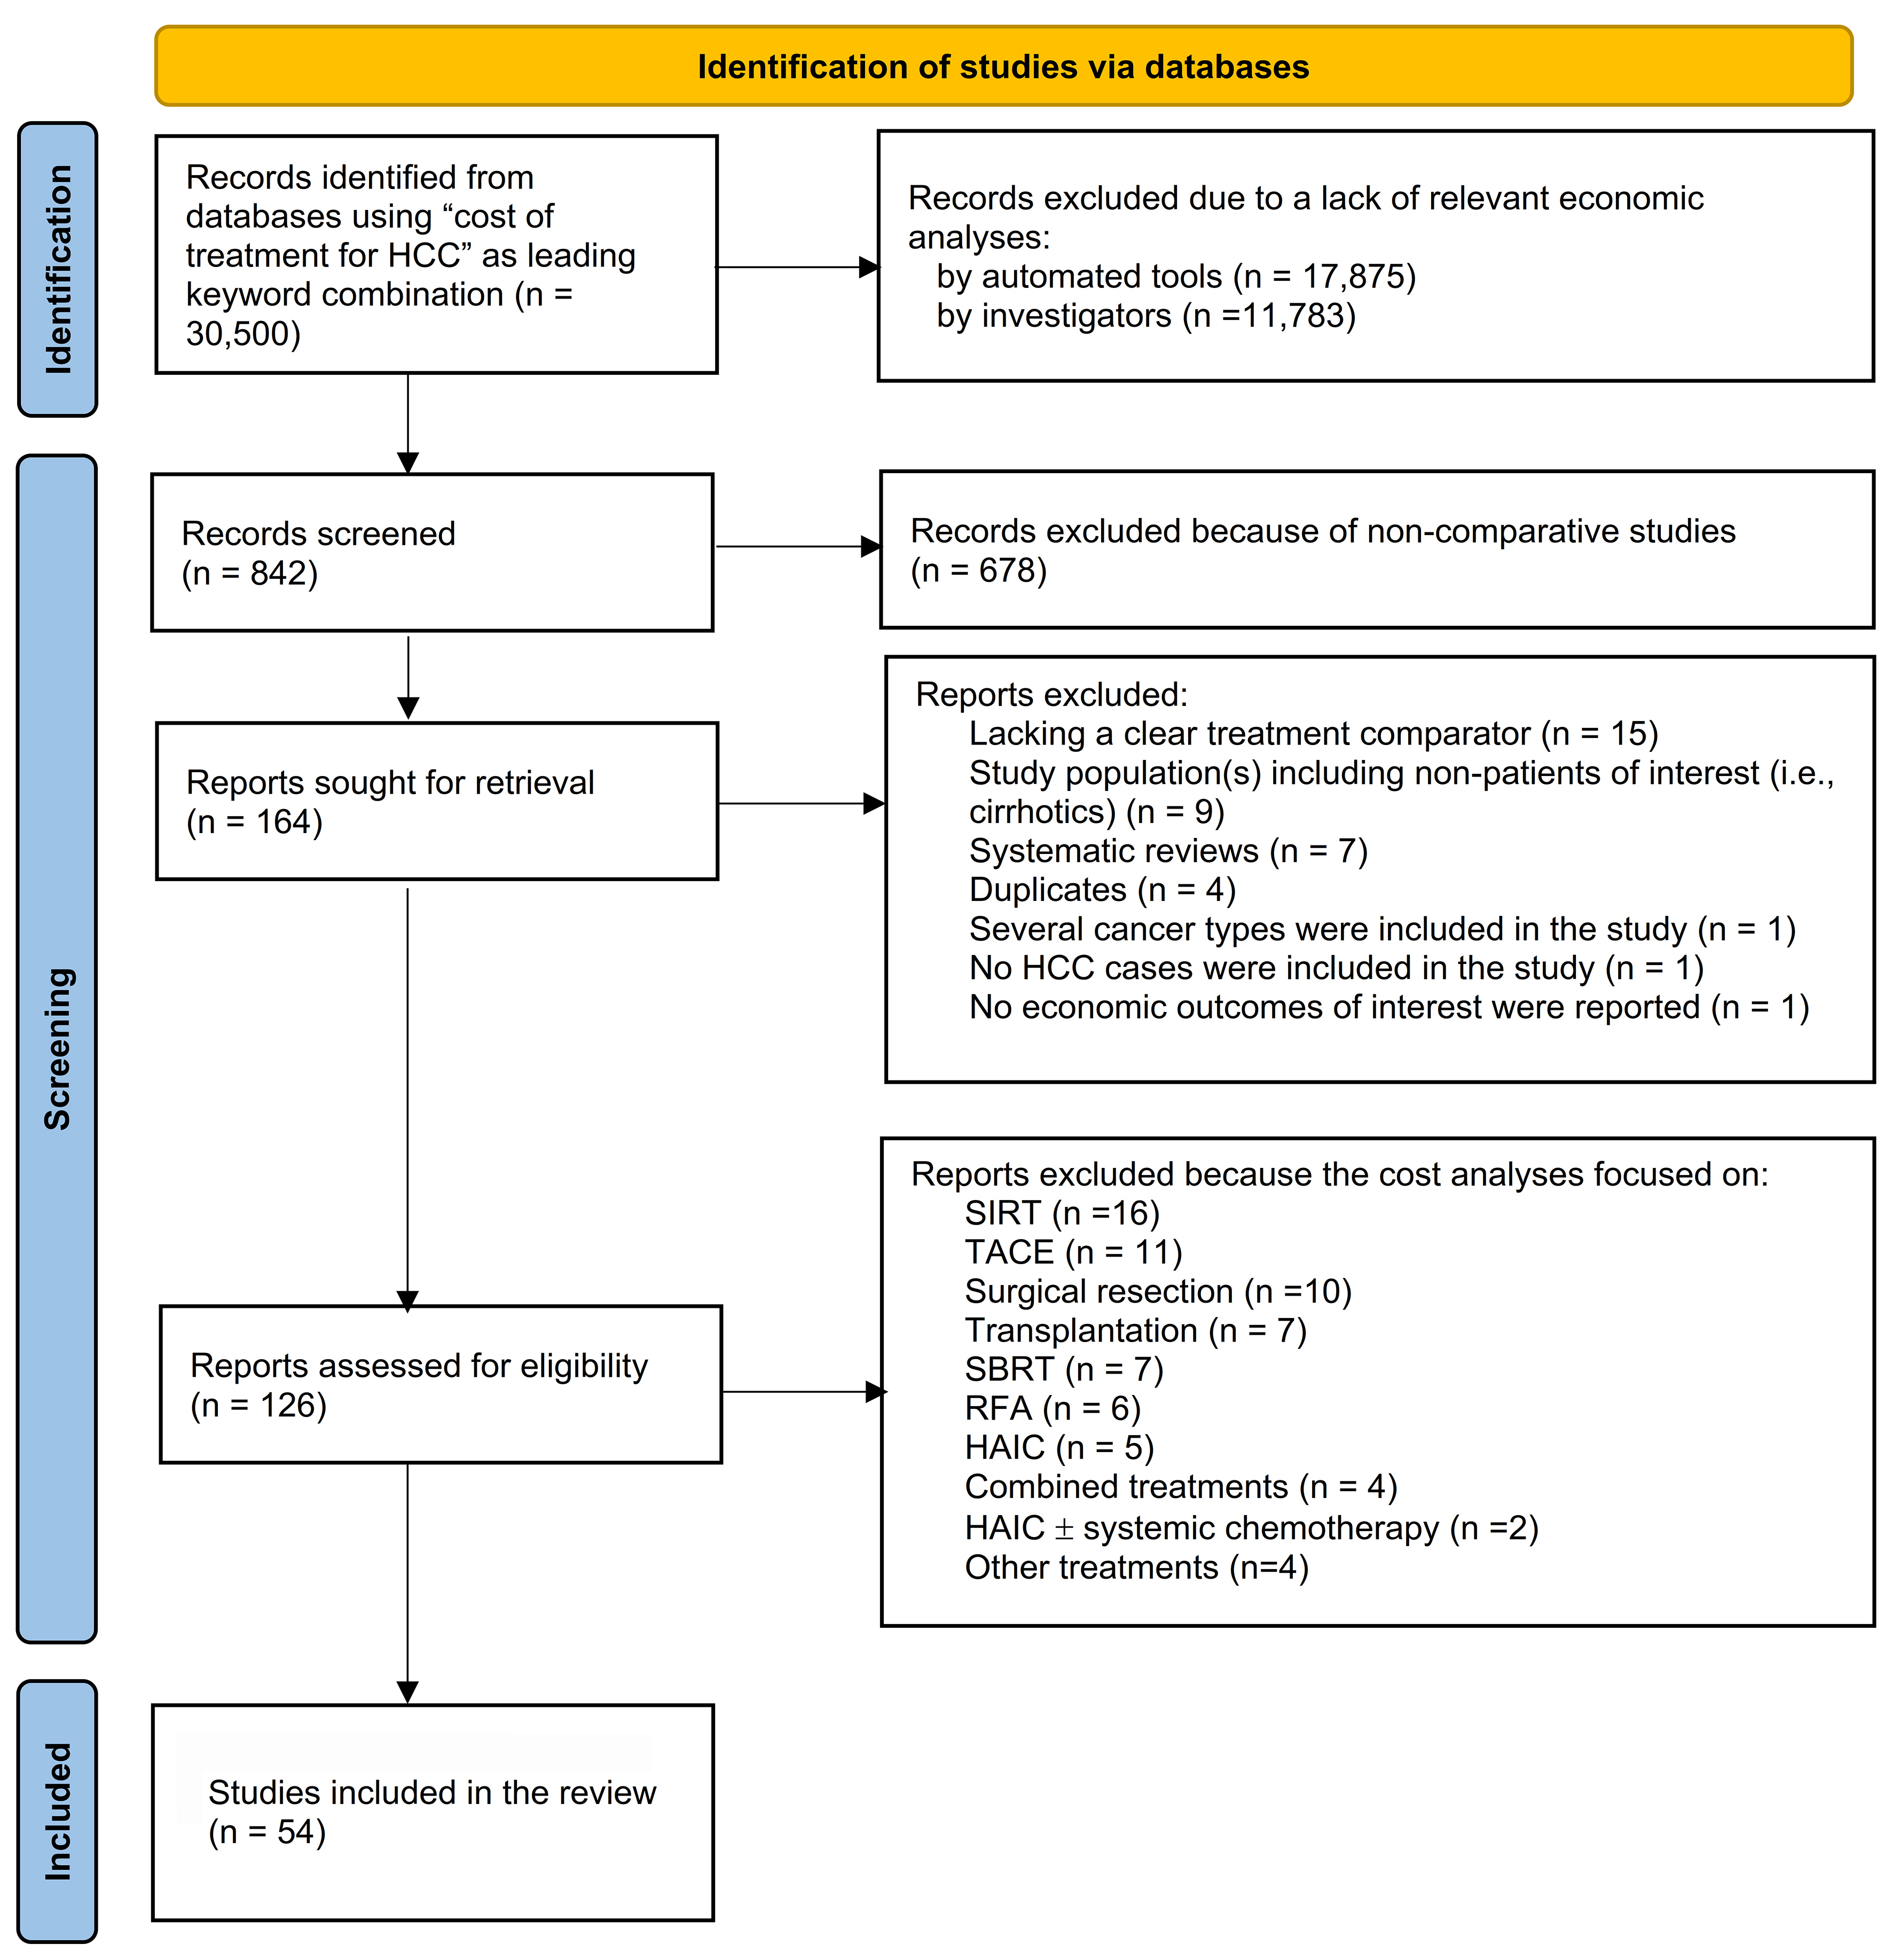
Figure 1. The literature references selection algorithm. HAIC: Hepatic artery infusion therapy; HCC: hepatocellular carcinoma; RFA: radiofrequency ablation; SBRT: stereotactic body radiation therapy; SIRT: selective internal radiation therapy; TACE: trans-arterial chemoembolization.
Of the 164 studies (100%), 38 (23.2%) were excluded: 15 (9.1%) lacked a clear treatment comparator, 9 (5.5%) involved non-patients of interest, 7 (4.3%) were systematic reviews, 4 (2.3%) were duplicates, and one each focused on several cancer types (0.6%), did not include HCC patients (0.6%), or lacked suitable economic outcomes (0.6%). Ultimately, 126 studies (76.8%) were comparative economic analyses consistent with the research framework.
Of these 126 (100%) studies, 72 (57.1%) were excluded because 16 (12.7%) focused on SIRT, 11 (8.7%) on TACE, 10 (7.9%) on surgical resection, 7 (5.6%) on transplantation, 7 (5.6%) on SBRT, 6 (4.8%) on RFA, 5 (3.4%) on HAIC, 4 (3.2%) on combination treatment, 4 (3.2%) on different treatment modalities, and 2 (1.6%) on HAIC ± systemic chemotherapy. Finally, 54 (42.8%) studies focused solely on systemic therapies and formed the core of this evaluation [Figure 1 and Tables 1-4][34-87].
Most of these studies examined the cost-effectiveness outcomes in China (26, 48.1%), six in the USA (11.1%), four in both China and the USA (7.4%), two in Taiwan (3.7%), two in Canada (3.7%), two in Japan (3.7%), two in Israel (3.7%), and one each in Germany and the USA (1.8%), Singapore (1.8%), Thailand (1.8%), Italy (1.8%), France (1.8%), China, USA, and Europe (1.8%), Australia (1.8%), Egypt (1.8%), India (1.8%), and Brazil (1.8%) [Tables 1-5, 7 and 8].
Owing to differences in study designs and drugs explored, we divided the retrieved comparative economic analyses into four categories: (1) head-to-head comparisons of ICIs as first-line therapy [usually against sorafenib (SORA)] as comparator [Table 1][34-58]; (2) studies that simultaneously compared multiple ICI- and oral-based regimens as first-line treatment [Table 2][59-68]; (3) studies on head-to-head comparison of oral agents only as first-line therapy [Table 3]; and (4) studies on first- or second-line therapies versus placebo and/or BSC [Table 4].
ICI as first-line therapy
A total of 25 studies were included in this category [Table 1][34-58]. Eleven studies focused on atezolizumab (ATE) [a programmed death-ligand 1 (PD-L1) inhibitor] + bevacizumab (BEVA) (a VEGF-A protein chain inhibitor)[34-44]; four studies examined sintilimab (SIN) + BEVA or BEVA biosimilar versus TKI/VEGFi [SORA in three cases, lenvatinib (LEN) in one][45-48]; three studies compared the single tremelimumab (TREM) and regular-interval durvalumab (DUR) (STRIDE regimen) versus SORA[49-51]; two studies evaluated a combination of camrelizumab (CAM) + rivoceranib (RIV) against SORA[52,53]; three studies assessed tislelizumab (TIS) versus SORA[54-56]; and two studies compared nivolumab (NIV) with SORA [Table 1][57,58].
ATE + BEVA
The comparator was SORA in 10 (90.9%) studies[34-39,41-44], and NIV in one (0.9%)[40]. All these studies based their economic analyses on the IMBrave-105 trial[90]. The analysis comparing ATE + BEVA vs. NIV also used data from the CheckMate-459 trial[91]. The studies were published between 2021 and 2025 and examined cost-effectiveness in China in four (36.4%), Taiwan in two (0.18%), and Thailand (0.9%), Singapore (0.9%), France (0.9%), the USA (0.9%), and both the USA and China (0.9%). The adjusted mean (SD) of ATE + BEVA QALYs was 0.70 ± 0.36, and the adjusted mean ± SD of LYS was 1.21 ± 0.11. The adjusted mean ± SD ICER/WTP ratio is 2.71 ± 3.07. Finally, ATE + BEVA was cost-effective (i.e., ICER/WTP < 1) compared to the comparator in four studies (three versus SORA and one versus NIV) [Table 1][36,38,39,40].
SIN + bevacizumab biosimilar
Four studies published between 2021 and 2023 examined the cost-effectiveness of SIN (a PD-1 receptor antagonist approved for HCC in China) in combination with BEVA or a BEVA biosimilar (IBI3015)[44-48]. All of these studies were conducted by Chinese authors, with SORA as the comparator in three studies and LEN in one study[44-48]. The studies derived data for analysis from previous trials, that is ORIENT-32[92], and REFLECT[93]. The adjusted mean ± SD of the SIN + BEVA biosimilar QALYs was 0.64 ± 0.42, and the reported LYS (measured in only one study) was 1.84. The adjusted mean ± SD ICER/WTP ratio is 1.06 ± 0.55. Finally, the SIN + BEVA biosimilar was cost-effective in three studies (two versus SORA, and one versus LEN) [Table 1].
STRIDE
The STRIDE regimen was studied in three research projects between 2023 and 2025, involving scholars from the US (2 cases) and China (one)[49-51]. All studies used data from the HIMALAYA trial[94]. One study also compared DUR monotherapy with STRIDE[50]. The mean ± SD adjusted QALY for STRIDE was 0.35 ± 0.19, and the reported LYS (measured in only one study) was 0.27. The mean ± SD adjusted ICER/WTP ratio was 0.42 ± 0.26, and STRIDE proved cost-effective across all included studies, regardless of the TKI/VEGFi comparator[49-51].
CAM + RIV
A regimen combining CAM (a PD-1 inhibitor approved in China) with RIV (a VEGF-2 inhibitor approved in China and pending approval in other countries) was studied in two research projects by Chinese scholars, one examining China’s healthcare system and the other exploring both the US and Chinese healthcare systems [Table 1][52,53]. Data were derived from the CARES-310 trial in both cases[95]. The adjusted mean ± SD QALY for CAM + RIV was 0.71 ± 0.08, and the adjusted mean ± SD ICER/WTP ratio was 0.71 ± 0.43. CAM + RIV was found to be cost-effective in both published studies[52,53].
TIS
A single-agent regimen with TIS, a PD-1 inhibitor, was compared with SORA in three studies conducted by Chinese researchers, examining cost-effectiveness in China (two publications) and across China, the USA, and Europe (one publication) [Table 1][54-56]. In all studies, data were derived from the RATIONALE-301 trial[96], and the comparator was SORA. The adjusted mean ± SD QALY for TIS was 0.46 ± 0.18, and the adjusted mean ± SD ICER/WTP ratio was 0.58 ± 0.27. The regimen was cost-effective in all studies and across all international scenarios [Table 1][54-56].
NIV
A single-agent regimen with NIV, a PD-1 inhibitor, was compared with SORA in two studies conducted between 2022 and 2023, both of which evaluated its cost-effectiveness in China[57,58]. Population data were obtained from the CheckMate-459 trial for each case[91]. Despite its improved clinical efficacy over SORA (i.e., adjusted mean ± SD QALY of 0.29 ± 0.03), NIV was not considered cost-effective in any of the studies (adjusted mean ± SD ICER/WTP ratio 3.83 ± 3.33) [Table 1][57,58].
Simultaneous comparison of multiple regimens
Ten studies examined multiple first-line regimens simultaneously against a common comparator, usually SORA [Table 2][59-68].
Sequencing treatments
In 2020, a US study examined eight different sequences of first- and second-line drugs using VEGFi and/or TKI agents [SORA, regorafenib (REGO), cabozantinib (CABO)], LEN, and ICIs [pembrolizumab (PEM), a PD-1 inhibitor, and NIV][59]. The sequences included SORA - REGO, SORA - CABO; SORA - NIV, SORA - PEM, LEN-REGO, CABO; LEN - LEN-NIV, and LEN-PEM [Table 2]. Data were obtained from randomized controlled trials (RCTs) of the respective drugs. Although utility outcomes (such as QALYs) were not available, the study indicated that a strategy of TKI/VEGFi followed by ICI upon disease progression is more cost-effective than using TKI/VEGF as both first- and second-line therapies[59]. The two most cost-effective regimens were SORA - PEM (ICER = US$227,741.03) and LEN - PEM (US$230,371.17). However, both regimens were above the WTP national threshold of 150,000 USD[59].
Multiple comparisons
Nine studies published between 2021 and 2024 compared multiple first-line regimens simultaneously[60-68]. Detailed information about the authors of the studies, publication years, national health systems examined, QALY/LYS, ICER, WTP, and ICER/WTP are shown in Table 2. Seven of these studies examined the cost-effectiveness of ICI- and TKI/VEGFi-based schedules together[60,62-65,67,68]; one focused only on TKI/VEGFi[66], and one included only ICI therapies[61]. Eight studies included SORA in their comparisons[60,62-68]. In one study, the most cost-effective regimens were donafenib (DONA)[67], a deuterium derivative of SORA approved for unresectable HCC in China in 2021[97,98]; DUR monotherapy[60]; SIN + BEVA biosimilar[61]; ATE + BEVA[62]; CAM + RIV[61]; LEN[62], and sunitinib (SUN) [Table 2][65].
Head-to-head comparison of oral agents
Seven studies published between 2019 and 2022 evaluated the cost-effectiveness of oral agents through direct comparisons [Table 3][69-75]. Six of these studies compared LEN to SORA[70-75], whereas only one Chinese study compared DONA to SORA[69]. In all cases, data were obtained from published trials, including the ZDGH-3 phase 2 and 3 studies[98], and the REFLECT trial[93].
Despite the increased QALY, a Chinese study reported that DONA was less cost-effective than SORA. However, its cost-effectiveness may increase in scenarios with a branded SORA formulation, lower DONA prices, and in high-income regions (ICER/WTP ratio of 0.42)[69].
All six studies on LEN demonstrated that this drug is a more cost-effective regimen than SORA[70-75]. In four of them, it was dominant over the comparator due to lower costs and higher utility (QALY) [Table 3][70,71,74,75].
First and second-line therapies versus placebo and/or BSC
A total of 12 studies were included in the final analysis [Table 4][76-87]. Four analyses focused on CABO versus placebo/BSC after failure of first-line TKI/VEGFi therapy, using the CELESTIAL trial as the source dataset[99]. Two studies[80,81] involved REGO and were based on the RESORCE trial[100]. Two studies, each focusing on PEM[82] and ramucirumab (RAMU)[83], were based on the KEYNOTE-240[101] and REACH-2 trials[102], respectively.
Four studies examined the cost-effectiveness of SORA compared to placebo/BSC as a first-line therapy[84-87]. Two studies[84,85] sourced data from the SHARP trial or from its Asia-Pacific population[103]. One study extracted data from the Surveillance and End Results (SEER) Medicare database[86], whereas one Chinese study used medical records[87]. None of the studies demonstrated the cost-effectiveness of the research or active comparators. Detailed information on the study type, year of publication, country of origin, active treatment, QALYs, ICER, and ICER/WTP is reported in Table 4.
Overall
Among the 54 included studies, 35 regimen comparisons were reported: 23 first-line (15 ICI-containing schedules and 8 TKI/VEGFi-based regimens), 4 second-line, and 8 sequencing treatments [Tables 1-4 and 7]. Eighteen active regimens were explored in China, 17 in the USA, and 5 in Europe, while other national markets were only minimally represented [Tables 1-4 and 6-8].
A total of 14 (40.0%) active treatments were shown to be cost-effective. ICI-containing regimens were more frequently cost-effective than other systemic therapies [Tables 1-4 and 8]. Specifically, ATE + BEVA was cost-effective in five studies[36,38-40,62], SIN + BEVA/BEVA biosimilar in four[46-48,61], STRIDE in three[49-51], CAM + RIV in three[52,53,61], TIS in three[54-56], and DUR monotherapy in one[60]. Among oral agents (i.e., TKI/VEGFi), LEN was cost-effective in seven studies[62,70-75], while DONA and SUN were cost-effective in one study each[65,67]. SORA was not cost-effective when compared with active comparators or BSC/placebo. The only exception was when a generic SORA formulation was compared with DONA due to the latter’s higher price[69]. The sequencing treatments SORA + PEM and LEN + PEM were cost-effective in one study of patients who failed initial therapy with oral agents[59].
Qualitative analysis
All 54 studies were initially assessed for eligibility and risk of bias using the JBI assessment grid, which includes 11 items[88]. The detailed reports of these studies are shown in Table 5. Due to the large number of included studies, responses to the 11 items of the JBI are summarized collectively. Three qualitative items were poorly addressed across the included studies: (1) the comprehensive description of available therapeutic options; (2) the credibility of economic metrics; and (3) the transferability of results. No study evaluated all therapeutic regimens currently available in a specific health market. Cost-effectiveness metrics were not credibly reported in five studies: in four cases, WTPs exceeded those recommended by the WHO[40,58,82,83], and in one case, WTP was lower than that based on national GDP[62]. Four studies did not report any WTP[68,70,71,84]. The transferability of results should be interpreted cautiously for studies exploring only the Chinese market (26 studies) or the Chinese market in combination with the USA (4 studies) or the USA and Europe (1 study), given the different dynamics of drug reimbursement policies [Tables 5-8]. Finally, 14 studies focused on or included drugs and regimens currently approved only in the Chinese market [Tables 5-8]. The Supplementary Table 1 provides a complete list of systemic treatments approved in China, the USA, and Europe at the time of publication.
Summary of treatments examined in the current systematic review
| Treatments* | N (%) studies | |
| First-line | ||
| Immunotherapy | ATE + BEVA versus SORA ATE + BEVA with multiple comparators ATE + BEVA versus NIV SIN + BEVAb versus SORA SIN + BEVAb with multiple comparators SIN + BEVAb versus LEN STRIDE versus SORA STRIDE with multiple comparators DUR versus SORA CAM + RIV versus SORA CAM + RIV with multiple comparators PEM + LEN with multiple comparators TIS versus SORA NIV versus SORA | 17 (31.5)[34-39,41-44,60,62-68] 1 (1.8)[61] 1 (1.8)[40] 8 (14.8)[45,46,48,62-67] 1 (1.8)[61] 1 (1.8)[47] 4 (7.4)[49-51,60] 1 (1.8)[61] 2 (3.7)[50,60] 2 (3.7)[52,53] 1 (1.8)[61] 1 (1.8)[61] 3 (5.6)[54-56] 3 (5.6)[57,58,62] |
| TKI/VEGFi | SORA versus BSC/placebo LEN versus SORA DONA versus SORA DONA versus LEN SUN versus SORA LIN versus SORA BRIVA versus SORA SORA + ERL versus SORA | 4 (7.4)[84-87] 12 (22.2)[60,62,64-68,70-75] 5 (9.2)[62,65-67,69] 1 (1.8)[66] 1 (1.8)[65] 1 (1.8)[65] 1 (1.8)[65] 1 (1.8)[65] |
| Second-line | ||
| CABO versus BSC/placebo REGO versus BSC/placebo PEM versus BSC/placebo RAMU versus BSC/placebo | 4 (7.4)[76-79] 2 (3.7)[80,81] 1 (1.8)[82] 1 (1.8)[83] | |
| Sequencing treatments | ||
| REGO after SORA CABO after SORA NIV after SORA PEM after SORA REGO after SORA CABO after LEN NIV after LEN PEM after LEN | 1 (1.8)[59] 1 (1.8)[59] 1 (1.8)[59] 1 (1.8)[59] 1 (1.8)[59] 1 (1.8)[59] 1 (1.8)[59] 1 (1.8)[59] | |
| Active treatment by country/region explored** | ||
| ASIA | China = 18 active treatments ATE + BEVA SIN + BEVAb STRIDE DUR CAM + RIV TIS NIV LEN PEM + LEN DONA SUN SORA + ERL LIN BRIVA CABO PEM RAMU SORA Japan = 2 active treatments LEN Taiwan = 1 active treatment ATE + BEVA Hong Kong = 1 active treatment ATE + BEVA Singapore = 1 active treatment ATE + BEVA Thailand = 1 active treatment ATE + BEVA India = 1 active treatment SORA | 11 (20.4)[35,40,41,44,60-65,67] 10 (18.5)[45-48,61-65,67] 3 (5.6)[51,60,61] 1 (1.8)[60] 2 (3.7)[52,53] 4 (25.9)[54-56,61] 2 (3.7)[57,58] 12 (22.2)[60,62,64-67,70-75] 1 (1.8)[61] 5 (9.2)[62,65-67,69] 1 (1.8)[65] 1 (1.8)[65] 1 (1.8)[65] 1 (1.8)[65] 1 (1.8)[78] 1 (1.8)[82] 1 (1.8)[83] 1 (1.8)[87] 2 (3.7)[71,75] 2 (3.7)[34,38] 1 (1.8)[42] 1 (1.8)[36] 1 (1.8)[37] 1 (1.8)[84] |
| Asia-Pacific | Australia = 1 active treatment LEN | 1 (1.8)[72] |
| North America | USA = 17 active treatments ATE + BEVA NIV STRIDE DUR TIS LEN SORA-REGO SORA-CABO SORA-NIV SORA-PEN LEN-REGO LEN-CABO LEN-NIV LEN-PEM CABO REGO SORA Canada LEN | 3 (5.6)[35,43,62] 1 (1.8)[62] 2 (3.7)[49,50] 1 (1.8)[50] 1 (1.8)[54] 1 (1.8)[62] 1 (1.8)[59] 1 (1.8)[59] 1 (1.8)[59] 1 (1.8)[59] 1 (1.8)[59] 1 (1.8)[59] 1 (1.8)[59] 1 (1.8)[59] 1 (1.8)[76] 1 (1.8)[81] 1 (1.8)[86] 2 (3.7)[70,74] |
| Middle East | Israel = 2 active treatments CABO REGO | 1 (1.8)[77] 1 (1.8)[80] |
| Africa | Egypt = 1 active treatment SORA | 1 (1.8)[85] |
| Europe | Europe = 1 active treatment TIS France = 1 active treatment ATE + BEVA Italy = 2 active treatments ATE + BEVA LEN Germany = 1 active treatment CABO | 1 (1.8)[54] 1 (1.8)[39] 1 (1.8)[68] 1 (1.8)[68] 1 (1.8)[76] |
| South America | Brazil = 1 active treatment CABO | 1 (1.8)[79] |
Summary of cost-effective treatments based on the results of the systematic review
| Treatments* | N (%) studies | Countries explored |
| First-line | ||
| Immunotherapy | ||
| ATE + BEVA vs. SORA | 5 (9.2)[36,38,39,62] | China (1), Singapore (1), Taiwan (1), USA (1), France (1) |
| ATE + BEVA vs. NIV | 1 (1.8)[40] | China (1) |
| SIN + BEVAb vs. SORA | 3 (5.6)[46,47,48] | China (3) |
| SIN + BEVAb vs. multiple comparators | 1 (1.8)[61] | China (1) |
| STRIDE vs. SORA | 3 (5.6)[49,50,51] | USA (2), China (1) |
| CAM + RIV vs. SORA | 2 (3.7)[52,53] | China (2), USA (1) (study #53 explored both the Chinese and the US market) |
| CAM + RIV vs. multiple comparators | 1 (1.8)[61] | China (1) |
| TIS vs. SORA | 3 (5.6)[54,55,56] | China (3), USA (1), Europe (1) (study #54 explored China, USA, and Europe) |
| DUR vs. SORA | 1 (1.8)[60] | China (1), USA (1) (study #60 explored both China and USA) |
| TKI/VEGFi | ||
| LEN vs. SORA | 7 (12.9)[62,70,71,72,73,74,75] | China (3), USA (1), Canada (2), Japan (2), Australia (1) (study #62 explored both China and USA) |
| DONA vs. SORA | 1 (1.8)[67] | China (1) |
| SUN vs. multiple comparators | 1 (1.8)[65] | China (1) |
| Sequencing treatments | ||
| SORA-PEM | 1 (1.8)[59] | USA (1) |
| LEN-PEM | 1 (1.8)[59] | USA (1) |
Further assessments were performed using the ECOBIAS checklist[89], as shown in Table 6. Metrics of utility, such as QALYs, were reported in nearly all included studies (52 = 96.3%), whereas effectiveness measures, such as LYS, were reported in 15 (27.8%) studies [Table 6]. ICERs were reported in 49 (90.7%) studies, with 2 (3.7%) using ICURs[43,70]. Three studies (5.5%) employed alternative outcome measures such as cost savings or ICER per month of PFS[66,68,74]. WTPs were documented in all studies except 4 (92.6%)[68,70,71,84]. Notably, no CBA has been reported in the international literature on systemic therapies for advanced HCC during the study period.
Almost all studies collected data from published trials on systemic therapies or from network meta-analyses of published trials (51/54, 94.4%)[90-103]. This limited the ability to accurately count patients included in the review, owing to the risk of double-counting participants from the trials used for cost-comparative assessments. Real-world data were only available from a study in France on ATE + BEVA[39], a survey of SORA from the USA using SEER program (https://seer.cancer.gov/registries/)[86], and a study from China comparing SORA to placebo/BSC[87]. Most studies (28/54, 51.8%) used a partitioned survival model, which included PFS, progressive disease (PD), and death, to estimate cost-effectiveness [Tables 1-4]. Twenty-three studies (42.6%) employed a Markov state-transition model, one (1.8%) used a decision analytic approach[79], one combined propensity score matching with univariate and multivariate survival analysis[86], and one (1.8%) did not clearly specify the methodology for calculating transitions across health states for patients on systemic therapy [Tables 1-4][68]. A lifetime horizon was used to estimate the costs of the therapies in 15 studies (27.8%) [Tables 1-6]. In 21 studies (38.9%), the median [interquartile range (IQR)] timeframe was 10 (9) years [Tables 5 and 6]. However, this was not clearly specified in the remaining 18 studies (33.3%) [Tables 1-4].
A national or regional healthcare system perspective was used in 18 studies (33.3%). A payor’s perspective was employed in nine studies (16.7%), whereas a societal perspective was adopted in three studies (5.5%). It was not clearly specified in 24 studies (44.4%) [Tables 1-6].
Tables 7 and 8 provide details on the types and numbers of treatments explored, as well as their distribution across countries. While the overall number of treatments differs only slightly between China and the USA, more treatments were investigated more than once in China [Table 7]. In Chinese studies, among 18 treatments/regimens, LEN was investigated 12 times; ATE + BEVA, 11 times; SIN + BEVA biosimilar, 10 times; DONA, 5 times; and TIS, 4 times. Further treatments were investigated 3 times [Table 7]. Of the 17 treatments investigated in US papers, the most frequently explored were ATE + BEVA (3 times)[35,43,62]; and STRIDE (2 times)[49,50]. In Europe, only 5 treatments were explored, with ATE + BEVA being the most frequently investigated regimen (2 times)[39,68].
DISCUSSION
Although effectiveness is the primary outcome measure for any new therapy, CEAs are crucial for informed decision-making. This is especially true when multiple therapies are available for a specific disease or when several options emerge within a short period[104]. This situation applies to HCC, for which treatment options have expanded since 2008 with the introduction of systemic therapies[90-103]. The primary goal of CEAs is to identify strategies that maximize health benefits with available resources or improve the value of money[104]. In recent years, the number of cost-effectiveness publications related to HCC has increased[34-87]. This trend mirrors the growing number of publications on the cost-effectiveness of treatment options for stroke, neurological diseases, and cardiovascular conditions[104]. However, the implications and limitations of this field remain poorly understood by clinicians[105].
Systemic therapies are transforming the care of patients with HCC[13], and they are increasingly used in clinical practice not only as first- or second-line treatments but also in combination with radiology-assisted techniques, surgery, and LT[14]. The current arsenal of systemic therapies includes various drug categories, ranging from oral agents (typically TKIs and VEGFi) to ICIs[13]. Within each category, differences exist in target molecular mechanisms, pharmacodynamics, pharmacokinetic properties, routes of administration, and side effects[13]. These characteristics affect not only the drug’s effectiveness but also its clinical utility and economic burden.
To assess the cost-effectiveness of systemic therapies for HCC, we conducted a systematic review covering the past decade. Following the PRISMA framework, we used a narrative approach to summarize the findings because international studies varied greatly in research methods, data sources, time horizons, sensitivity analyses, case-scenario simulations, perspectives, and the countries studied [Tables 1-6][21,22,34-87].
Main findings
First-line regimens
Overall, the main finding of our review was that 14 (40.0%) of the 35 treatments compared in the literature demonstrated some degree of cost-effectiveness, with only a third of the included studies (18/54) reporting it [Tables 1-4, 7 and 8]. These treatments included 9 first-line ICI-containing regimens, 3 first-line TKI/VEGFi schedules, and 2 sequencing treatments [Table 8]. Among first-line treatments, ICI-containing regimens were more often cost-effective than other active drug regimens[34-87], and LEN outperformed SORA more frequently than the other targeted oral agents (i.e., DONA, SUN). These results align with the superior clinical effectiveness of these regimens in phase II and III trials [Tables 1-4, 7 and 8].
Finally, despite its widespread use until the introduction of LEN and/or ICI-containing regimens, SORA was not proven to be cost-effective compared to placebo or BSC[84-87]. However, no study has evaluated the ICER of generic SORA formulations introduced into clinical practice over the past few years. The lack of these studies is likely due to SORA’s inferior clinical effectiveness compared to more recent LEN and/or ICIs.
Second-line regimens
Second-line therapies after the failure of initial oral agents have not shown cost-effectiveness for any of the drugs studied (CABO, REGO, PEM, and RAM) when compared to placebo or BSC[76-83]. This is because the limited improvements in OS and PFS do not justify the high costs of these medications. Only one US study evaluated the cost-effectiveness of eight treatment sequences involving both first- and second-line agents[59]. Despite limitations from a multiple-comparator analysis using data from randomized clinical trials of six different agents, the study found that two combinations were cost-effective: SORA-PEM and LEN-PEM[59]. However, these results should be revisited given the proven superiority of ICIs over SORA as first-line options.
Overall, these findings from comparative economic analyses of first- and second-line agents/regimens do not conflict with clinical data but instead underscore the economic burden of introducing new drugs into the healthcare market. Drug prices were the main cost factor in all the included studies, and strategies to reduce these costs may lower the value of ICERs and enhance the ICER/WTP ratios[42,43,70,71,74,75,81,82].
Limitations
Geographical distribution
An important finding of this research is that most studies were conducted by Chinese authors or focused on the Chinese medical market[34-87]. Overall, 48.1% (26/54) of the papers examined only the Chinese market, 4 (7.4%) combined China and the USA, and one (1.8%) investigated the Chinese, US, and European markets. This is due to the epidemiological importance of HCC in China, as well as the fact that more first- and second-line agents have been approved for use in China than in other countries or regions [Supplementary Table 1]. To our knowledge, 14 drugs or treatment regimens have been approved for advanced HCC in China as of the publication of this paper, and at least nine targeted agents or combination regimens were recommended by experts in 2024, including SORA, LEN, DONA, ATE + BEVA, SIN + BEVA/BEVA biosimilar, and second-line options such as REGO, CABO, and apatinib.
However, this apparent dominance decreased when comparing the number of treatments studied across different countries or regions, especially for China and the USA [Table 7]. Despite having more publications, the number of regimens examined was nearly the same in Chinese papers (n = 18) and studies from the USA (n = 17) [Tables 1-4 and 7]. Topic redundancy was observed among Chinese researchers, who studied LEN in 12 publications, ATE + BEVA in 11, SIN + BEVA biosimilar in 10, DONA in 5, and TIS in 3 [Table 7]. A clear reason for this redundancy is hard to determine but may be linked to publication pressure on Chinese researchers, the size of China’s healthcare market, the epidemiology of HCC in China[106], the complex economic factors across different Chinese regions, and the requirements for obtaining marketing approval from Chinese authorities. Lastly, various Chinese pharmaceutical companies have developed and produced a significant portion of systemic drugs for HCC, including CAM, RIV, SIN, various BEVA biosimilars, and DONA, and they obtained marketing approval earlier than in other countries [Supplementary Table 1].
This geographical imbalance in the literature on systemic treatments for HCC calls for caution when applying the review’s conclusions to countries outside China and Asia. Macroeconomic factors (such as national GDPs, WTPs, drug reimbursement policies, patient co-payments, drug pricing, discount rates, manufacturer competition, regulation of generic versus brand-name products, etc.) and microeconomic elements (like access to care and medications, patients’ social status, neighborhood deprivation, availability of family support or caregivers, etc.) are not always clearly included in comparative economic analyses and continue to affect the benefits and usefulness of systemic drug treatments for advanced HCC.
Methodology of included studies
Several key issues were identified across the studies included in this review, as shown in Tables 5 and 6. Only a small number of studies addressed multiple comparators[59-67], and only a few were based on real-world data[29,86,87]. This is because nearly all studies relied on phase II/III trials[90-103], with limited use of post-registration clinical evidence. With the notable exception of SORA, which was approved for use in the USA, Europe, and China between 2007 and 2008, and oxaliplatin-containing regimens approved in China in 2013, all other systemic agents have been approved more recently, from 2017 onward [Supplementary Table 1][106,107].
Post-registration, clinically focused economic analyses are crucial for better linking evidence to real-world practice. This is because initial drug prices typically decrease over time due to annual discounts, contracting, and competition from new therapies. Additionally, as treatments evolve, approved indications often expand to include patient groups not covered in registration trials[90-103]. Patient selection in randomized clinical trials is usually stricter than in real-world settings, and exclusion criteria - such as bleeding, ascites, and liver decompensation - remain relevant for many patients needing treatment, especially considering their shorter lifespan[90-103]. Finally, issues like temporary drug withdrawal, dose adjustments due to adverse events, and the use of surgery, radiological procedures, or switching drugs are not addressed in the original trials used for marketing authorization. Therefore, it is not surprising that the societal perspective was considered in only a small percentage of the included studies (5.5%), and that issues of concern to patients (e.g., access to care, work disability, loss of income, etc.) were overlooked in the current review.
Review sufficiency
We acknowledge that, since our review relies on the published literature, it may not encompass all relevant economic analyses on the topic. First, financial information on HCC treatments may be shared not only through scientific publications but also via manufacturers’ reports, drug leaflets, digital media coverage, and administrative sources. Additionally, economic evaluations of systemic drug treatments might have been communicated only to hospital administrators and/or policymakers, rather than being included in peer-reviewed reports or publications. Furthermore, adjustments are often needed in health economic studies to account for inflation, disparities in resource allocation methods, and differences in pricing and reimbursement policies [such as disease-related group (DRG) tariffs, co-pays, and out-of-pocket systems]. These adjustments are not always reflected in scientific reports and often require experience with a specific national or regional market to incorporate them into comparative economic analyses. Finally, elements of current economic instability - such as increased tariffs on exports to the USA and reduced availability of components from manufacturing countries - can undermine the reliability of analyses and forecasts.
Results transferability
The transferability of the results of this review should therefore be interpreted with caution and considered within the context of each national or regional setting where systemic drugs for advanced HCC are used. Aside from the geographical differences and the methodological limitations previously mentioned, the ultimate cost-effectiveness of systemic treatments depends on the ICER/WTP ratio. The WHO guidelines recommend that the national WTP be set at a level aligned with per capita GDP, ranging from 1 to 3 times that amount[33]. Since GDPs vary across and within countries, ICER/WTP ratios differ between studies and over time. Furthermore, although ICER/WTP measures access to treatment in a specific scenario, it often does not fully reflect true cost-effectiveness. National or regional health authorities and administrators may override this ratio for treatments with proven clinical importance, such as those for malignancies or rare diseases, especially when effective options are limited. Policymakers and stakeholders might also implement policies that reallocate financial resources from less effective treatments to more costly ones, thereby increasing access for underserved populations.
Interestingly, the method commonly used to evaluate the cost-effectiveness of systemic therapies for advanced HCC in this review relies on direct comparisons between treatment regimens or schedules, such as ICI-containing regimens versus VEGFi. In nearly all included studies, SORA was used as the standard control against the experimental treatment arm(s). Although this reflects the design of the registration trials used for comparative economic calculations, real-world data suggest a shift from SORA to LEN, a decrease in the use of oral agents as first-line therapies following the advent of ICIs, and an increase in their use as second-line treatments for patients with limited tumor progression[108,109].
Finally, the comparative approach used in the reviewed papers faces challenges due to the increasing adoption of combination strategies in clinical practice for the treatment of advanced HCC[14,108,109]. While systemic therapies were initially viewed as alternatives for patients with advanced tumors who were ineligible for surgery (including resection and LT) or radiology-guided procedures, the current clinical landscape shows a growing use of combination approaches. These include systemic therapies, such as neo-adjuvant or adjuvant treatments, or bridging modalities to enhance surgical or radiological outcomes[108,109]. One example of these innovative approaches is the recent approval by Chinese authorities of PEM in combination with LEN and TACE, emphasizing the need for appropriate methodologies to evaluate their cost-effectiveness in real-world settings.
How can the cost-effectiveness of systemic therapies be improved?
Building on the analysis of accessible comparative economic data, the secondary goal of this review was to raise awareness of strategies to enhance the cost-effectiveness of systemic therapies for advanced HCC. These strategies are shown in Table 9 and are based on Bronfenbrenner’s ecological systems theory[110], which suggests that implementing interventions should involve three levels: the micro-level (the healthcare provider-patient dyad), the meso-level (healthcare organizations), and the macro-level (administrators, policymakers, stakeholders, and society at large). These initiatives should engage all participants involved in caring for patients with advanced HCC, including patients, healthcare providers, healthcare organizations, administrators, policymakers, stakeholders, and scientific societies, and should develop suitable methods to address the complexities of caring for advanced HCC patients.
A list of suggested initiatives to increase the cost-effectiveness of systemic therapies for advanced HCC
| Level | Initiative(s) | Expected outcome(s) |
| Micro (patient-healthcare provider interaction) | - Integration of multidisciplinary competencies/teams in clinical settings - Education/training of healthcare professionals on systemic therapies with special consideration to ICI-containing schedules and combination approaches - Close monitoring of patients’ adverse effects, well-being, quality of life by integration of remote assistance approaches whenever possible - Empowerment of patients and family care givers to increase awareness, preparation and self-management - Prompt treatment of adverse effects - Regular follow-up visits | - Improvement of treatment effectiveness - Reduction of patients’ non-adherence - Reduction/mitigation of drug-related adverse effects - Improvement of patients’ QoL - Improvement of patients’ access to care - Reduction of the economic burden related to the incidence of adverse events, ancillary treatments and referrals - Reduction of physical and work disability - Improvement of LYSs, QALYs and ICERs |
| Meso (healthcare organizations) | - Appointment of multidisciplinary teams for the treatment of HCC - Facilitation of competency integration into clinical practice - Facilitation of clinical data collection - Facilitation of interventional pharmacoeconomics, i.e., structured efficiency models to optimize treatment dosages, exposures, and durations - Implementation of real-world clinical studies - Implementation of care pathways within and across healthcare institutions to facilitate patient access to care - Care givers and stakeholders’ involvement in the decision-making process | - Improvement of treatment appropriateness - Reduction of unnecessary treatments - Improvement of drug-related side effects management - Integration of individual and societal concerns into clinical data collection |
| Macro (administrators, policy makers, stakeholders) | - Promotion of generic and biosimilar substitution - Shifting of reimbursement models from volume-based to outcome-based strategies - Facilitation of HTA models for advanced HCC - International referencing pricing, i.e., comparing international prices to adjust costs at regional/national levels - Implementation of publicly funded clinical trials to assess cost-effectiveness in real-world settings - Increase administrative efficiency to reduce overhead costs associated with drug contracting - Reduced approval timelines to accelerate drug marketing - Resource shifting according to disease epidemiology - Facilitation of public discourse on the economic metrics to be adopted for treatment of advanced HCC - Involvement of scientific societies and key opinion leaders in designing economic models to capture the economic metrics of cancer treatments | - Reduction of drug prices - Increase of annual drug discount rates - Cost savings from reorganization of administrative models supporting drug delivery - Introduction of more reliable economic metrics to capture the complexities of cancer treatments |
In conclusion, our systematic review highlights significant variability in comparative economic analyses of systemic therapies for HCC across and within national and international settings. These differences mainly arise from study methodologies, time horizons, drug costs, and the perspectives used (such as societal versus healthcare systems), rather than from the sources of the datasets. However, based on current evidence, ICIs tend to be more cost-effective as first-line agents than any other active comparators studied. Among the oral agents, LEN is more cost-effective than SORA, and both SORA-PEM and LEN-PEM appear to be the most cost-effective sequencing strategies in the single study investigating these drug sequences. Changes in clinical practice, driven by the expansion of systemic therapies beyond their original indications and their combination with radiology-assisted techniques or surgery, necessitate aligning the methodologies of future studies with economic evaluations. A standardized approach to cost-effectiveness research, along with regular updates, is therefore essential given the rapidly evolving clinical landscape and the need to offer patients the highest standard of care.
DECLARATIONS
Acknowledgments
The authors owe a deep debt of gratitude to the administrative staff of the Department of Surgical, Medical, Biomolecular Pathology and Intensive Care, University of Pisa, Pisa, Italy.
Authors’ contributions
Conceived the study: De Simone P, Campani D, Vistoli F
Developed the research strings: Ducci J, Romano L, Longo D
Evaluated the abstracts: Longo D, De Simone P, Peritore D
Collected the full-length papers and extracted the data: Longo D, Peritore D, Romano L, Ducci J
Drafted the manuscript: De Simone P, Longo D
Assessed the manuscript and addressed critical issues: Giuliani A, Vistoli F
All authors read and approved the final manuscript.
Availability of data and materials
The papers included in this analysis, along with their evaluation of inclusion and exclusion criteria, were stored on the Ryyan platform. Individual credentials secure access to data. Data will be made available upon request.
AI and AI-assisted tools statement
During the preparation of this manuscript, the AI tools Rayyan and Grammarly were used solely for literature screening/management and language editing, respectively. These tools did not influence the study design, data collection, analysis, interpretation, or the scientific content of the work. All authors take full responsibility for the accuracy, integrity, and final content of the manuscript.
Financial support and sponsorship
None.
Conflicts of interest
De Simone P is an Editorial Board Member of Hepatoma Research. De Simone P was not involved in any stage of the editorial process, including reviewer selection, manuscript handling, or decision-making. The other authors declared that there are no conflicts of interest.
Ethical approval and consent to participate
Not applicable.
Consent for publication
Not applicable.
Copyright
© The Author(s) 2026.
Supplementary Materials
REFERENCES
1. Skill NJ, Butler J, O’Brien’ DC, et al. Financial burden of liver transplant vs resection for hepatocellular carcinoma. Transplant Proc. 2019;51:1907-12.
2. Rupp T, Zuckerman D. Quality of life, overall survival, and costs of cancer drugs approved based on surrogate endpoints. JAMA Intern Med. 2017;177:276-7.
3. Shahzad M, Naci H, Wagner AK. Estimated medicare spending on cancer drug indications with a confirmed lack of clinical benefit after US food and drug administration accelerated approval. JAMA Intern Med. 2021;181:1673-5.
4. US Department of Health and Human Services, Centers for Medicare and Medicaid Services. NHE Projections 2010-2020. Washington, DC: US Department of Health and Human Services. Available from: https://www.cms.gov/data-research/statistics-trends-and-reports/national-health-expenditure-data/nhe-fact-sheet. [Last accessed on 27 May 2026].
5. Reig M, Forner A, Rimola J, et al. BCLC strategy for prognosis prediction and treatment recommendation: The 2022 update. J Hepatol. 2022;76:681-93.
6. Iezzi R, Pompili M, Posa A, Coppola G, Gasbarrini A, Bonomo L. Combined locoregional treatment of patients with hepatocellular carcinoma: state of the art. World J Gastroenterol. 2016;22:1935-42.
7. Viveiros P, Riaz A, Lewandowski RJ, Mahalingam D. Current state of liver-directed therapies and combinatory approaches with systemic therapy in hepatocellular carcinoma (HCC). Cancers. 2019;11:1085.
9. Likhitsup A, Parikh ND. Economic implications of hepatocellular carcinoma surveillance and treatment: a guide for clinicians. Pharmacoeconomics. 2020;38:5-24.
10. Lai JC, Yang B, Lee HW, et al. Non-invasive risk-based surveillance of hepatocellular carcinoma in patients with metabolic dysfunction-associated steatotic liver disease. Gut. 2025;74:2050-7.
11. Daher S, Massarwa M, Benson AA, Khoury T. Current and future treatment of hepatocellular carcinoma: an updated comprehensive review. J Clin Transl Hepatol. 2018;6:69-78.
13. Bruix J, Chan SL, Galle PR, Rimassa L, Sangro B. Systemic treatment of hepatocellular carcinoma: an EASL position paper. J Hepatol. 2021;75:960-74.
14. Moriguchi M, Kataoka S, Itoh Y. Evolution of systemic treatment for hepatocellular carcinoma: changing treatment strategies and concepts. Cancers. 2024;16:2387.
15. Kudo M, Aoki T, Ueshima K, et al. Achievement of complete response and drug-free status by atezolizumab plus bevacizumab combined with or without curative conversion in patients with transarterial chemoembolization-unsuitable, intermediate-stage hepatocellular carcinoma: a multicenter proof-of-concept study. Liver Cancer. 2023;12:321-38.
16. Singal AG, Yarchoan M, Yopp A, Sapisochin G, Pinato DJ, Pillai A. Neoadjuvant and adjuvant systemic therapy in HCC: current status and the future. Hepatol Commun. 2024;8:e0430.
17. Hasegawa K, Takemura N, Yamashita T, et al.; committee for Revision of the Clinical Practice Guidelines for Hepatocellular Carcinoma, Tokyo, Japan. Clinical Practice Guidelines for Hepatocellular Carcinoma: The Japan Society of Hepatology 2021 version (5th JSH-HCC Guidelines). Hepatol Res. 2023;53:383-90.
18. Xie DY, Zhu K, Ren ZG, Zhou J, Fan J, Gao Q. A review of 2022 Chinese clinical guidelines on the management of hepatocellular carcinoma: updates and insights. Hepatobiliary Surg Nutr. 2023;12:216-28.
19. Association for the Study of the Liver. EASL Clinical Practice Guidelines on the management of hepatocellular carcinoma. J Hepatol. 2025;82:315-74.
20. Singal AG, Llovet JM, Yarchoan M, et al. AASLD Practice Guidance on prevention, diagnosis, and treatment of hepatocellular carcinoma. Hepatology. 2023;78:1922-65.
21. Sukhera J. Narrative reviews: flexible, rigorous, and practical. J Grad Med Educ. 2022;14:414-7.
22. Jr PD, Fitzgerald SM. Using narrative literature reviews to build a scientific knowledge base. Work. 2001;16:165-70.
23. Horsley T. Tips for improving the writing and reporting quality of systematic, scoping, and narrative reviews. J Contin Educ Health Prof. 2019;39:54-7.
24. O’Brien B. Principles of economic evaluation for health care programs. J Rheumatol. 1995;22:1399-402.
25. Drummond MF, O’Brien BJ, Torrance GW, Stoddart GL. Methods for the Economic Evaluation of Health Care Programmes. 2nd ed. Oxford University Press; 1997. Available from: https://shib.york.ac.uk/idp/profile/SAML2/POST/SSO?execution=e1s1. [Last accessed on 10 Jun 2026].
26. Saunders MN, Rojon C. On the attributes of a critical literature review. Coach Int J Theory Res Pract. 2011;4:156-62.
27. Doubilet P, Weinstein MC, McNeil BJ. Use and misuse of the term “cost effective” in medicine. N Engl J Med. 1986;314:253-6.
29. McIntosh E, Donaldson C, Ryan M. Recent advances in the methods of cost-benefit analysis in healthcare. Matching the art to the science. Pharmacoeconomics. 1999;15:357-67.
30. Moher D, Liberati A, Tetzlaff J, Altman DG; PRISMA Group. Preferred reporting items for systematic reviews and meta-analyses: the PRISMA statement. PLoS Med. 2009;6:e1000097.
31. Husereau D, Drummond M, Petrou S, et al.; ISPOR Health Economic Evaluation Publication Guidelines-CHEERS Good Reporting Practices Task Force. Consolidated health economic evaluation reporting standards (CHEERS)--explanation and elaboration: a report of the ISPOR Health Economic Evaluation Publication Guidelines Good Reporting Practices Task Force. Value Health. 2013;16:231-50.
32. OANDA Corporation. Currency Converter. Available from: https://www.oanda.com/currency-converter/en/?from=EUR&to=USD&amount=1. [Last accessed on 27 May 2026].
33. Ye Z, Abduhilil R, Huang J, Sun L. Willingness to pay for one additional quality adjusted life year: a population based survey from China. Appl Health Econ Health Policy. 2022;20:893-904.
34. Chang TW, Chang WC, Chou WH, Chang WP, Kuo CN. Evaluating the cost-effectiveness of atezolizumab-bevacizumab in advanced hepatocellular carcinoma: Insights from Taiwan. J Food Drug Anal. 2025;33:163-71.
35. Liu L, Wang L, Ding Y, Zhang Q, Shu Y. Cost-effectiveness of atezolizumab plus bevacizumab versus sorafenib as first-line therapy in unresectable hepatocellular carcinoma in the US and Chinese setting: a modelling comparison study. BMJ Open. 2025;15:e094804.
36. Chee CE, Khara JS, Cheong J, et al. Cost-effectiveness analysis of atezolizumab plus bevacizumab compared with sorafenib as first-line treatment in advanced hepatocellular carcinoma in Singapore. Expert Rev Pharmacoecon Outcomes Res. 2024;24:631-41.
37. Sriphoosanaphan S, Pantumongkol W, Kulpeng W, et al. Cost-utility analysis of atezolizumab combined with bevacizumab for unresectable hepatocellular carcinoma in Thailand. PLoS One. 2024;19:e0300327.
38. Tseng CY, Tsai YW, Shiu MN. Cost-effectiveness analysis of atezolizumab plus bevacizumab versus sorafenib in first line treatment for Chinese subpopulation with unresectable hepatocellular carcinoma. Front Oncol. 2023;13:1264417.
39. Gaugain L, Cawston H, Dubois de Gennes C, et al. Cost-utility analysis of atezolizumab with bevacizumab in untreated unresectable or advanced hepatocellular carcinoma in France. PLoS One. 2023;18:e0280442.
40. Li Y, Liang X, Li H, Chen X. Atezolizumab plus bevacizumab versus nivolumab as first-line treatment for advanced or unresectable hepatocellular carcinoma: a cost-effectiveness analysis. Cancer. 2022;128:3995-4003.
41. Zhang X, Wang J, Shi J, Jia X, Dang S, Wang W. Cost-effectiveness of atezolizumab plus bevacizumab vs sorafenib for patients with unresectable or metastatic hepatocellular carcinoma. JAMA Netw Open. 2021;4:e214846.
42. Chiang CL, Chan SK, Lee SF, Choi HC. First-line atezolizumab plus bevacizumab versus sorafenib in hepatocellular carcinoma: a cost-effectiveness analysis. Cancers. 2021;13:931.
43. Su D, Wu B, Shi L. Cost-effectiveness of atezolizumab plus bevacizumab vs sorafenib as first-line treatment of unresectable hepatocellular carcinoma. JAMA Netw Open. 2021;4:e210037.
44. Wen F, Zheng H, Zhang P, Liao W, Zhou K, Li Q. Atezolizumab and bevacizumab combination compared with sorafenib as the first-line systemic treatment for patients with unresectable hepatocellular carcinoma: A cost-effectiveness analysis in China and the United states. Liver Int. 2021;41:1097-104.
45. Xu Z, Ye ZM, Tang YK, et al. Cost-effectiveness analysis of sintilimab plus IBI305 versus sorafenib for unresectable hepatic cell carcinoma in China. Cancer Med. 2023;12:14871-80.
46. Peng Y, Zeng X, Peng L, et al. Sintilimab plus bevacizumab biosimilar versus sorafenib as first-line treatment for unresectable hepatocellular carcinoma: a cost-effectiveness analysis. Front Pharmacol. 2022;13:778505.
47. Zhou T, Wang X, Cao Y, et al. Cost-effectiveness analysis of sintilimab plus bevacizumab biosimilar compared with lenvatinib as the first-line treatment of unresectable or metastatic hepatocellular carcinoma. BMC Health Serv Res. 2022;22:1367.
48. Zhou T, Cao Y, Wang X, et al. Economic evaluation of sintilimab plus bevacizumab versus sorafenib as a first-line treatment for unresectable hepatocellular carcinoma. Adv Ther. 2022;39:2165-77.
49. Cheng S, Li B, Tang L, Liu S, Xiao J. Tremelimumab plus durvalumab versus sorafenib in first-line treatment of unresectable hepatocellular carcinoma: a cost-effectiveness analysis from the US payer perspective. BMJ Open. 2025;15:e090992.
50. Xiong X, Guo JJ. Cost effectiveness of tremelimumab plus durvalumab for unresectable hepatocellular carcinoma in the USA. Pharmacoeconomics. 2025;43:271-82.
51. Liao W, Xu H, Hutton D, et al. Cost-effectiveness analysis of durvalumab plus tremelimumab as first-line therapy in patients with unresectable hepatocellular carcinoma. Ther Adv Med Oncol. 2024;16:17588359241274625.
52. Zhao Z, Jiang X, Wen S, Hao Y. Cost-effectiveness of camrelizumab plus rivoceranib for advanced hepatocellular carcinoma in the context of regional disparities in China. Front Oncol. 2024;14:1491404.
53. Wei J, Xu K, Lin Y, et al. Economic evaluation of camrelizumab plus rivoceranib versus sorafenib as first-line therapy for unresectable hepatocellular carcinoma in the United States and China. Int J Clin Pharm. 2024;46:1189-99.
54. Sun Y, Xu K, Yao H, et al. Cost-effectiveness of tislelizumab versus sorafenib as first-line treatment for unresectable hepatocellular carcinoma: a comparative analysis in China, the United States and Europe. Int J Clin Pharm. 2025;47:196-209.
55. Zheng Z, Lin Y, Cai H. Tislelizumab versus sorafenib as first-line treatment for advanced hepatocellular carcinoma in China: a cost-effectiveness analysis. Front Public Health. 2024;12:1356244.
56. Chen Q, Sun Q, Zhang J, Li B, Feng Q, Liu J. Cost-effectiveness analysis of Tislelizumab vs Sorafenib as the first-line treatment of unresectable hepatocellular carcinoma. PLoS One. 2024;19:e0295090.
57. Shu Y, Tang Y, Ding Y, Zhang Q. Cost-effectiveness of nivolumab versus sorafenib as first-line treatment for advanced hepatocellular carcinoma. Int Immunopharmacol. 2023;122:110543.
58. Li Y, Liang X, Li H, Yang T, Guo S, Chen X. Nivolumab versus sorafenib as first-line therapy for advanced hepatocellular carcinoma: a cost-effectiveness analysis. Front Pharmacol. 2022;13:906956.
59. Sherrow C, Attwood K, Zhou K, Mukherjee S, Iyer R, Fountzilas C. Sequencing systemic therapy pathways for advanced hepatocellular carcinoma: a cost effectiveness analysis. Liver Cancer. 2020;9:549-62.
60. Lian D, Gan Y, Xiao D, Xuan D, Liu S, Wei Y. Cost-effectiveness of first-line systemic therapies for unresectable hepatocellular carcinoma. Br J Clin Pharmacol. 2024;Epub ahead of print.
61. Wen F, Huang P, Wu Q, et al. Promising first-line immuno-combination therapies for unresectable hepatocellular carcinoma: a cost-effectiveness analysis. Cancer Med. 2024;13:e70094.
62. Sun KX, Cao SS, Shi FH, et al. First-line treatments for advanced hepatocellular carcinoma: a network meta-analysis and cost-effectiveness analysis in China and the United States. Ther Adv Gastroenterol. 2022;15:17562848221140662.
63. Li L, Yang S, Chen Y, et al. Immune checkpoint inhibitors plus an anti-VEGF antibody as the first-line treatment for unresectable hepatocellular carcinoma: a network meta-analysis and cost-effectiveness analysis. Front Pharmacol. 2022;13:891008.
64. Gong H, Ong SC, Li F, Weng Z, Zhao K, Jiang Z. Cost-effectiveness analysis of sorafenib, lenvatinib, atezolizumab plus bevacizumab and sintilimab plus bevacizumab for the treatment of advanced hepatocellular carcinoma in China. Cost Eff Resour Alloc. 2023;21:20.
65. Wang L, Peng Y, Qin S, et al. First-line systemic treatment strategies for unresectable hepatocellular carcinoma: a cost-effectiveness analysis. PLoS One. 2023;18:e0279786.
66. Guan H, Wang C, Zhao Z, Han S. Cost-effectiveness of donafenib as first-line treatment of unresectable hepatocellular carcinoma in China. Adv Ther. 2022;39:3334-46.
67. Zhao M, Pan X, Yin Y, et al. Cost-effectiveness analysis of five systemic treatments for unresectable hepatocellular carcinoma in China: an economic evaluation based on network meta-analysis. Front Public Health. 2022;10:869960.
68. Giuliani J, Mantoan B, Bonetti A. The cost-effectiveness of new first-line therapies approved in advanced hepatocellular carcinoma. J Oncol Pharm Pract. 2022;28:434-7.
69. Meng R, Zhang X, Zhou T, Luo M, Qiu Y. Cost-effectiveness analysis of donafenib versus lenvatinib for first-line treatment of unresectable or metastatic hepatocellular carcinoma. Expert Rev Pharmacoecon Outcomes Res. 2022;22:1079-86.
70. Meyers BM, Vogel A, Marotta P, et al. The cost-effectiveness of lenvatinib in the treatment of advanced or unresectable hepatocellular carcinoma from a Canadian perspective. Can J Gastroenterol Hepatol. 2021;2021:8811018.
71. Ikeda S, Kudo M, Izumi N, et al. Cost-effectiveness of lenvatinib in the treatment of patients with unresectable hepatocellular carcinomas in Japan: an analysis using data from Japanese patients in the REFLECT trial. Value Health Reg Issues. 2021;24:82-9.
72. Saiyed M, Byrnes J, Srivastava T, Scuffham P, Downes M. Cost-effectiveness of lenvatinib compared with sorafenib for the first-line treatment of advanced hepatocellular carcinoma in Australia. Clin Drug Investig. 2020;40:1167-76.
73. Cai H, Zhang L, Li N, Zheng B, Liu M. Lenvatinib versus sorafenib for unresectable hepatocellular carcinoma: a cost-effectiveness analysis. J Comp Eff Res. 2020;9:553-62.
74. Kim JJ, McFarlane T, Tully S, Wong WWL. Lenvatinib versus sorafenib as first-line treatment of unresectable hepatocellular carcinoma: a cost-utility analysis. Oncologist. 2020;25:e512-9.
75. Kobayashi M, Kudo M, Izumi N, et al. Cost-effectiveness analysis of lenvatinib treatment for patients with unresectable hepatocellular carcinoma (uHCC) compared with sorafenib in Japan. J Gastroenterol. 2019;54:558-70.
76. Sieg M, Hartmann M, Settmacher U, Arefian H. Comparative cost-effectiveness of cabozantinib as second-line therapy for patients with advanced hepatocellular carcinoma in Germany and the United States. BMC Gastroenterol. 2020;20:120.
77. Shlomai A, Leshno M, Goldstein DA. Cabozantinib for patients with advanced hepatocellular carcinoma: a cost-effectiveness analysis. Ther Adv Gastroenterol. 2019;12:1756284819878304.
78. Liao W, Huang J, Hutton D, et al. Cost-effectiveness analysis of cabozantinib as second-line therapy in advanced hepatocellular carcinoma. Liver Int. 2019;39:2408-16.
79. Soto-Perez-de-Celis E, Aguiar PN, Cordón ML, Chavarri-Guerra Y, Lopes GL. Cost-effectiveness of cabozantinib in the second-line treatment of advanced hepatocellular carcinoma. J Natl Compr Canc Netw. 2019;17:669-75.
80. Shlomai A, Leshno M, Goldstein DA. Regorafenib treatment for patients with hepatocellular carcinoma who progressed on sorafenib-A cost-effectiveness analysis. PLoS One. 2018;13:e0207132.
81. Parikh ND, Singal AG, Hutton DW. Cost effectiveness of regorafenib as second-line therapy for patients with advanced hepatocellular carcinoma. Cancer. 2017;123:3725-31.
82. Chiang CL, Chan SK, Lee SF, Wong IO, Choi HC. Cost-effectiveness of Pembrolizumab as a second-line therapy for hepatocellular carcinoma. JAMA Netw Open. 2021;4:e2033761.
83. Zheng H, Qin Z, Qiu X, Zhan M, Wen F, Xu T. Cost-effectiveness analysis of ramucirumab treatment for patients with hepatocellular carcinoma who progressed on sorafenib with α-fetoprotein concentrations of at least 400 ng/ml. J Med Econ. 2020;23:347-52.
84. Gupta N, Verma RK, Prinja S, Dhiman RK. Cost-effectiveness of sorafenib for treatment of advanced hepatocellular carcinoma in India. J Clin Exp Hepatol. 2019;9:468-75.
85. Hamdy Elsisi G, Nada Y, Rashad N, Carapinha J. Cost-effectiveness of sorafenib versus best supportive care in advanced hepatocellular carcinoma in Egypt. J Med Econ. 2019;22:163-8.
86. Parikh ND, Marshall VD, Singal AG, et al. Survival and cost-effectiveness of sorafenib therapy in advanced hepatocellular carcinoma: an analysis of the SEER-Medicare database. Hepatology. 2017;65:122-33.
87. Zhang P, Yang Y, Wen F, et al. Cost-effectiveness of sorafenib as a first-line treatment for advanced hepatocellular carcinoma. Eur J Gastroenterol Hepatol. 2015;27:853-9.
88. Gomersall JS, Jadotte YT, Xue Y, Lockwood S, Riddle D, Preda A. Conducting systematic reviews of economic evaluations. Int J Evid Based Healthc. 2015;13:170-8.
89. Adarkwah CC, van Gils PF, Hiligsmann M, Evers SM. Risk of bias in model-based economic evaluations: the ECOBIAS checklist. Expert Rev Pharmacoecon Outcomes Res. 2016;16:513-23.
90. Finn RS, Qin S, Ikeda M, et al.; IMbrave150 Investigators. Atezolizumab plus bevacizumab in unresectable hepatocellular carcinoma. N Engl J Med. 2020;382:1894-905.
91. Yau T, Park JW, Finn RS, et al. Nivolumab versus sorafenib in advanced hepatocellular carcinoma (CheckMate 459): a randomised, multicentre, open-label, phase 3 trial. Lancet Oncol. 2022;23:77-90.
92. Ren Z, Xu J, Bai Y, et al.; ORIENT-32 study group. Sintilimab plus a bevacizumab biosimilar (IBI305) versus sorafenib in unresectable hepatocellular carcinoma (ORIENT-32): a randomised, open-label, phase 2-3 study. Lancet Oncol. 2021;22:977-90.
93. Kudo M, Finn RS, Qin S, et al. Lenvatinib versus sorafenib in first-line treatment of patients with unresectable hepatocellular carcinoma: a randomised phase 3 non-inferiority trial. Lancet. 2018;391:1163-73.
94. Abou-Alfa GK, Lau G, Kudo M, et al. Tremelimumab plus durvalumab in unresectable hepatocellular carcinoma. NEJM Evid. 2022;1:EVIDoa2100070.
95. Qin S, Chan SL, Gu S, et al.; CARES-310 Study Group. Camrelizumab plus rivoceranib versus sorafenib as first-line therapy for unresectable hepatocellular carcinoma (CARES-310): a randomised, open-label, international phase 3 study. Lancet. 2023;402:1133-46.
96. Qin S, Kudo M, Meyer T, et al. Tislelizumab vs sorafenib as first-line treatment for unresectable hepatocellular carcinoma: a phase 3 randomized clinical trial. JAMA Oncol. 2023;9:1651-9.
98. Qin S, Bi F, Gu S, et al. Donafenib versus sorafenib in first-line treatment of unresectable or metastatic hepatocellular carcinoma: a randomized, open-label, parallel-controlled phase II-III trial. J Clin Oncol. 2021;39:3002-11.
99. Abou-Alfa GK, Meyer T, Cheng AL, et al. Cabozantinib in patients with advanced and progressing hepatocellular carcinoma. N Engl J Med. 2018;379:54-63.
100. Bruix J, Qin S, Merle P, et al.; RESORCE Investigators. Regorafenib for patients with hepatocellular carcinoma who progressed on sorafenib treatment (RESORCE): a randomised, double-blind, placebo-controlled, phase 3 trial. Lancet. 2017;389:56-66.
101. Finn RS, Ryoo BY, Merle P, et al.; KEYNOTE-240 investigators. Pembrolizumab as second-line therapy in patients with advanced hepatocellular carcinoma in KEYNOTE-240: a randomized, double-blind, phase III trial. J Clin Oncol. 2020;38:193-202.
102. Zhu AX, Kang YK, Yen CJ, et al.; REACH-2 study investigators. Ramucirumab after sorafenib in patients with advanced hepatocellular carcinoma and increased α-fetoprotein concentrations (REACH-2): a randomised, double-blind, placebo-controlled, phase 3 trial. Lancet Oncol. 2019;20:282-96.
103. Llovet JM, Ricci S, Mazzaferro V, et al.; SHARP Investigators Study Group. Sorafenib in advanced hepatocellular carcinoma. N Engl J Med. 2008;359:378-90.
104. Young KC, Kelly AG, Holloway RG. Reading a cost-effectiveness or decision analysis study: five things to consider. Neurol Clin Pract. 2013;3:413-20.
105. Zilberberg MD, Shorr AF. Understanding cost-effectiveness. Clin Microbiol Infect. 2010;16:1707-12.
106. Zhan Z, Chen B, Huang R, et al. Long-term trends and future projections of liver cancer burden in China from 1990 to 2030. Sci Rep. 2025;15:13120.
107. Sun J, Li Q, Bai X, et al.; Chinese Association of Liver Cancer and Chinese Medical Doctor Association. Chinese expert consensus on clinical application of molecularly targeted drugs for hepatocellular carcinoma (2022 edition). Chin Med J. 2024;137:2630-2.
108. Wilson BE, Booth CM. Real-world data: bridging the gap between clinical trials and practice. EClinicalMedicine. 2024;78:102915.
109. Chan LL, Kwong TT, Yau JCW, Chan SL. Treatment for hepatocellular carcinoma after immunotherapy. Ann Hepatol. 2025;30:101781.
Cite This Article
How to Cite
Download Citation
Export Citation File:
Type of Import
Tips on Downloading Citation
Citation Manager File Format
Type of Import
Direct Import: When the Direct Import option is selected (the default state), a dialogue box will give you the option to Save or Open the downloaded citation data. Choosing Open will either launch your citation manager or give you a choice of applications with which to use the metadata. The Save option saves the file locally for later use.
Indirect Import: When the Indirect Import option is selected, the metadata is displayed and may be copied and pasted as needed.
About This Article
Copyright

Data & Comments
Data
0


Comments
Comments must be written in English. Spam, offensive content, impersonation, and private information will not be permitted. If any comment is reported and identified as inappropriate content by OAE staff, the comment will be removed without notice. If you have any queries or need any help, please contact us at [email protected].