
fig3
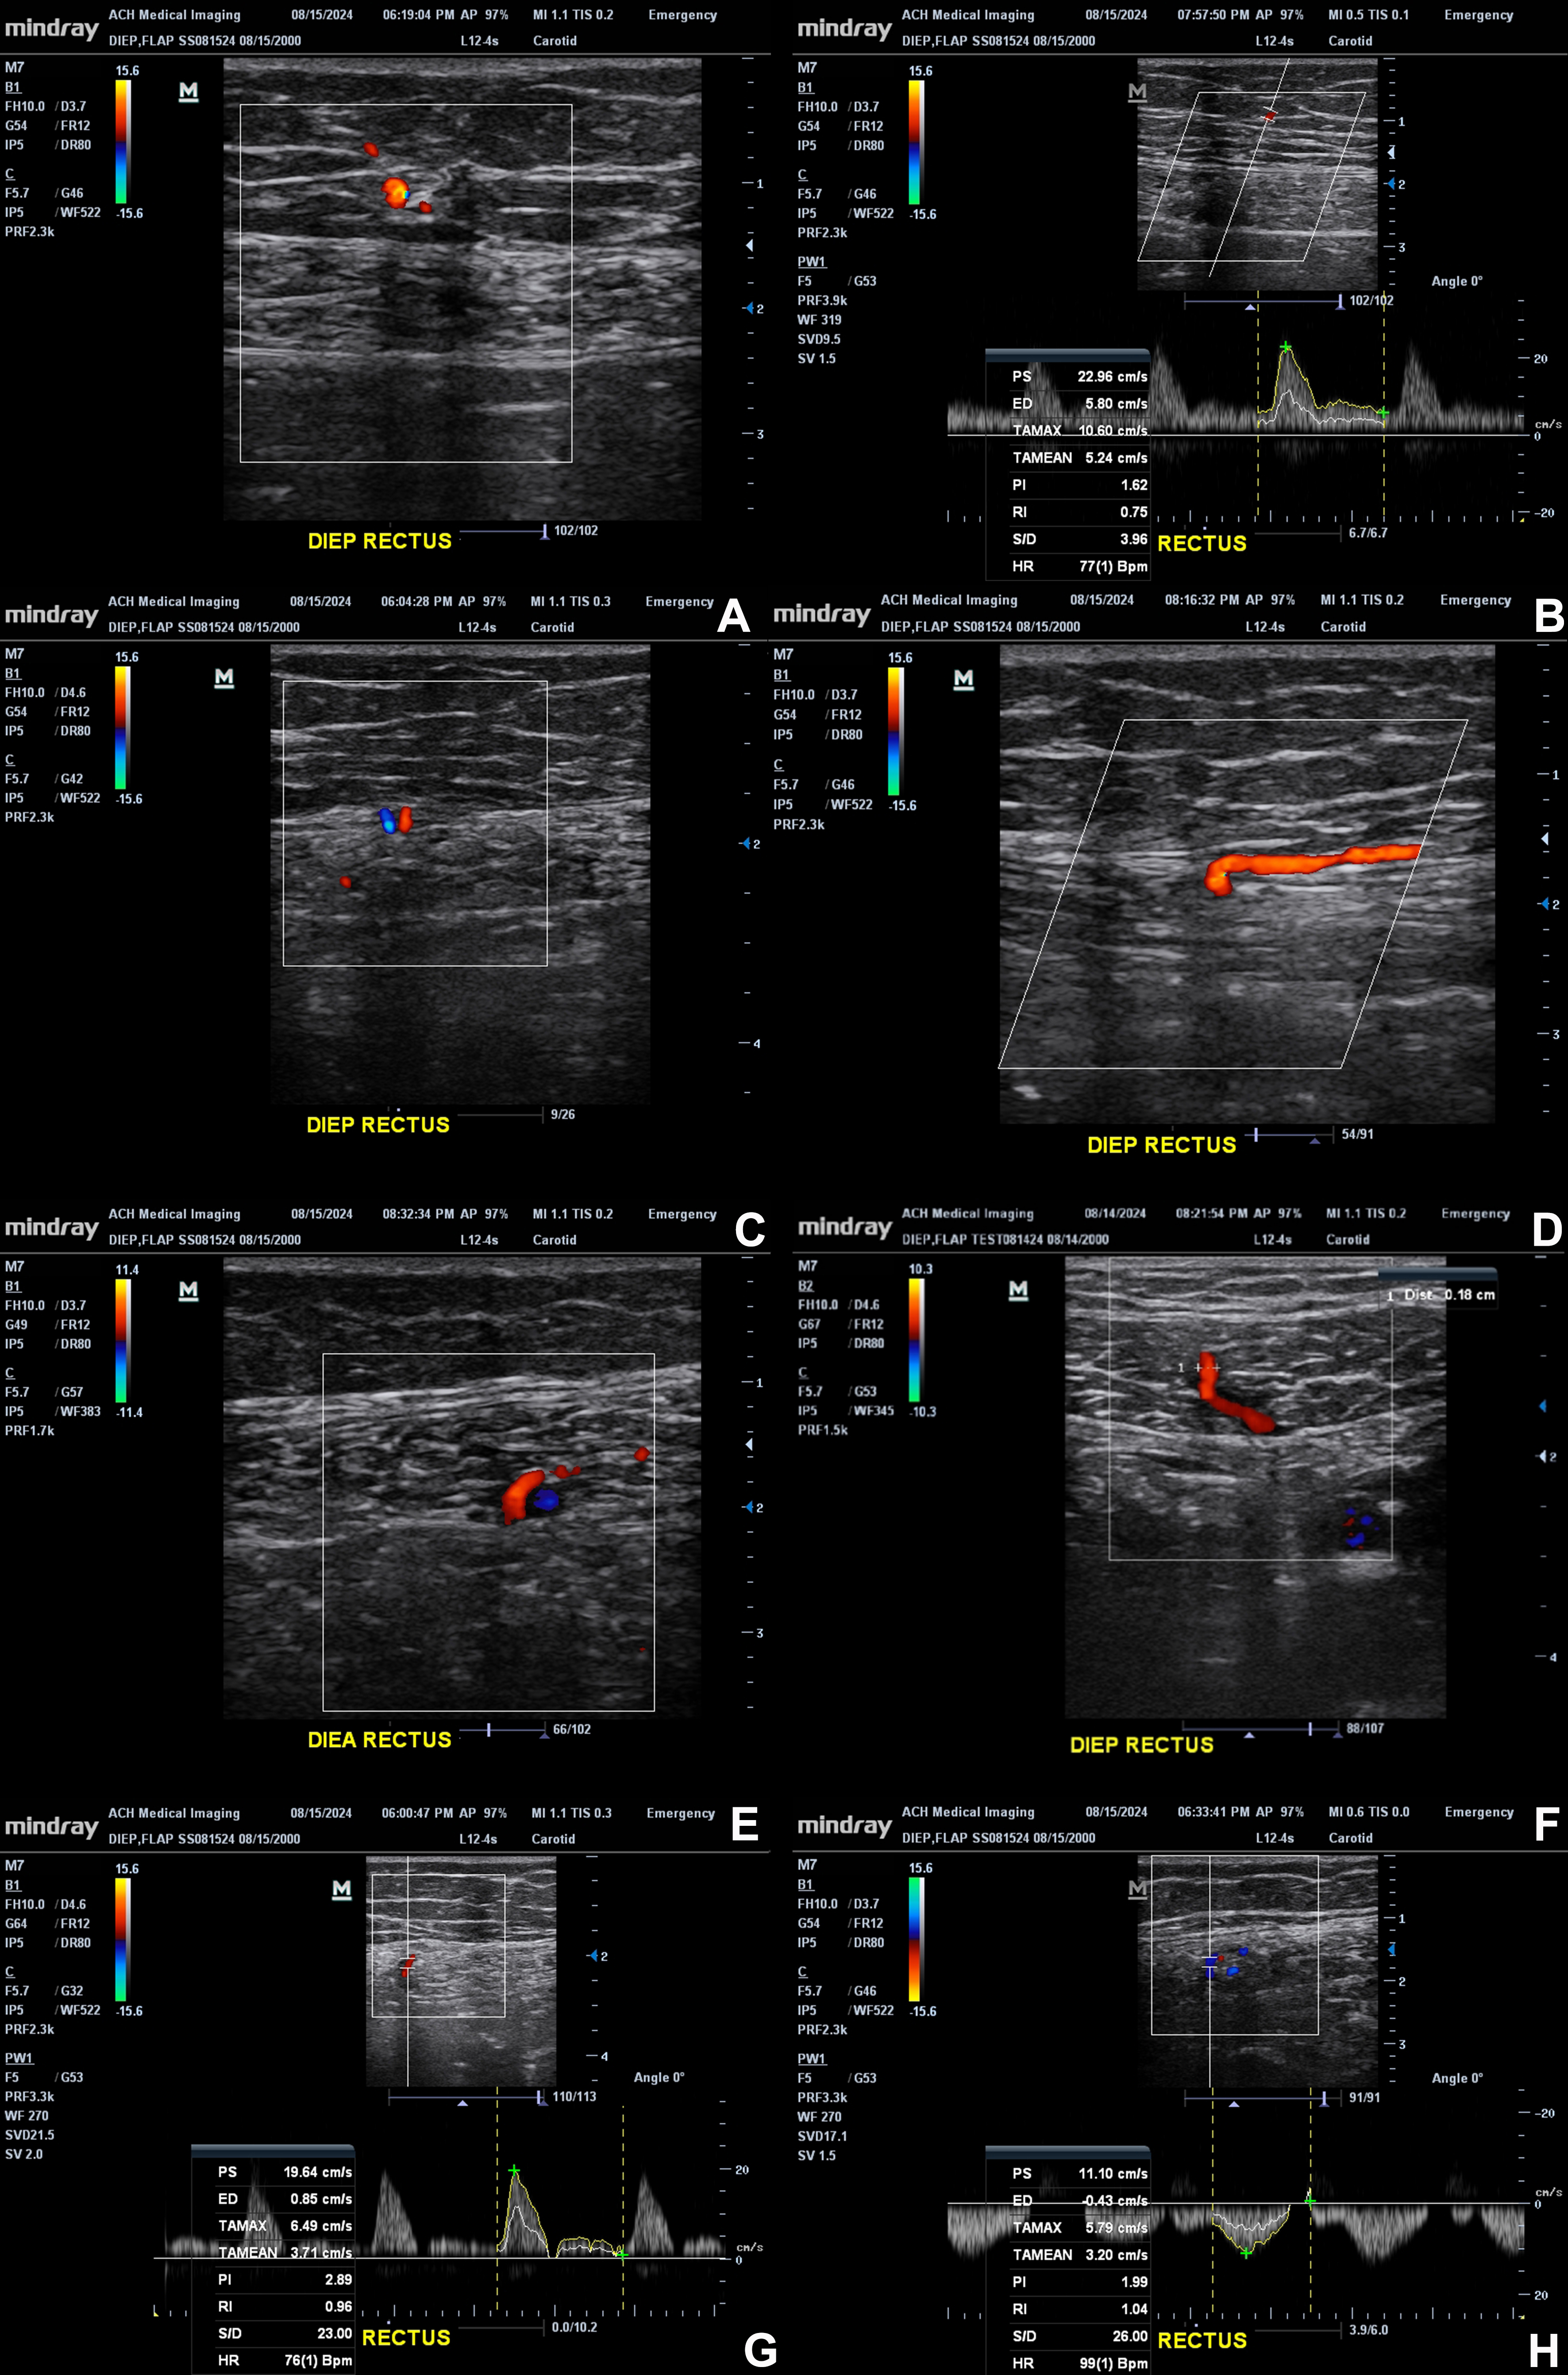
Figure 3. Representative color Doppler images demonstrate perforators arising from the DIEA and traversing the rectus muscle toward the anterior fascia and subcutaneous tissue. (A) Color Doppler visualization of a perforator within the subcutaneous tissue; (B) Pulsed-wave spectral Doppler assessment of the subcutaneous perforator segment; (C) Cross-sectional view of the perforator at its passage through the anterior rectus sheath, connecting the subcutaneous and intramuscular segments; (D) Longitudinal view showing the perforator coursing within the subcutaneous tissue along the anterior rectus sheath and traversing the sheath; (E) A deeper vascular segment within the rectus; (F) A longitudinal/oblique view of a perforator changing direction, with a caliber of 0.18 cm; (G) Spectral Doppler sampling of an arterial segment, with a sharp systolic peak and little forward end-diastolic flow; (H) Spectral sampling of another vessel segment. These images highlight the integration of anatomic and functional evaluation during perforator mapping. The original figure was created by the authors. Images have not been previously published. Figure 3 contains illustrative ultrasound images acquired by the first author during self-scanning; no patient images are included. A: Artery; A&V: artery and vein; CDU: color Doppler ultrasound; DIEA: deep inferior epigastric artery; DIEP: deep inferior epigastric perforator; DIEV: deep inferior epigastric vein; ED: end-diastolic velocity; EX: external; G: gain; HR: heart rate; LONG: longitudinal; PI: pulsatility index; PS: peak systolic velocity; PW: pulsed-wave Doppler; RI: resistive index; S/D: systolicto-diastolic ratio; TAMAX: time-averaged maximum velocity; TAMEAN: time-averaged mean velocity; RT: right; V: vein; bpm: beats per minute.