
fig4
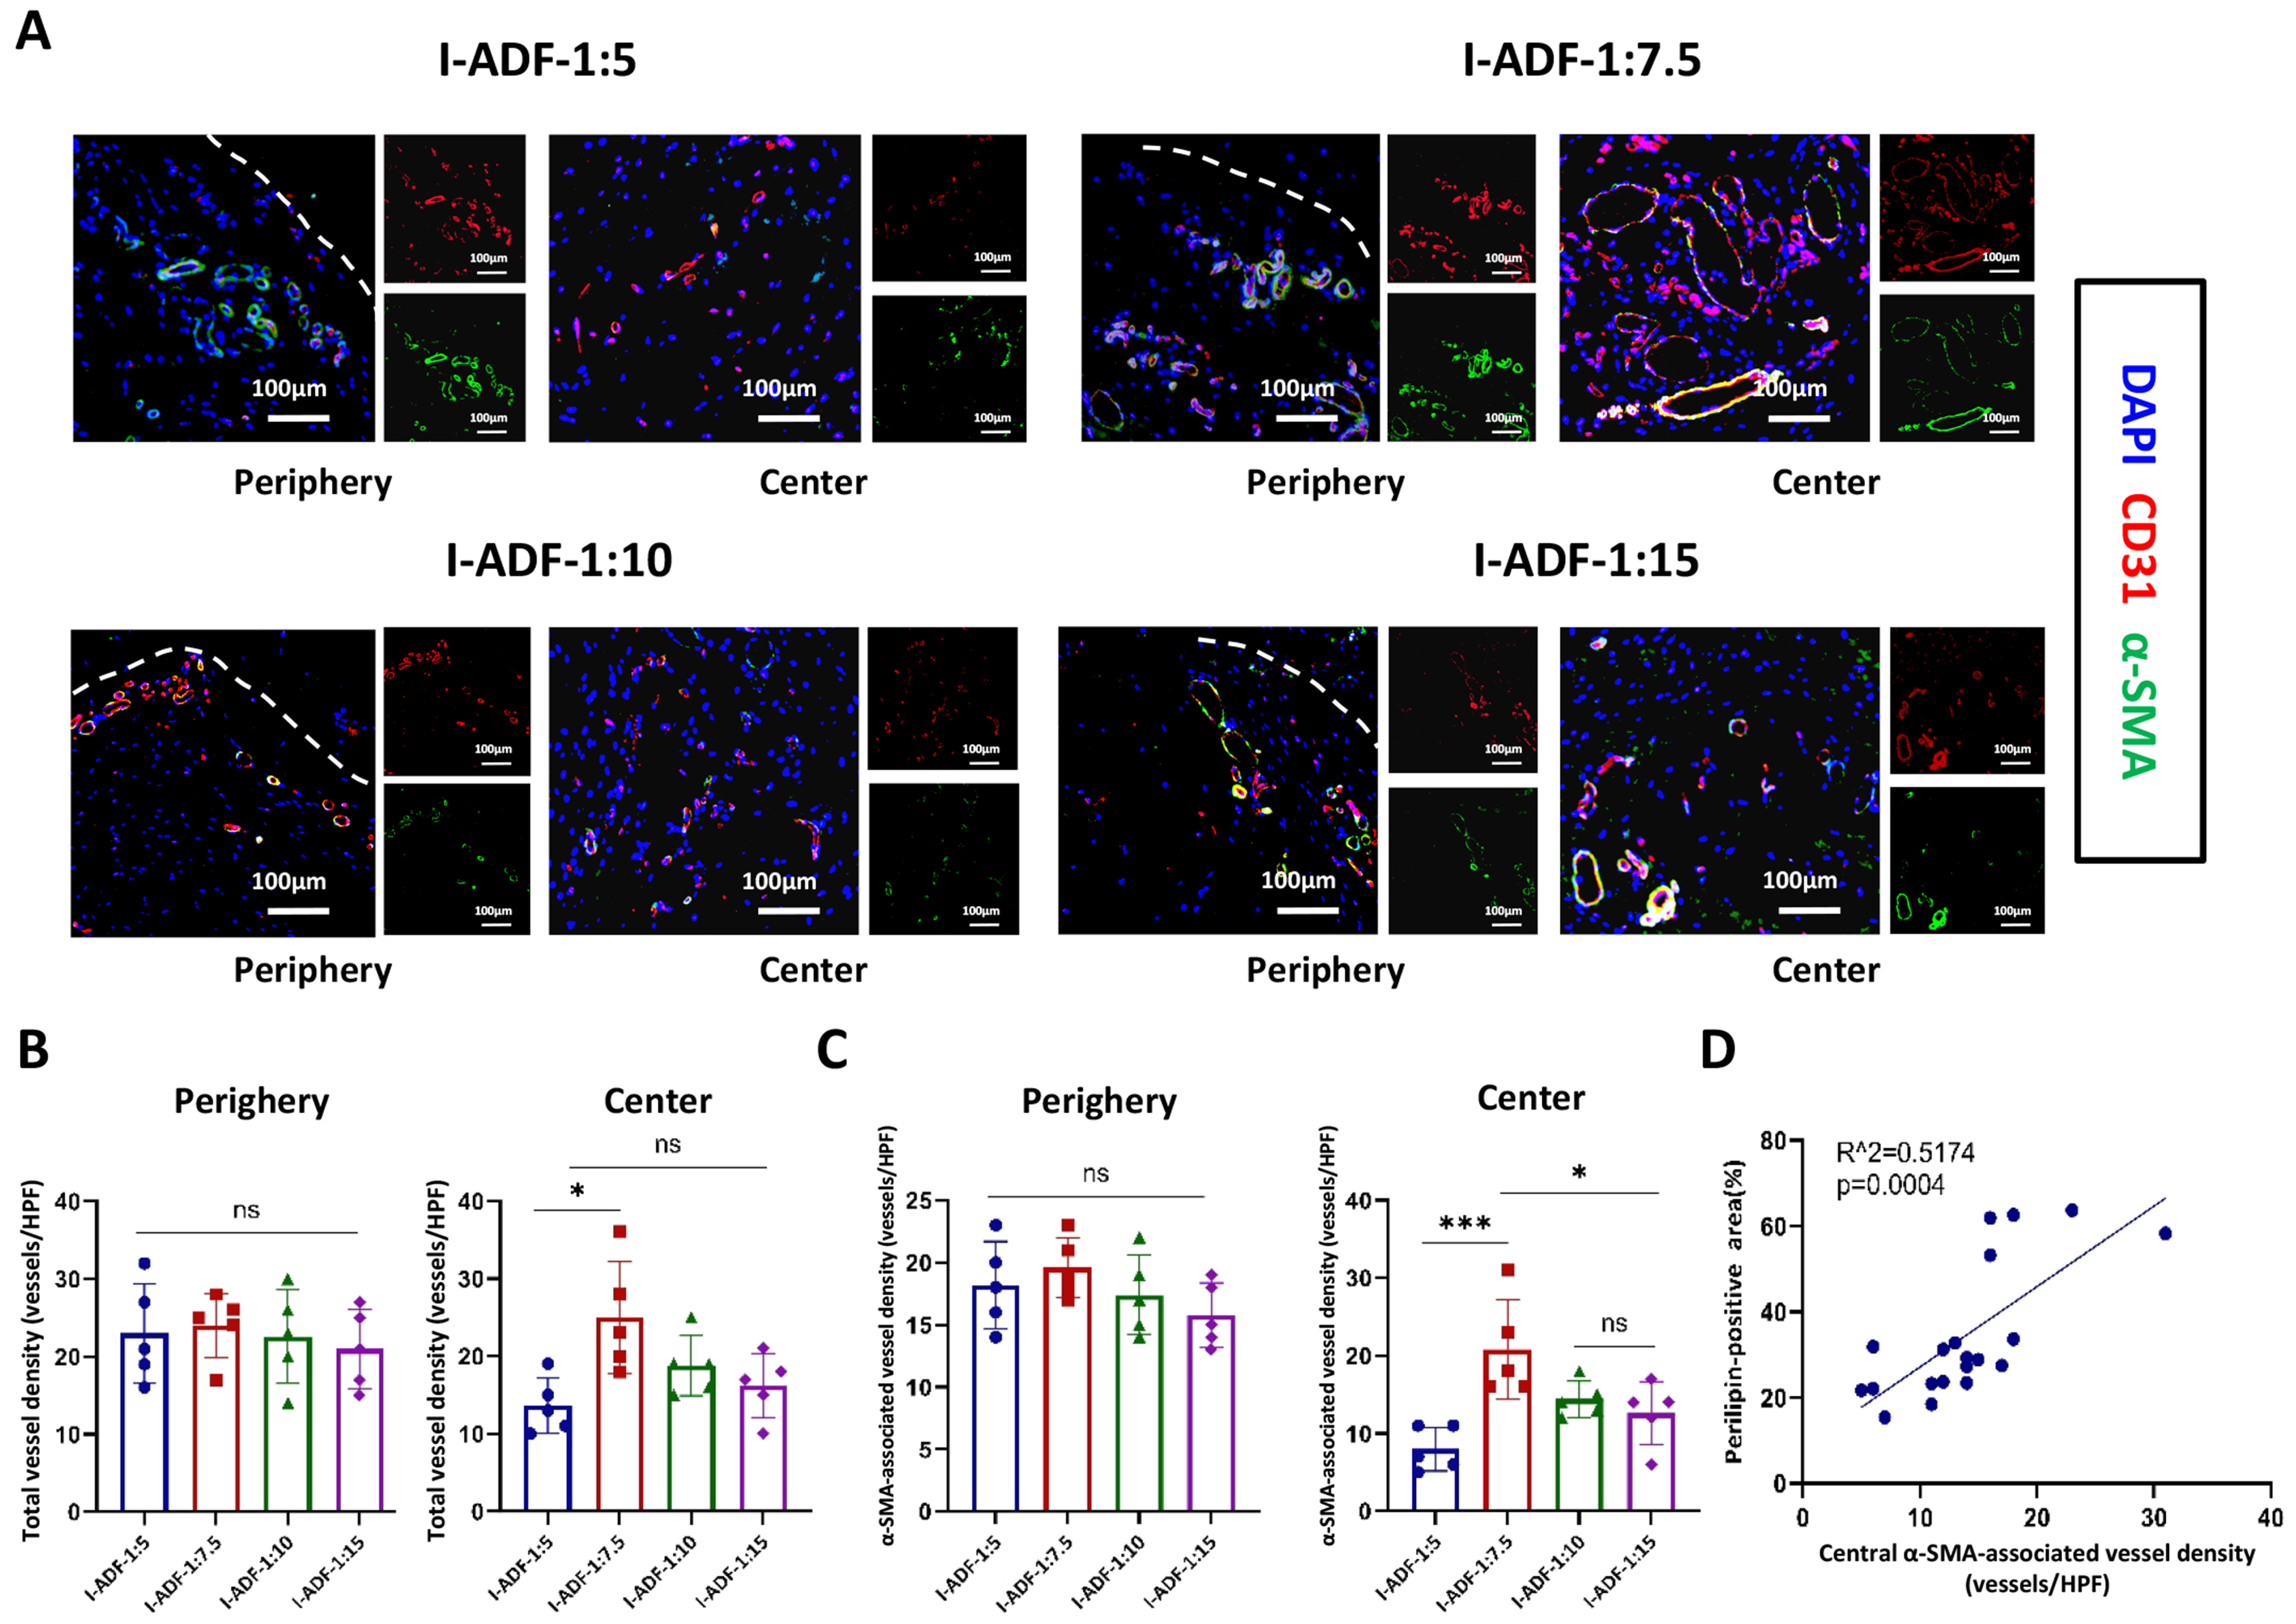
Figure 4. Evaluation of total and α-SMA-associated vessel densities in implanted I-ADF. (A) Representative CD31 and α-SMA immunofluorescence staining in the peripheral and central zones. Scale bars are shown in each micrograph in (A) and represent 100 μm; (B) Total vessel density, defined as the number of CD31-positive vascular structures per HPF; (C) α-SMA-associated vessel density, defined as the number of CD31-positive vascular structures surrounded by α-SMA-positive cells per HPF; (D) Association between central α-SMA-associated vessel density and the central Perilipin-positive area. Data in (B and C) are presented as mean ± SD (n = 5 biological samples per group at week 12) and were analyzed using one-way ANOVA followed by Tukey’s multiple-comparisons test. Pearson’s correlation analysis was used for (D). (D) includes 20 biological samples pooled across the four formulation groups. Statistical significance for the selected pairwise comparisons is indicated by horizontal lines: *P < 0.05 and ***P < 0.001. ADF: Adipose-derived matrix film; I-ADF: injectable adipose-derived matrix film fragments; DAPI: 4’,6-diamidino-2-phenylindole; CD31: cluster of differentiation 31; α-SMA: alpha-smooth muscle actin; HPF: high-power field; SD: standard deviation; ANOVA: analysis of variance; ns: not significant.