
fig3
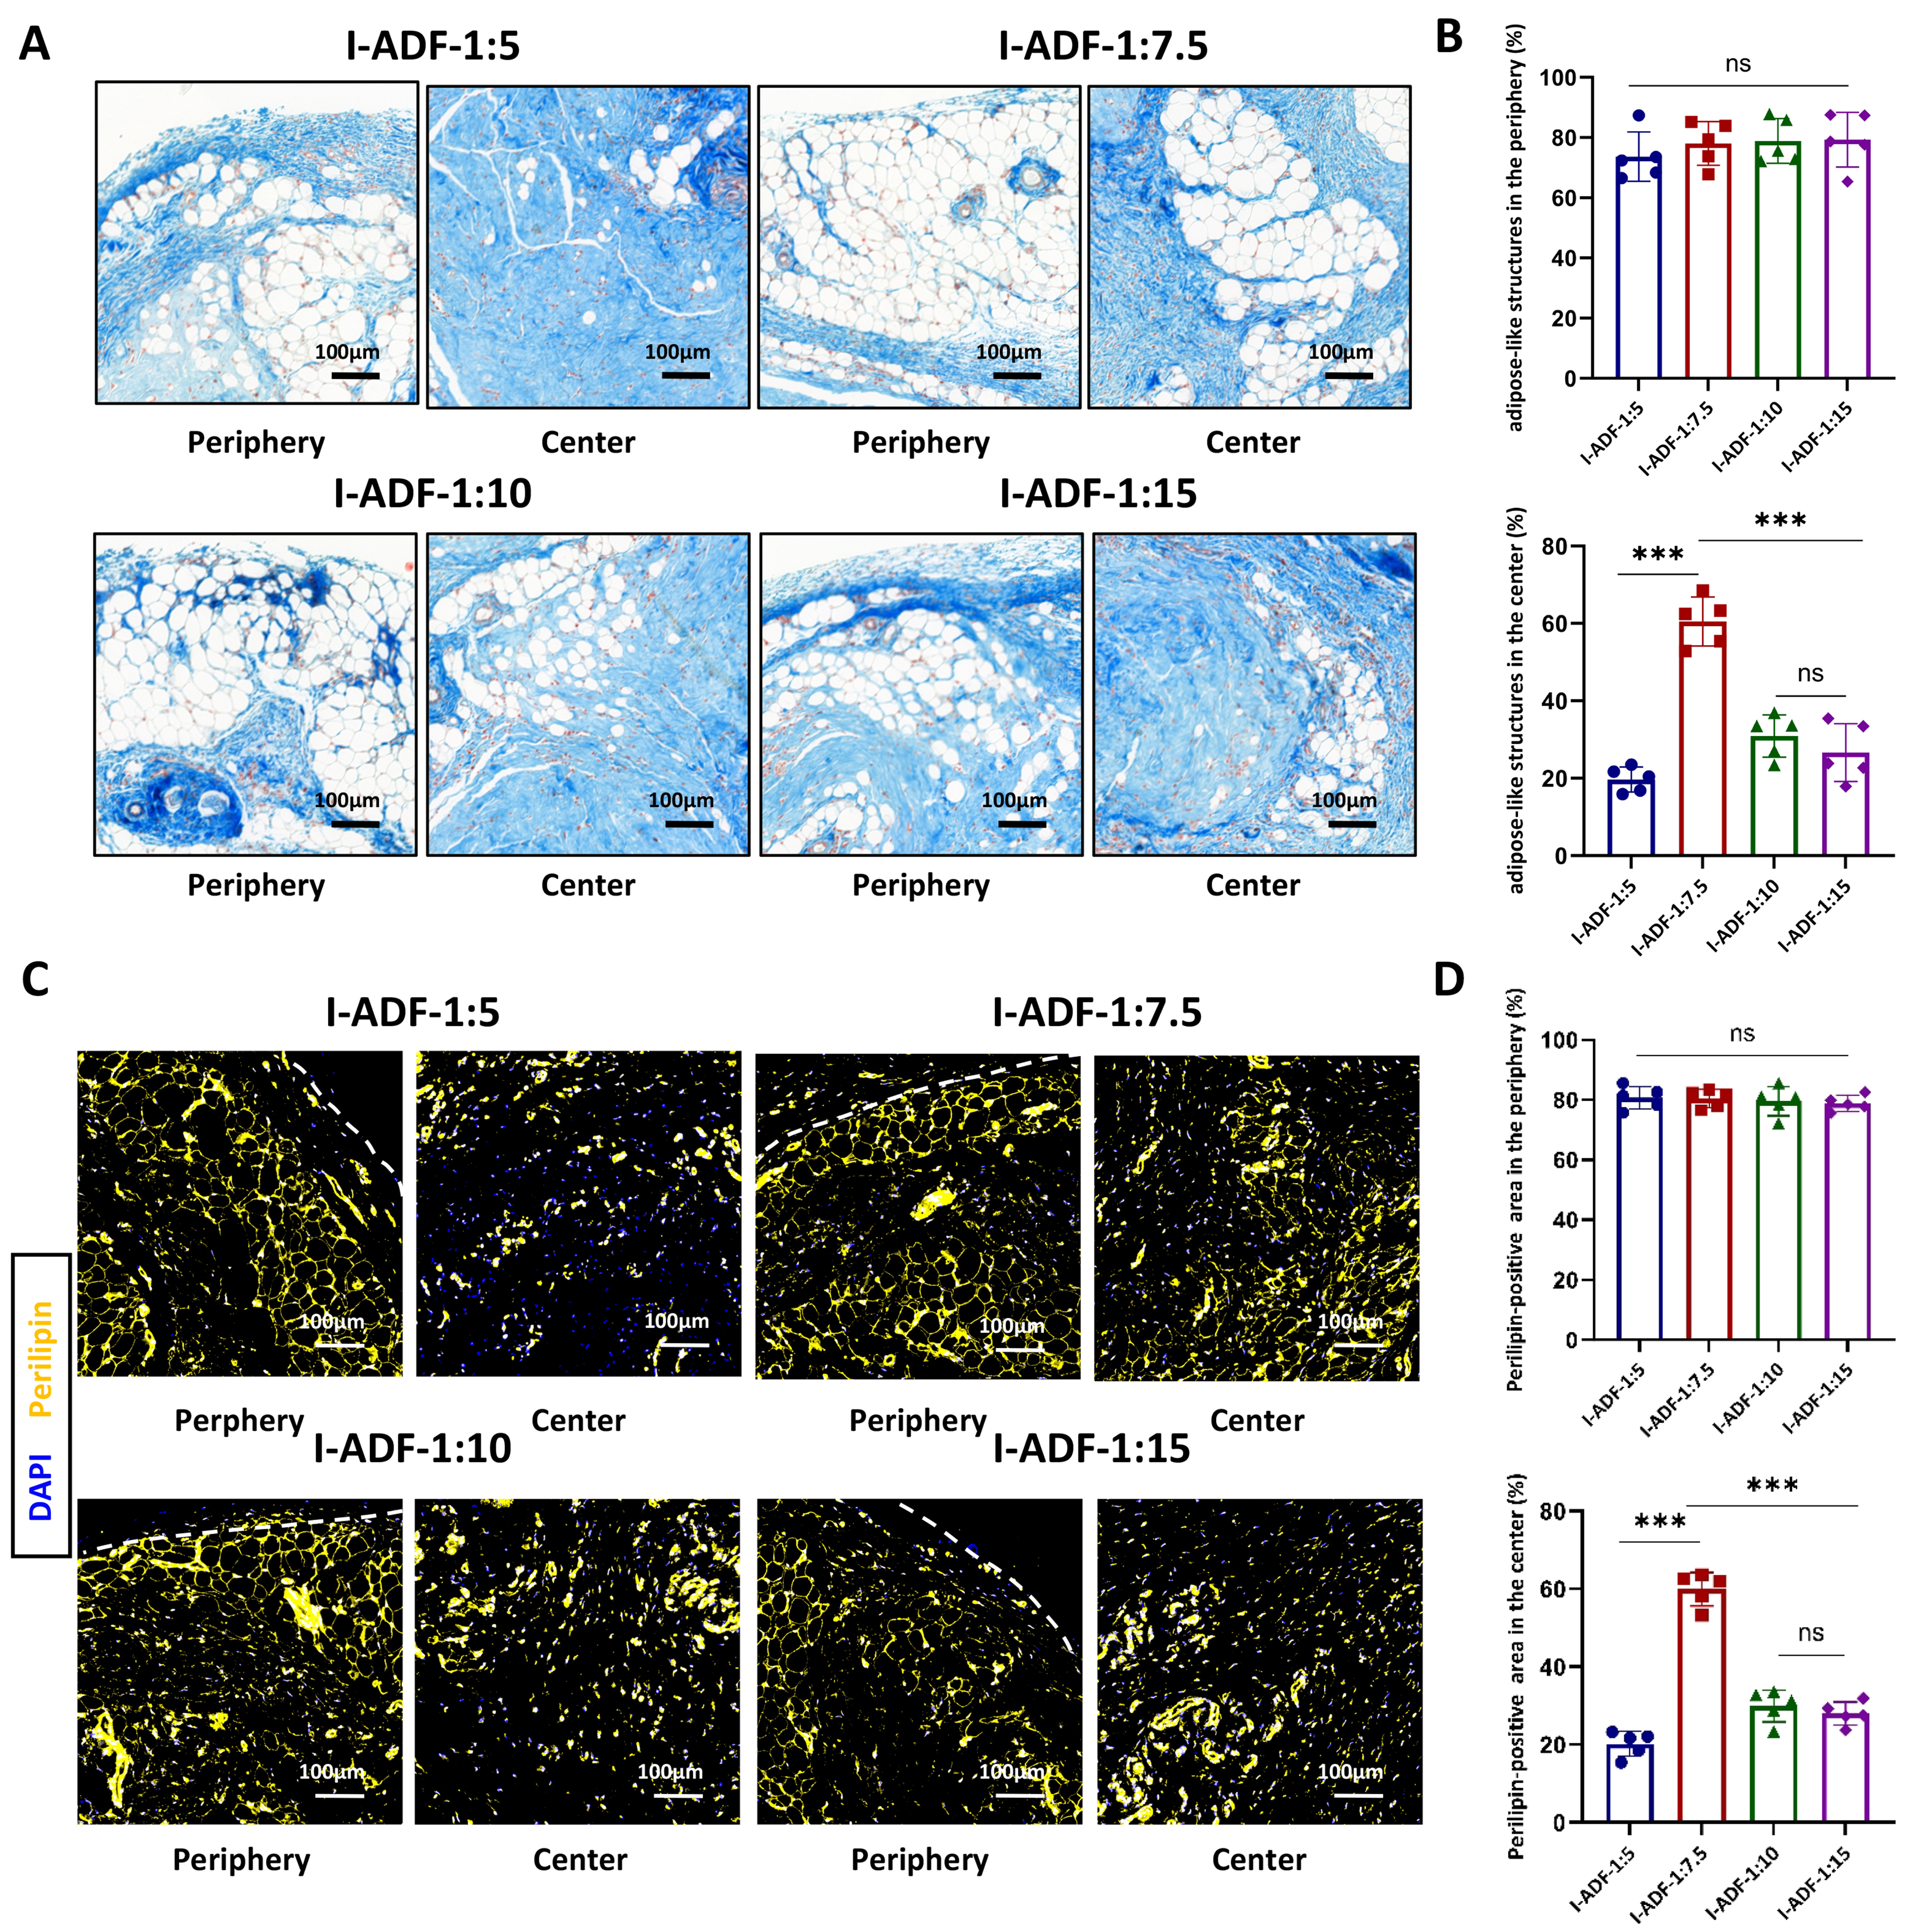
Figure 3. Masson’s trichrome staining and Perilipin immunofluorescence. (A) Representative Masson’s trichrome-stained images of the peripheral and central zones at week 12. Scale bars are shown in each micrograph and represent 100 μm; (B) Percentage of the analyzed area occupied by adipose-like structures in the peripheral and central zones, quantified from Masson’s trichrome-stained sections. The y-axis label “adipose-like structures (%)” denotes the percentage of the analyzed area rather than the number of individual structures; (C) Representative Perilipin immunofluorescence images of the peripheral and central zones at week 12. Scale bars are shown in each micrograph and represent 100 μm; (D) Quantification of the Perilipin-positive area in the peripheral and central zones. Data are presented as mean ± SD (n = 5 independent biological samples per group at week 12). The peripheral and central regions were quantified separately for each implant. Statistical comparisons were performed using one-way ANOVA followed by Tukey’s multiple-comparisons test. ***P < 0.001 vs. the I-ADF-1:7.5 group. ADF: Adipose-derived matrix film; I-ADF: injectable adipose-derived matrix film fragments; SD: standard deviation; ANOVA: analysis of variance; ns: not significant.