
fig2
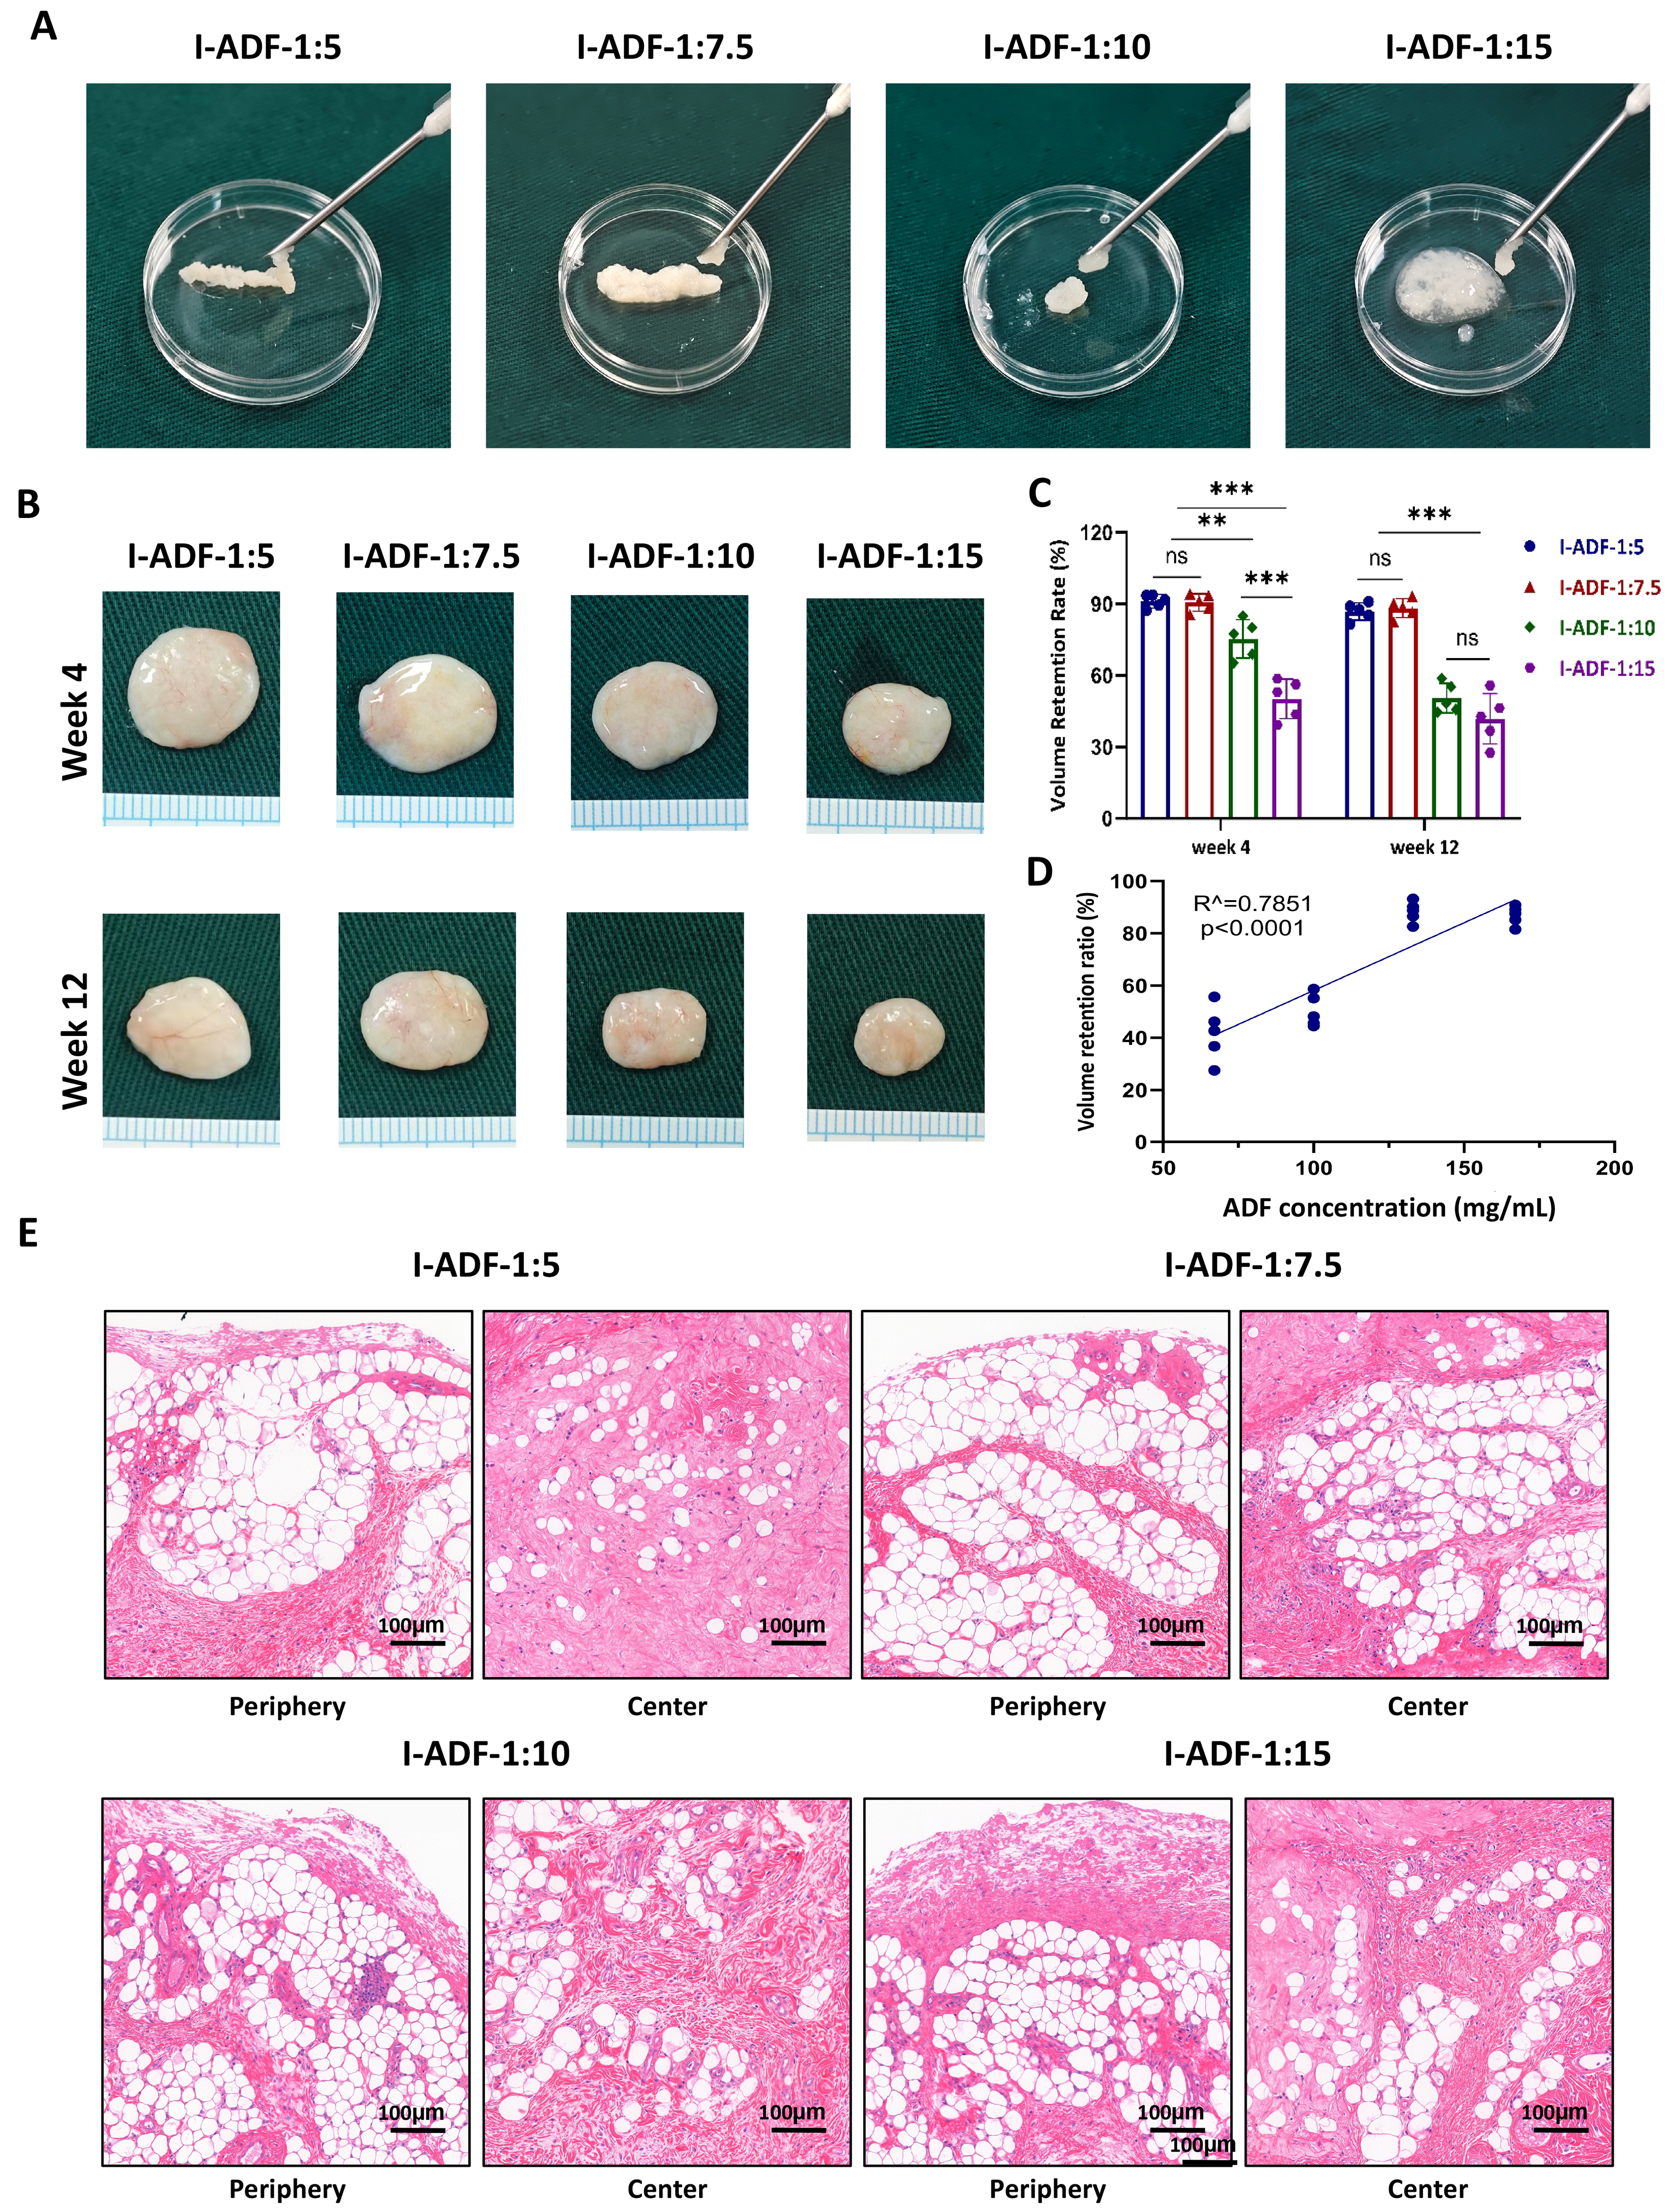
Figure 2. Qualitative extrusion behavior, volume retention, and concentration-retention relationship of I-ADF. (A) Representative images of manual I-ADF extrusion through a 17-gauge needle; (B) Representative gross images of I-ADF implants at weeks 4 and 12; (C) Quantitative volume retention at weeks 4 and 12. Data are presented as mean ± SD (n = 5 biological samples per group at each time point). Statistical comparisons among the four formulations were performed separately at weeks 4 and 12 using ordinary one-way ANOVA followed by Tukey’s multiple-comparisons test within each time point. No repeated-measures analysis or direct statistical comparison between the two time points was performed. **P < 0.01 and ***P < 0.001 for the selected pairwise comparisons indicated by the horizontal lines; (D) Relationship between ADF concentration and volume retention at week 12; (E) H&E staining of I-ADF implants at week 12. Scale bars are shown in each micrograph in (E) and represent 100 μm. ADF: Adipose-derived matrix film; I-ADF: injectable adipose-derived matrix film fragments; SD: standard deviation; ANOVA: analysis of variance; H&E: hematoxylin and eosin; ns: not significant.