


fig2
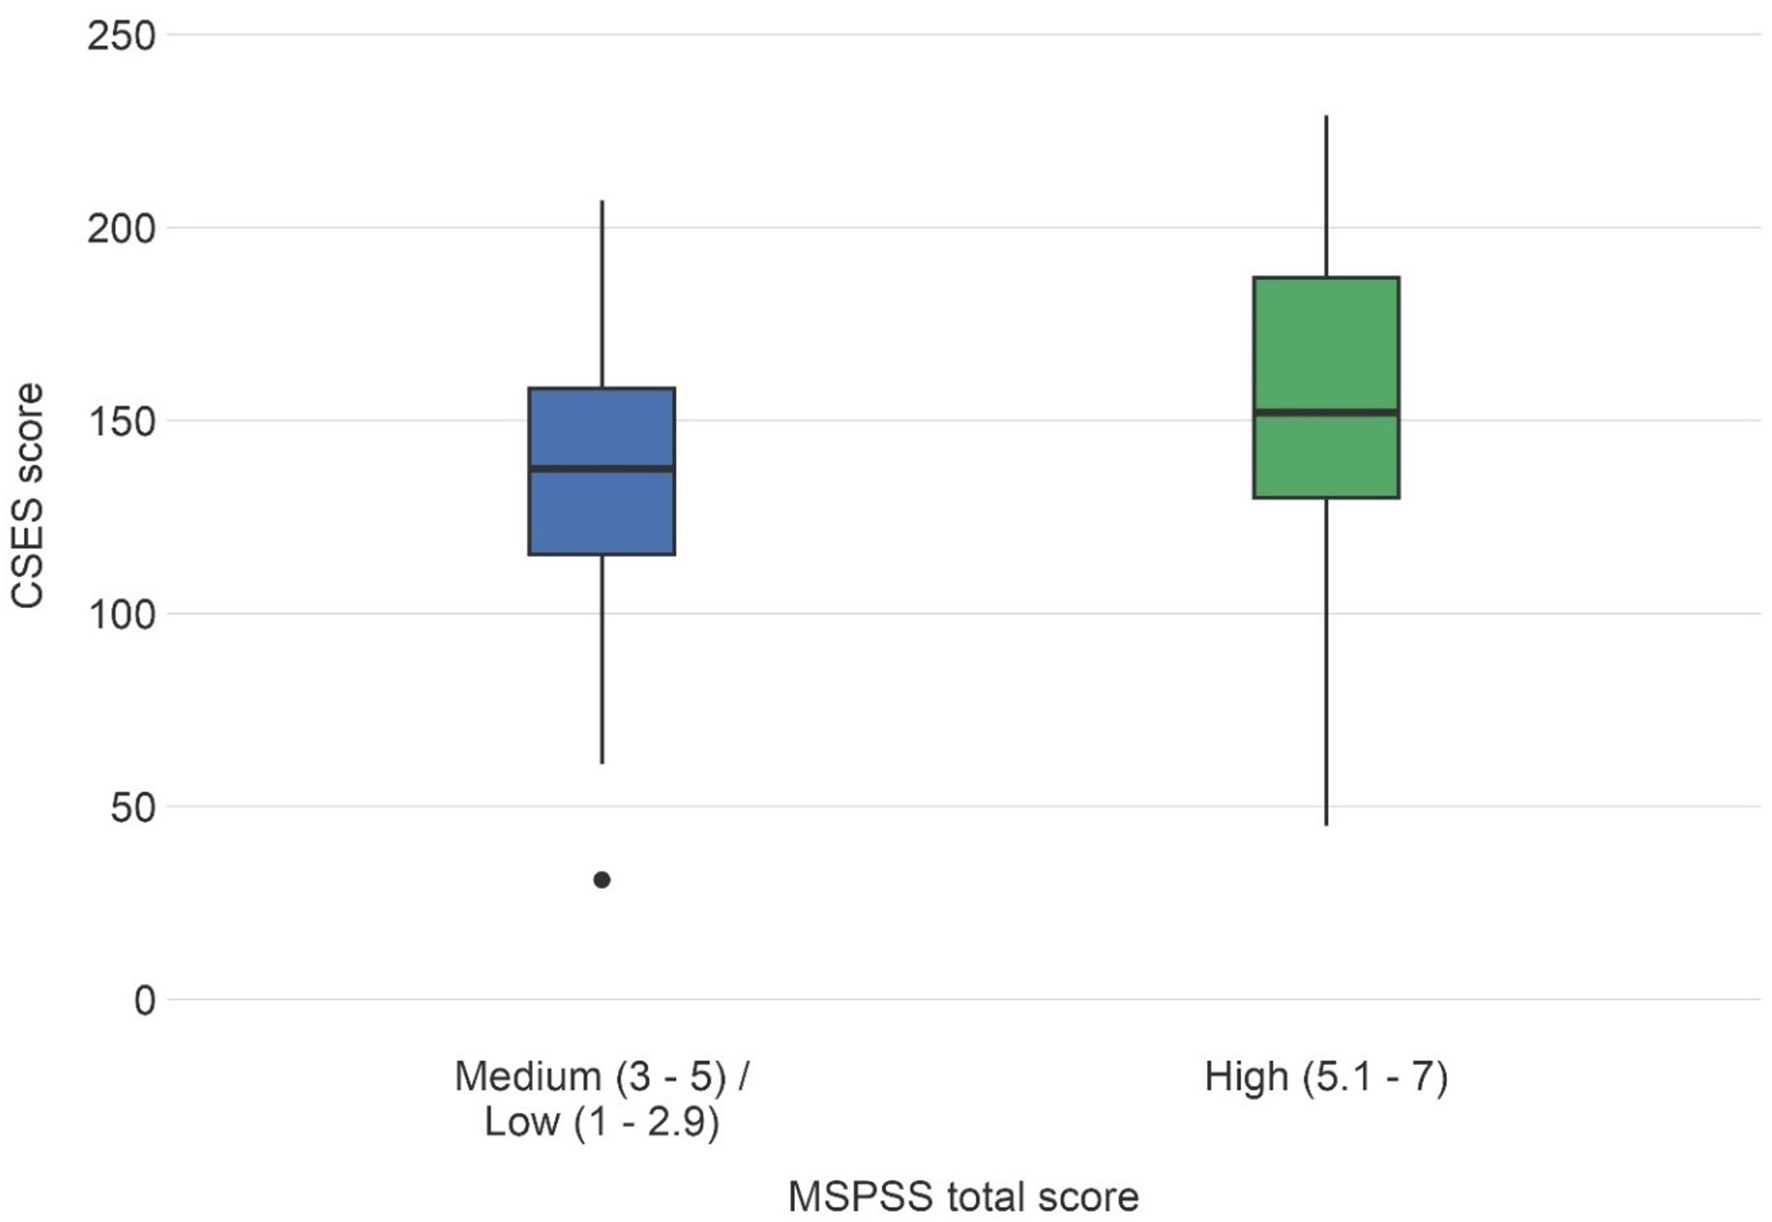
Figure 2. CSES scores by Perceived Social Support. Box and whisker plots demonstrate CSES scores separated by MSPSS scores categorized as low/medium vs. high. Significantly higher CSES scores were observed among respondents with high levels of perceived social support compared to those reporting low and medium perceived social support (P < 0.001). CSES: Coping Self-Efficacy Scale; MSPSS: Multidimensional Scale of Perceived Social Support.


