
Improving product redesign efficiency in the detailed design phase: a structure variation map based on customer environment requirements
 0
0  ,
, Abstract
Aim: The aim of this study is to shorten the product design and development cycle to meet the continuous change and growth of customer environmental requirements.
Methods: The applied research method introduces the concept of the inheritable structure of green products through structural similarity theory and quantitates environmental performance. Additionally, based on the analysis of the obtained customer ecological requirements, a hierarchical mapping method for customer requirements-environmental performance weight-product structure is proposed, which achieves the rapid mapping of customer requirements (CRs) to product structure in the product design process. Then, four mutation operation methods (combination, decomposition, replacement, and material change) are combined with a genetic algorithm, and a method for generating a product structure mutation map is proposed to solve the problem of the
Results: The case study showed that the overall mass of the rear derailleur dropped by 27.58 kg, and the environmental performance of the transmission was mainly related to its mass; hence, the proposed improvement method effectively improved the environmental performance of the transmission.
Conclusion: The hierarchical mapping method for customer requirements-environmental performance
Keywords
INTRODUCTION
With increasing customer environmental requirements (CERs), the speed of renewal of mechanical products is also accelerating; hence, designers are also updating the design of mechanical products. To meet different design requirements, designers need to improve the performance of new products (including environmental protection performance) based on the original products. This work is significant for product improvement and alternative design under the condition of ecological awareness.
The key to an enterprise winning the market is whether it can respond quickly to rapidly growing customer requirements (CRs) and reflect them in the product. Therefore, companies should determine the product structure that needs to be improved, reduce the product redesign time, and shorten the product design cycle. In recent years, requirements for the environmental performance of products have gradually attracted the attention of customers and designers. Therefore, combining the sustainable design idea with a CER analysis and processing method is very important for conducting CR analysis for sustainable design. At present, in terms of product demand analysis, current research is quite sufficient. Manesh et al. proposed a requirement analysis method for holonic manufacturing systems based on the virtual reality method, aiming to help designers of such systems throughout the system design and development process[1].
Although current research on CRs is relatively complete, most of the research focuses on requirements such as product performance, function, and appearance, whereas there is relatively little research on environmental requirements. Bereketli et al. proposed a multi-aspect QFD for environment (QFDE) to determine improvement strategies by considering not only the end users’ requirements but also the environmental stakeholders’ requirements[9]. Zhang et al. used the sensitivity analysis method to obtain the weights of various ecological design engineering parameters corresponding to CERs[10]. Younesi et al. proposed an integrated QFDE, fuzzy decision-making trial and evaluation laboratory, and fuzzy analytic network process for sustainable product design to help companies to identify the best design criteria for a specific product[11]. On the premise of a deteriorating environment, it is essential to analyze CERs. Considering the multi-faceted and uncertain characteristics of CERs, it is more challenging to conduct demand analysis directly[12]; hence, it is necessary to transform them into engineering features that can be used now. Yuan et al. proposed the concept of requirement units and their granularity to decompose the customer relationship model[13]. Gao et al. proposed a parameter transformation method of customer green requirement engineering based on data envelopment analysis and grey relational analysis[14]. Sheng et al. established the relationship between product modules and CRs, and transformed CRs into parameters that can be directly used in modular design[15]. Ma et al. proposed a new integrative, multidisciplinary CR modeling approach to capture and describe the common understanding of CRs[16]. Li et al. proposed a formal modeling method for cloud manufacturing service composition based on process calculus[17].
After obtaining the product engineering features or function, they need to be transformed into the description of the specific structure of the product. The mapping of product function to structure needs to be achieved. Cao et al. established the extended-effect driven function-behavior-structure and function design process based on this model to support functional recognition, function decomposition, and function-to-structure mapping[21]. They developed a computer-aided function design software system.
As a tool to improve the structure, product variant design has many research results. Bai et al. analyzed the correlation between the variation structure and inherent structure in product innovation design[24]. They proposed a structural variation design method based on inherent structure retrieval at the level of the design model. AlGeddawy et al. proposed a product platform design model, which can analyze each structure’s physical commonness, determine the product’s inherent structure, and obtain the typical characteristics of the variation structure[25]. Qiao et al. established a product structure knowledge base suitable for variant design, and determined the dynamic link between variant and inherent structures[26]. Gong et al. used the product module function extension transformation method and function-behavior-structure iteration mapping[27]. They adopted the correlation transformation method, effectively achieving the inherent module structure’s variation design. Tai et al. proposed two evolutionary optimization methods for the structural design of flexible mechanisms[28]. Generally, the current process of product design considering CRs is more complicated. The reason is that the design process also reconsiders factors that have no influence on the design result, which not only increases the overall design workload but also delays the design process. Existing mapping methods that convert CRs into environmental performance weights remain subjective and the mapping results are vulnerable to human factors. With current environmental problems becoming increasingly serious and people pursuing the environmental performance of products, it is of great importance to conduct research on the improvement of environmental performance in product improvement design, which can reduce the workload of redesign when new environmental requirements arise and improve R&D efficiency.
METHODS
To solve the above problems, in this study, similarity theory, which was proposed by Zhou, and environmental performance quantitative analysis are used to propose the concept of structure inheritability[29]. When improving a product, inheritable structures cannot participate in the structural improvement process, and the remainder of the structures that do not meet the requirements are only enhanced, which shortens the cycle of product redesign. Because product improvement is inseparable from CRs, in this study, a hierarchical mapping method for CRs-environmental performance weight-product structure is proposed to reduce the subjectivity and complexity in the product design process. The probability of mapping CRs to systems that need to be improved is obtained using hierarchical mapping. Four structural variation methods are proposed for the product structures that need to be improved, product structure variation maps are generated combined with a genetic algorithm (GA), and the structures are finally improved. The overall research scheme of the study is shown in Figure 1.

Figure 1. Overall research scheme.
INHERITABILITY OF GREEN PRODUCTS
Identification of the inheritability of the product structure
Definition 1: Structural element.
A structural element is the smallest unit that makes up a mechanical part or structure.
Definition 2: Structural element feature.
The structural element feature is the type of a specific structural element.
Definition 3: Common feature.
The common feature of structures refers to the common structural element features of two or more mechanical products.
Definition 4: Parent structure.
As shown in Figure 2, structural elements A1, B1, …, and N1 are called the parent structures of common feature 1, denoted by PC1.

Figure 2. Schematic diagram of product structure feature extraction.
Definition 5: Inheritable structure.
The common structural features of environmental performance that meet the criteria are called inheritable structures. As shown in Figure 2, after quantitative environmental performance analysis, common feature 1, which meets the standard, is called the inheritable structure of structural elements A1, B1, …, N1. The extraction of common features of products and the quantification of environmental performance are described in the following two sections.
The following criteria should be met when identifying the inheritance of the product structure:
(1) Functional criteria
To ensure the accuracy and rationality of evolutionary products, the inheritable structures should provide the function of the original parent structures.
(2) Structural criteria
The inherited and other structures in the parent structures should satisfy the interference minimization principle, and the connection relationship is universal.
(3) Sustainable criteria
Inherited products must conform to sustainable standards, including material selection, disassembly, recyclability, energy-saving, and environmental protection laws.
Extraction of common features of the product structure
Structural common feature extraction principle
Different structures have different common features, but generally, the extraction of common structural features meets the following criteria:
(1) Similarity criterion
The premise of extracting common features among different structures is that these structures satisfy the principle of similarity. In Section “3.2.2”, the assessment method for structural similarity is introduced in detail.
(2) Structural element criteria
The extracted common features must also be features of structural elements, and they can simultaneously reflect the original structural features.
The schematic diagram for structural common feature extraction is shown in Figure 2.
Structural similarity
Structural similarity is the premise of extracting the common features of structures. The steps for structural similarity analysis are as follows:
(1) Construct similar elements
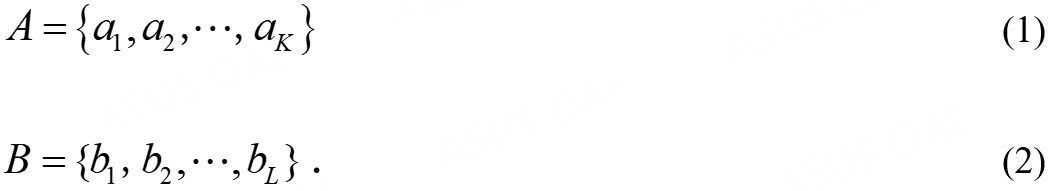
Suppose that system A consists of elements a1, a2, ..., aKand system B consists of elements b1, b2, ..., bL. Then, according to the relationship between the system and the set, the sets of elements in systems A and B are denoted by A and B, respectively:
If an element ai in system A and an element bj in system B form a similar element, it is recorded as a set u:

Similarly, N similar element sets constitute a set U:

According to intersection theory, we obtain

(2) Quantitative analysis of similar features
The similarity degree of similar elements is a function of the number of similar features and the similarity ratio of eigenvalues among elements. Assuming that the k features of element ai constitute set a and the l features of element bi constitute set b, according to set theory, the set of similar features between elements ai and bi is the intersection u of set a and set b:

The union s represents the set of all features of elements ai and bi:

The number of elements in set a is defined as #(a), the number of elements inset b is defined as #(b), the number of elements in set u is defined as #(a ∩ b), and the number of elements in set s is defined as

Therefore, there are similar feature numbers, as follows:

The cardinality of set s is #(s) = #(a ∪ b) = #(a) + #(b) - #(u), and the similarity of similar feature numbers is recorded as q(ui)n; it can be expressed as

Assume that the numbers of features of similar elements ai and bi are k and l, respectively. Let the number of features of similar element ai be equal to k and the number of features of bi be equal to l. The number of all features satisfies #(a ∪ b) = k + l - n and the similarity of the number of features is expressed as

(3) Calculation of the feature similarity degree
Assuming that similar elements have n similar features, combined with similar feature metrics, the proportional coefficients of n eigenvalues for the ith similar element can be recorded as
ri1, ri2, ..., rin.
Considering the different effects of each feature on similar elements, taking the weights of features as d1, d2, ..., dn, the weights are determined by referring to the method of determining the weights of fuzzy similarity elements. Then, the similarity degree of multiple features of similar elements is recorded as q(ui)s, and the results are as follows:

When the similar element value and eigenvalues can be processed accurately, the exact similarity element value q(ui) can be calculated by referring to the typical merging algorithm as follows:

Where 0 ≤ q(ui) ≤ 1, 0 ≤ dj ≤ 1, ∑dj= 1,
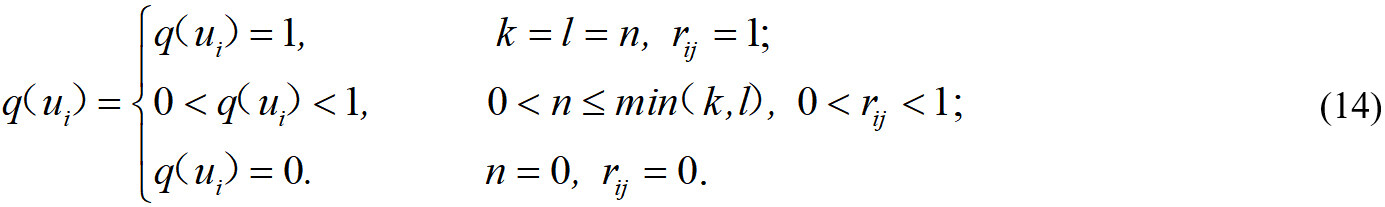
The values of similar elements can be determined as follows:
When q(ui) = 1, this indicates that similar elements are equal.
When 0 < q(ui) < 1, q(ui) represents the similarity degree of elements.
When q(ui) = 0, the elements are different.
Quantitative analysis of the product structure and environmental performance
To optimize the environmental performance of the product, it is necessary to conduct a quantitative analysis of environmental performance. Simultaneously, the quantitative analysis of environmental performance for the product structure is a prerequisite for the inheritability of product structures. In this study, typical environmental performance indicators, such as dismantling, recycling, and toxic substance content of the transmission shells, are analyzed.
As a set of gearshift devices used to coordinate the engine speed and the actual speed of the wheel, the transmission is used to fully achieve the engine’s best performance. The transmission can produce different transmission ratios between the engine and the wheel during the driving process of the vehicle. The machine can work in its best dynamic performance state as a result of shifting gears. Additionally, the transmission shell is an essential component for carrying complex internal parts and plays a vital role in the design of a product. When considering the sustainable design of the transmission shell, the first step is to consider its disassembly performance. Compared to poor disassembly performance, good disassembly performance means simple disassembly process, less energy consumption and less pollution, recycling performance should be regarded during disassembly because the parts obtained from disassembly are mainly used for recycling. Finally, researchers should consider the content of toxic substances. If the toxic substance content is too high, it will cause great harm to the environment or the human body after abandonment. This is the reason that these three indicators were chosen as environmental indicators in this study.
Disassembly performance
Compared to poor disassembly performance, good disassembly performance means the product has less environmental impact during disassembly. In this study, disassembly performance is quantified from the following indicators: disassembly time, disassembly tools, disassembly fixture, structural accessibility, disassembly technical difficulty, toxicity prevention in disassembly, and disassembly force. The specific quantitative indicators are shown in Table 1.
Disassembly performance indicator quantization
| Index | Evaluation scale | |||||
| 25 | 20 | 15 | 10 | 5 | 0 | |
| Disassembly time | < 5 s | 25 s | 50 s | 90 s | 140 s | > 210 s |
| Disassembly tool | Unnecessary | Simple | Complex | Manufacturers provide | Special | Temporary |
| Disassembly fixture | Unnecessary | Single-handedly | Both hands | Pliers | Capstan | Complex machine |
| Structural accessibility | Along the Z axis | X/Y axis | Depth is greater than 38 cm | From the bottom | Two-way | Invisible |
| Disassembly technology difficulty | Unnecessary | < 20 s | < 30 s | Technical discussion | Contact with the original manufacturer | Professional training |
| Toxicity prevention in disassembly | \ | Glove | Mask | Special overalls | Air supply | Isolation |
| Disassembly force | Unnecessary | A small amount of force | Positive force | Leverage | Low-impact force | High-impact force |
The disassembly performance quantification formula is

where GP1 is the quantitative index of structural unit disassembly performance; wj is the weight value of the j-th index of the structural unit, which is given by the expert; and Si is the evaluation scale of the i-th index of the structural unit.
Recycling performance
From the life-cycle perspective, the product structure’s recycling performance is mainly reflected in the environmental impact on parts, materials, and non-renewable resources. Good recycling performance means the maximum recycling of features and materials, and non-renewable resources have a minimal ecological impact. The recycling method for the product structure and the primary considerations are shown in Table 2.
Recycling methods for the product structure and the main considerations
| Resource classification | Recycling method | Recycling index | Key elements | Description |
| Renewable resource | Parts recycling and reuse | 8 | Service life of parts | The service life of the components in the structural unit is as close as possible to facilitate the overall recycling and reuse of the structural unit |
| Material recycling | 6 | Material compatibility | Components with good compatibility can be classified into one group in order to facilitate the overall recycling of component materials | |
| Recycling economy | Components with detailed recycling value are grouped into one group to recycle materials with high value as far as possible, so as to improve the efficiency of product recycling | |||
| Non-renewable resources | Incineration | 3 | Waste | Many environmentally harmful wastes are produced during incineration |
| Energy | The energy produced by incineration can be utilized, and the | |||
| Waste and landfill | 1 | Environmental impact of waste | After waste or landfill, the impact of materials on the environment is generally negative. Components with little impact on the environment should be selected as far as possible for wasting or landfilling |
The structural unit recycling performance quantification formula is

where GP2 is the structural unit recycling performance; wj is the weight value of the structural unit recycling factor j; Si is the evaluation value of the recycling factor; and m is the number of recycling factors involved in the recycling of the structural unit.
Toxic substance content
Toxic substances are evaluated and quantified according to the content range of the substances. Table 3 is the quantitative table of toxic substances.
Quantitative table of toxic substances
| Evaluation index | Evaluation score | ||||
| 1 | 3 | 5 | 7 | 9 | |
| Content of toxic substances (ppm) | > 1000 | 1000~500 | 500~200 | 200~100 | < 100 |
GENERATION METHOD FOR THE PRODUCT STRUCTURE VARIATION MAP
The inheritable and non-inheritable structures of products can be obtained by judging the inheritability of products, including the extraction of common features of the product structure and quantitative analysis of environmental performance. Because of the non-inheritable structure, a method is proposed in this study to generate a product structure variation map. From the perspective of CERs, through mapping the requirements to the structure, the structure that impacts the environment is redesigned (variation). Finally, a variation map is generated that enables product improvement.
Mapping CERs to the product structure
The inheritable structure is obtained by analyzing the inheritability of the green product structure. For the remaining non-inherited structure, the product structure needs to be improved to meet the CERs. Before the structural improvement, the relationship between the CERs and the structure that needs improvement should be determined. In this study, a hierarchical mapping method for “CRs- environmental performance weights-product structure” is proposed. The steps are as follows:
Transformation of CERs to environmental performance weights:
First, the fuzzy analytic hierarchy process (FAHP) is used to determine the importance of CRs
The relationship between CERs and environmental performance weights is established based on data mining: a multi-layer perceptron neural network model is used to simulate the mapping process from CR data to environmental performance weights. After the model is established successfully, the ecological performance weights can be obtained quickly when new requirements are input.
Mapping environmental performance weights to structures: The mapping of environmental performance weights to structures can be expressed as
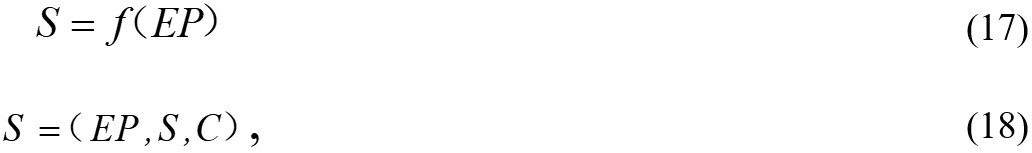
where S represents the product structure set, and the output from environmental performance to the product structure may have multiple results or may be an empty set; f represents the solution process; environmental performance EP and structure S are used as inputs to the solution process, which results in a product that meets environmental performance requirements in addition to structural requirements; and C represents the basis for judging the validity of the mapping process.
Product structure features are key to the mapping relationship between environmental performance and structure. In this study, mapping rules are established for environmental performance requirements and product structure features based on the idea of similar matching between environmental performance and structure. The mapping steps are as follows:
First, the scope of environmental performance is determined, that is, whether disassembly performance is the disassembly performance of the product or a part, and whether recycling performance refers to the recycling performance of the material or the part. The range of environmental performance is represented by set EP = {EP1, EP2, ..., EPn}, where EPi is environmental performance.
After identifying the environmental performance features, the corresponding part feature matrix
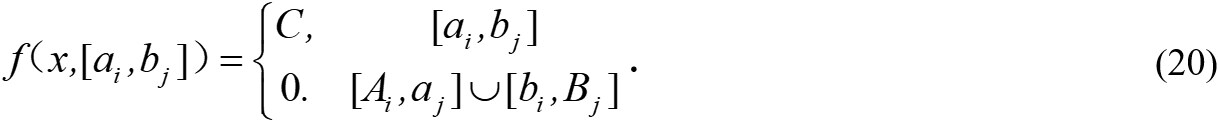
The probability matrix from environmental performance to the structure is constructed. In this study, the improved method proposed by Ma is used[30]:
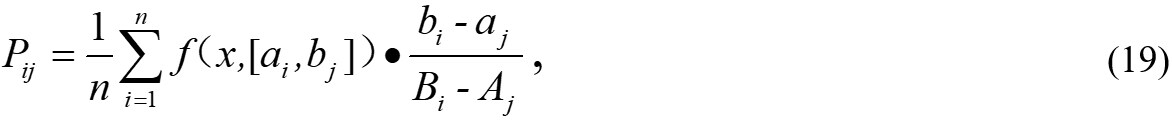
where [ai, bj] is the numerical range mapped to a structure for a certain type of environmental performance, which is determined by expert scoring; [Ai, Bj] is the largest numerical range available for a certain type of environmental performance, which is defined as [0, 1]; n is the number of expert matrices; and f (x, [ai, bj]) is the mapping from environmental performance to the structure, and then
The weight matrix WEP for environmental performance and the environmental performance structure probability matrix Mp(pij) can be used to achieve the qualitative mapping of environmental performance to the structure. The mapping result is that each structure has a certain amount of environmental impact. If the mapping matrix is set as Mf, the formula is

Generation process for the structural variation map
Variation operation expression method
Designers can improve product environmental performance by changing the local structure or material properties of existing components. In this study, four structural variation expressions are proposed: combination variation, decomposition variation, replacement variation, and material-changing variation.
The essence of combined variation is to add new structural features to the original structural features, and the generated new features inherit all the information of the original features. The variation method is mainly used for the addition and subtraction of parts, and to improve the ability of disassembly and recycling.
Decomposition variation is the inverse process of combination variation, and divides an original part into several parts according to a particular method. Unlike combination variation, the structural features formed by decomposition not only inherit the original parts’ structural features but also produce new features. Decomposition variation is mainly used to improve the parts’ machinability, disassembly, and recycling performance.
The replacement variation of structural units refers to replacing structural units that exist in parts with new structural units. The new structure completely inherits the Boolean operation in the original part and its dependence on the adjacent structure. Material-changing variation is a product structure variation method that changes the material of the part, and

where MAT is the material, m_id represents the unique identification of the material, m_dens is the density, m_E is the elastic modulus, m_ems is the waste produced by the production of this unit of mass, and m_manu is the machinability of the material.
Structural variation based on a GA
In this study, a GA is selected as a variation algorithm, and the specific process is as follows:
Code: Complete coding involves the physical structure and coding structure of the genome, which together determine the phenotype of the gene.
Set the operating parameters: The crossover factor is set to (0.4, 0.99); variation factor is set to (0.0001, 0.1); population size is set to (100, 200); and number of iterations is set to 120. Different evolutionary approaches use various genetic manipulations.
Generate the initial population: The Rand function in MATLAB generates individuals randomly as the initial population.
Fitness function: The measure of individual fitness is the fitness function. The better the fitness of individuals, the more likely they are to be retained. To ensure that fitness is a non-negative value, the following two methods are usually used to construct the fitness function:
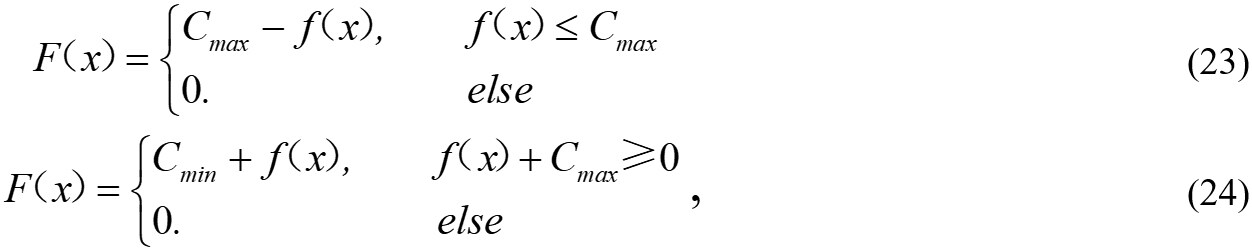
where Cmin is the minimum value of the current GA, Cmax is the maximum value of the current GA, F(x) is the fitness function, and f(x) is the objective function.
Product variation improvement aims to improve the product’s environmental performance; hence, the objective function  is constructed as the fitness function, where xi is the number of evolutionary structures, and fi is the influencing factor of the evolutionary structure and environmental performance.
Terminating evolution: In this study, the termination of evolution is selected in the 120th generation. After the above steps, the product structure variation map is finally generated. The schematic diagram is shown in Figure 3.

Figure 3. Schematic diagram of structural variation map generation.
CASE STUDY
As shown in Figure 4, there are two common types of transmission shells, and there are some structural differences in the details between the two shells.

Figure 4. Two types of transmission shell models A and B.
Structural similarity analysis
First, it is necessary to refine the structure of transmission shells A and B. The results of structural refinement are shown in Tables 4 and 5, respectively.
Structure table for transmission shell A
| Structural unit | Definition | Parameters | Structure | Feature collections |
 | Upper panel ring (AS1) | Radius of outer circle is 45 mm; thickness is 8 mm; width is | Ring structure | A1 = (45, 8, 8) |
 | Left panel platform 1 (Removal structure) (AS2) | Radius is 40 mm; thickness is 8 mm; material is steel;weight is 0.316 kg | Block structure | A2 = (40, 8) |
 | Back-wall panel (AS3) | Length, width and height: 296, 196, 8 mm; material is steel; weight is 3.643 kg | Plate structure | A3 = (296, 196, 8) |
 | Left and right panels (AS4) | The left side is 285 mm; right side is 212 mm; top side length is 342 mm; thickness is 8 mm; material is steel; weight is | Plate structure | A4 = (285, 212, 320, 8) |
 | Left panel platform 2 (Removal structure) (AS5) | Radius is 30 mm; thickness is 5 mm; material is steel;weight is 0.178 kg | Block structure | A5 = (30, 8) |
 | Lower panel (AS6) | Length, width and height: 512, 196, 8 mm; material is steel; weight is 9.85 kg | Plate structure | A6 = (512, 196, 8) |
 | Upper panel (Removal structure) (AS7) | Length, width and height: 326, 202, 12 mm; material is steel; weight is 6.203 kg | Plate structure | A7 = (326, 202, 12) |
 | Upper panel 1 (AS8) | Length, width and height: 196, 110, 8 mm; material is steel; weight is 1.354 kg | Plate structure | A8 = (196, 110, 8) |
 | Upper panel 2 (AS9) | Length, width and height: 178, 119, 20 mm; material is steel; weight is 3.326 kg | Plate structure | A9 = (178, 119, 20) |
 | Left irregular panel (Removal structure) (AS10) | Thickness is 8 mm; material is steel; weight is 3.177 kg | Plate structure | A10 = (8) |
 | Front panel (Removal structure) (AS11) | Length, width and height: 205, 178, 10 mm; material is steel; weight is 3.177 kg | Plate structure | A11 = (205, 178, 10) |
Structure table for transmission shell B
| Structural unit | Definition | Parameters | Structure | Feature collections |
 | Upper panel ring (BS1) | Radius of tangential circle is 45 mm; thickness is 6 mm; width is 8 mm; material is steel; weight is 0.114 kg | Ring structure | B1 = (45, 6, 8) |
 | Left panel platform 1 (Removal structure) (BS2) | Radius is 64 mm; thickness is 7.6 mm; material is steel; weight is 0.768 kg | Block structure | B2 = (64, 7.6) |
 | Back-wall panel (BS3) | Length, width and height: 296, 196, 7.6 mm; material is steel; weight is 3.461 kg | Plate structure | B3 = (296, 196, 7.6) |
 | Left and right panels (BS4) | The left side is 307 mm; right side length is 232 mm; top side is 320 mm; thickness is 7.6 mm; material is steel; weight is | Plate structure | B4 = (307, 232, 320, 7.6) |
 | Left panel platform 2 (Removal structure) (BS5) | Radius is 60 mm; thickness is 7.6 mm; material is steel; weight is 0.675 kg | Block structure | B5 = (60, 7.6) |
 | Lower panel (BS6) | Length, width and height: 544, 218, 7.6 mm; material is steel; weight is 9.104 kg | Plate structure | B6 = (544, 218, 7.6) |
 | Upper panel (Removal structure) (BS7) | Length, width and height: 320, 218, 16 mm; material is steel; weight is 8.762 kg | Plate structure | B7 = (320, 218, 16) |
 | Upper panel 1 (BS8) | Length, width and height: 202, 110, 7.6 mm; material is steel; weight is 1.326 kg | Plate structure | B8 = (202, 110, 7.6) |
 | Upper panel 2 (BS9) | Length, width and height: 140, 110, 28 mm; material is steel; weight is 3.385 kg | Plate structure | B9 = (140, 110, 28) |
 | Left irregular panel (Removal structure) (BS10) | Thickness is 7.6 mm; steel; weight is 3.018 kg | Plate structure | B10 = (7.6) |
 | Front panel (Removal structure) (BS11) | Length, width and height: 176, 160, 15 mm; material is steel; weight is 3.316 kg | Plate structure | B11 = (176, 160, 15) |
Assume that the corresponding structures of the two transmissions A and B constitute similar elements: u1, u2,…,u10; the degrees of influence d of each similar element value are equal. According to formula 9, the values of similar elements of corresponding structures are calculated as shown in Table 6.
Values of similar elements of corresponding structures
| Similar element | Value | Similar element | Value |
| q(u1) | 0.943 | q(u7) | 0.929 |
| q(u2) | 0.924 | q(u8) | 0.982 |
| q(u3) | 0.998 | q(u9) | 0.875 |
| q(u4) | 0.826 | q(u10) | 0.984 |
| q(u5) | 0.871 | q(u11) | 0.813 |
| q(u6) | 0.872 |
Structural common feature extraction
According to Section “2.2.1”, the common features of transmission shells A and B are extracted, and the results are shown in Table 7.
Common features of transmission shells A and B
| Similarity unit | Definition | Structure | Similarity unit | Definition | Structure |
| U1 | Ring structure |  | U7 | Plate structure |  |
| U2 | Block structure |  | U8 | Plate structure |  |
| U3 | Plate structure |  | U10 | Plate structure |  |
Quantitative analysis of the environmental performance of the common structures
According to Section “2.3”, the environmental performance of the common structures is quantitatively analyzed, and the results are shown in Table 8.
Quantitative results of environmental performance
| Index | Unit | |||||
| U1 | U2 | U3 | U7 | U8 | U10 | |
| Disassembly performance | 2.26 | 2.02 | 4.54 | 4.23 | 4.26 | 2.15 |
| Recycling performance | 2.27 | 1.95 | 4.62 | 4.02 | 4.15 | 2.12 |
| Toxic substances content | 5 | 5 | 9 | 7 | 7 | 5 |
Judgment of the inheritability of the product structure
According to the judgment method in Section "2.1", the conclusion is that the common structures of U3, U7, and U8 can be inherited. If the common structures need to be improved in the future, only U1, U2, and U10 need to be improved. The remaining non-commonality structures need to be enhanced separately.
Hierarchical mapping of CERs to structures
Transformation from CERs to environmental performance
After collection and analysis, the customer’s initial environmental requirement set is {low toxicity, less material consumption, easy to recycle, high-cost performance, easy disassembly, low energy consumption}. The importance of CRs is determined using FAHP, as shown in Table 9. Then the QFDE house of quality is constructed to determine the environmental performance weight.
Environmental requirements of customer A
| Customer requirements | Low toxicity | Less material consumption | Easy to recycle | High cost performance | Easy to disassemble | Low energy consumption |
| Score | 1 | 3 | 5 | 5 | 7 | 9 |
The priority relation matrix F and the fuzzy consistency matrix W are obtained using the fuzzy consistency processing of CRs:
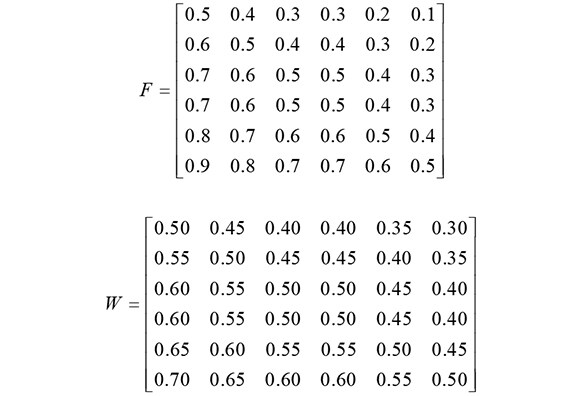
The importance of the CERs can be obtained by normalization. They are 0.127, 0.147, 0.167, 0.167, 0.187, and 0.207, respectively.
Based on the importance of CERs, the house of quality for the transmission shell is established, and the corresponding environmental performance weights are calculated. (0, 1, 3, 5) denotes the degree of correlation between CERs and environmental performance weights, where 1 means unrelated, 2 means weakly correlated, 3 means generally correlated, and 4 means strongly correlated. The transformation of CERs to environmental performance weights is established, and its house of quality is shown in Table 10.
Customer A’s house of quality for the transmission shell
| CRs | Importance of CERs | Environmental performance | |||||||
| Material category | Material consumption | Parts recycle rate | Material toxicity | Toxicity of cutting fluid | Environmental properties of materials | Degree of difficulty in structural disassembly | Structural and technological properties | ||
| Low toxicity | 0.127 | 1 | 0 | 0 | 5 | 3 | 3 | 0 | 1 |
| Less material consumption | 0.147 | 3 | 5 | 0 | 0 | 0 | 1 | 0 | 3 |
| Easy to recycle | 0.167 | 3 | 1 | 5 | 3 | 0 | 3 | 3 | 3 |
| High cost performance | 0.167 | 1 | 3 | 1 | 0 | 0 | 3 | 1 | 1 |
| Easy to disassemble | 0.187 | 1 | 0 | 1 | 0 | 0 | 0 | 5 | 5 |
| Low energy consumption | 0.207 | 1 | 3 | 0 | 0 | 0 | 3 | 1 | 3 |
| Environmental performance weight | 1.63 | 2.02 | 1.19 | 1.13 | 0.38 | 2.15 | 1.81 | 2.79 | |
The corresponding relationship between customer A’s requirement data and the environmental performance weight is obtained as follows:
(CED,EPW) = {(1, 3, 5, 5, 7, 9), (1.63, 2.02, 1.19, 1.13, 0.38, 2.15, 1.81, 2.79)}.
Taking CRs as input and the environmental performance weight as output, the sample dataset is constructed by recollecting and reorganizing data, as shown in Tables 11 and 12.
Sample dataset of CERs
| Low toxicity | Less material consumption | Easy to recycle | High cost performance | Easy to disassemble | Low energy consumption |
| 3.00 | 1.00 | 3.00 | 7.00 | 9.00 | 1.00 |
| 3.00 | 1.00 | 5.00 | 5.00 | 7.00 | 9.00 |
| 1.00 | 3.00 | 5.00 | 5.00 | 7.00 | 9.00 |
| 1.00 | 9.00 | 3.00 | 5.00 | 7.00 | 3.00 |
| 5.00 | 1.00 | 9.00 | 9.00 | 3.00 | 5.00 |
| 5.00 | 9.00 | 7.00 | 9.00 | 5.00 | 7.00 |
| 7.00 | 9.00 | 1.00 | 9.00 | 5.00 | 5.00 |
| 5.00 | 7.00 | 7.00 | 9.00 | 7.00 | 5.00 |
| 3.00 | 7.00 | 9.00 | 7.00 | 1.00 | 3.00 |
| 5.00 | 7.00 | 7.00 | 9.00 | 1.00 | 7.00 |
| 1.00 | 9.00 | 1.00 | 7.00 | 9.00 | 1.00 |
| 1.00 | 7.00 | 7.00 | 1.00 | 1.00 | 5.00 |
| 5.00 | 3.00 | 3.00 | 9.00 | 9.00 | 3.00 |
| 7.00 | 1.00 | 9.00 | 1.00 | 1.00 | 5.00 |
| 1.00 | 9.00 | 7.00 | 1.00 | 9.00 | 5.00 |
| 5.00 | 1.00 | 7.00 | 5.00 | 9.00 | 5.00 |
| 5.00 | 3.00 | 7.00 | 1.00 | 5.00 | 5.00 |
| 1.00 | 7.00 | 3.00 | 5.00 | 7.00 | 9.00 |
| 5.00 | 9.00 | 3.00 | 9.00 | 5.00 | 7.00 |
| 3.00 | 1.00 | 3.00 | 3.00 | 7.00 | 9.00 |
| 3.00 | 9.00 | 5.00 | 9.00 | 3.00 | 3.00 |
| 7.00 | 1.00 | 5.00 | 1.00 | 7.00 | 1.00 |
Sample dataset of environmental performance
| Material category | Material consumption | Parts recycling rate | Material toxicity | Toxicity of cutting fluid | Environmental properties of materials | Degree of difficulty in structural disassembly | Structural and technological Properties |
| 1.59 | 1.84 | 1.20 | 1.25 | 0.47 | 2.08 | 1.89 | 2.73 |
| 1.59 | 1.92 | 1.19 | 1.23 | 0.44 | 2.19 | 1.81 | 2.75 |
| 1.63 | 2.02 | 1.19 | 1.13 | 0.38 | 2.15 | 1.81 | 2.79 |
| 1.72 | 2.16 | 1.11 | 1.10 | 0.39 | 2.01 | 1.72 | 2.78 |
| 1.65 | 1.92 | 1.36 | 1.43 | 0.49 | 2.32 | 1.69 | 2.55 |
| 1.71 | 2.16 | 1.17 | 1.23 | 0.44 | 2.19 | 1.59 | 2.63 |
| 1.63 | 2.16 | 0.94 | 1.23 | 0.53 | 2.14 | 1.49 | 2.57 |
| 1.68 | 2.04 | 1.21 | 1.26 | 0.45 | 2.15 | 1.70 | 2.66 |
| 1.79 | 2.14 | 1.35 | 1.35 | 0.44 | 2.25 | 1.59 | 2.59 |
| 1.71 | 2.18 | 1.20 | 1.31 | 0.47 | 2.30 | 1.49 | 2.53 |
| 1.68 | 2.14 | 1.05 | 1.04 | 0.39 | 1.95 | 1.76 | 2.78 |
| 1.80 | 2.16 | 1.28 | 1.30 | 0.42 | 2.18 | 1.62 | 2.72 |
| 1.57 | 1.90 | 1.12 | 1.25 | 0.49 | 2.10 | 1.79 | 2.67 |
| 1.71 | 1.84 | 1.36 | 1.63 | 0.59 | 2.32 | 1.65 | 2.61 |
| 1.77 | 2.06 | 1.24 | 1.17 | 0.37 | 1.98 | 1.85 | 2.91 |
| 1.61 | 1.78 | 1.28 | 1.37 | 0.49 | 2.14 | 1.89 | 2.75 |
| 1.69 | 1.88 | 1.27 | 1.45 | 0.52 | 2.17 | 1.75 | 2.73 |
| 1.65 | 2.16 | 1.06 | 1.05 | 0.37 | 2.08 | 1.71 | 2.79 |
| 1.65 | 2.20 | 1.01 | 1.17 | 0.46 | 2.15 | 1.53 | 2.61 |
| 1.57 | 1.92 | 1.11 | 1.23 | 0.46 | 2.15 | 1.79 | 2.77 |
| 1.73 | 2.22 | 1.16 | 1.21 | 0.43 | 2.16 | 1.55 | 2.59 |
| 1.64 | 1.72 | 1.24 | 1.54 | 0.60 | 2.12 | 1.82 | 2.72 |
| 1.61 | 2.10 | 0.99 | 1.37 | 0.58 | 2.25 | 1.43 | 2.49 |
| 1.72 | 1.80 | 1.41 | 1.38 | 0.45 | 2.07 | 1.96 | 2.82 |
| 1.72 | 1.96 | 1.13 | 1.56 | 0.63 | 2.17 | 1.54 | 2.62 |
| 1.68 | 2.20 | 1.01 | 1.04 | 0.39 | 2.01 | 1.68 | 2.78 |
| 1.69 | 1.94 | 1.12 | 1.51 | 0.61 | 2.14 | 1.59 | 2.63 |
| 1.57 | 1.84 | 1.23 | 1.39 | 0.52 | 2.25 | 1.75 | 2.61 |
| 1.55 | 1.92 | 1.03 | 1.21 | 0.50 | 2.09 | 1.77 | 2.71 |
| 1.65 | 1.76 | 1.24 | 1.57 | 0.61 | 2.16 | 1.75 | 2.67 |
| 1.56 | 1.94 | 1.07 | 1.40 | 0.57 | 2.29 | 1.58 | 2.58 |
| 1.65 | 1.74 | 1.34 | 1.53 | 0.55 | 2.20 | 1.83 | 2.71 |
| 1.63 | 2.08 | 1.04 | 1.09 | 0.41 | 2.06 | 1.75 | 2.81 |
MATLAB is used to build the training model, 70% of the total data are selected as the training sample, 30% are selected as the test sample, and the sigmoid function is selected as the activation function. Model information and forecast results are shown in Table 13.
Neural network model information
| Training | Input layer | Input neurons | Hidden layer | Output layer | Output neurons | Learning rate |
| CERs | 130 | 2 | Environmental performance weight | 208 | 0.9 | |
| Testing | Input layer | Input neurons | / | Output layer | Output neurons | Maximum mean square |
| CERs | 42 | / | Environmental performance weight | 56 | 3.35 |
Table 13 shows that the prediction effect of this model is good. When obtaining new CRs, only model analysis is needed, and the process of building a house of quality with strong subjectivity is not needed. Therefore, subjectivity can be avoided, and the complexity of the transformation process can be reduced.
Mapping environmental performance to structures
After normalizing the weight of environmental performance, according to formula 21, the probability matrix from ecological performance to the structure of the transmission shell is calculated, as shown
Probability matrix from environmental performance to structures
| EP1 | EP2 | EP3 | EP4 | EP5 | EP6 | EP7 | EP8 | |
| S1 | 0.822 | 0.631 | 0.582 | 0.562 | 0.823 | 0 | 0.084 | 0.874 |
| S2 | 0.258 | 0.232 | 0.125 | 0.562 | 0.011 | 0.312 | 0.154 | 0.125 |
| S10 | 0 | 0.232 | 0.125 | 0.562 | 0.012 | 0 | 0 | 0.125 |
| AS4 | 0.312 | 0.894 | 0.882 | 0.562 | 0.415 | 0.215 | 0.268 | 0.235 |
| AS5 | 0.215 | 0.231 | 0.182 | 0.562 | 0.032 | 0.316 | 0.258 | 0.565 |
| AS6 | 0.368 | 0.782 | 0.721 | 0.563 | 0.180 | 0.258 | 0.452 | 0.903 |
| AS9 | 0 | 0.232 | 0.125 | 0.562 | 0.012 | 0 | 0 | 0.125 |
| BS4 | 0.315 | 0.891 | 0.885 | 0.563 | 0.412 | 0.274 | 0.556 | 0.236 |
| BS5 | 0.212 | 0.233 | 0.180 | 0.562 | 0.034 | 0.158 | 0.452 | 0.561 |
| BS6 | 0.365 | 0.784 | 0.723 | 0.560 | 0.182 | 0.268 | 0.368 | 0.901 |
| BS9 | 0 | 0.231 | 0.126 | 0.564 | 0.013 | 0 | 0 | 0.122 |
Thus, the hierarchical mapping from CRs to structures is complete, and the probability of mapping different CRs to structures that need improvement can be obtained.
The GA requires that the gene fragments in chromosomes have the same iteration step. In this study, five gene fragments constitute the chromosome, as shown in Table 15.
Basic information table for the evolutionary structure
| Original structure | Evolutionary structure 1 | Evolutionary structure 2 | |
 Binary coding |  001010 |  011110 | |
 Binary coding |  001010 |  010100 | |
 Binary coding |  01010 | ||
| Material | Steel | Aluminium alloy | Magnesium alloy |
| density | 7.85 g/cm3 | 2.8 g/cm3 | 1.8 g/cm3 |
| Binary coding | 011110 | 010110 | 001010 |
| Structure size | |||
Table 15 shows that the evolutionary structure is not a continuous variable; hence, the length of an interval is defined to represent a particular evolutionary structure. The interval representation of the evolutionary structure is shown in Table 15. The wall thickness of the evolutionary structure is exactly one decimal point. The wall thickness range determines the number of binary strings encoded by a single variable. Finally, the arrangement of chromosome gene segments is determined, as shown in Figure 5.

Figure 5. Chromosome structure.
Through the GA, there are still different evolutionary modes for the structures that need to be improved. Figure 6 depicts the variation maps of the common structures U1, U2, and U10, which are not inherited.

Figure 6. Product structure variation map.
For different requirements, the different results of the original structures are different. After the analysis of CERs, the final constraint function Q is defined as the quality of the structures; that is, the environmental performance requirements of transmission shells are mainly concentrated on some structures with relatively large mass. High-quality structures usually have high manufacturing and use costs; hence, various structures with low mass are selected. The results are shown in Table 15, and the comparison of variation before and after is shown in Table 16.
Variation structures
| Variation structure 1 | Variation structure 2 | Variation structure 3 | Material | Wall thickness | |
| Genotype | 010110 | 001011 | 01011 | 011000 | 11001 |
| Phenotype |  |  |  | Magnesium alloy | 5.3 cm |
| Volume | 21 cm3 | 72π - 25πδ - π(6-δ)2 (2 - 2δ) cm3 | -Sδ cm3 |
The results in Table 17 show that the wall thickness decreased by 2.7 cm, the volume of the modified transmission increased by 905.79 cm3, and the overall mass decreased by 27.58 kg. The environmental performance of the transmission is mainly related to its mass. Therefore, the above improvement methods effectively improve the environmental performance of the transmission.
Comparison of parameters before and after variation
| Improvement target | Before variation | After variation | Difference before and after |
| Wall thickness | 8 cm | 5.3 cm | -2.7 cm |
| Volume | 42345.39 cm3 | 43251.18 cm3 | +905.79 cm3 |
| Quality | 37.75 kg | 10.17 kg | -27.58 kg |
CONCLUSION
In this study, based on structural similarity theory and the quantitative analysis of environmental performance, the concept of the inheritable structure of green products was proposed. To achieve a rapid response from CRs to the product structure, a mapping method was proposed for CRs-environmental performance weight-product structure. Combining inheritable structures and mapping methods improved the traditional product design process and shortened the design cycle. This study can provide theoretical and methodological support for carbon emission reduction in product structure design. Compared with the traditional design process, the results of this study are as follows.
(1) Based on inheritable structure theory, designers do not need to redesign all the structures when redesigning the product; they only need to consider the structures that do not satisfy CERs; hence, the workload of product redesign and the R&D cycle are reduced, and the efficiency of product redesign is improved.
(2) Hierarchical mapping in the process of mapping environmental performance to product structure was introduced, which effectively achieved the mapping of environmental performance to structural units.
(3) Combining four mutation operation methods (combination, decomposition, substitution, and material change) with the GA generated a product structure variation map and accelerated the generation process of improved products.
There are many issues that need to be considered in mechanical product sustainable design and it is a multi-objective decision-making problem. From the perspective of CERs, the design of products in this study is not sufficiently comprehensive. There may be more environmental requirements to consider; only typical environmental requirements were listed in this paper. Future carbon emission reduction work needs to comprehensively consider the environment, economic costs, part performance, and other factors.
DECLARATIONS
Authors’ contributionsContributed to conception and design of the study, manuscript drafting: Xuan Y
Contributed to theory and methods: Zheng Y
Contributed to data collection and analysis: Zheng C
Supervised the overall project: Li Z
Supervised the overall project: Zhang L
Availability of data and materialsNot applicable.
Financial support and sponsorshipThis study is supported by Major Science and Technology Projects in Anhui Province (Grant No. 202203f07020006).
Conflicts of interestAll authors declared that there are no conflicts of interest.
Ethical approval and consent to participateNot applicable.
Consent for publicationNot applicable.
Copyright© The Author(s) 2022.
REFERENCES
1. Manesh H, Schaefer D, Hashemipour M. Information requirements analysis for holonic manufacturing systems in a virtual environment. Int J Adv Manuf Technol 2011;53:385-98.
2. Nahm Y, Ishikawa H, Inoue M. New rating methods to prioritize customer requirements in QFD with incomplete customer preferences. Int J Adv Manuf Technol 2013;65:1587-604.
3. Wang Y, Tseng MM. Identifying emerging customer demands in an early design stage by applying bayes factor-based sequential analysis. IEEE Trans Eng Manag 2014; 61:129-37.
4. Shi Y, Peng Q. Enhanced customer requirement classification for product design using big data and improved Kano model. Adv Eng Inform 2021;49:101340.
5. Zheng P, Xu X, Xie SQ. A weighted interval rough number based method to determine relative importance ratings of customer requirements in QFD product planning. J Intell Manuf 2019;30:3-16.
6. Huang X, Liu Y, Wang Y, Wang X. Feature extraction of search product based on multi-feature fusion-oriented to Chinese online reviews. Data Sci Manage 2022;5:57-65.
7. Zhou T, Chen Z, Cao Y, Miao R, Ming X. An integrated framework of user experience-oriented smart service requirement analysis for smart product service system development. Adv Eng Inform 2022;51:101458.
8. Zhu H, Gao J, Cai Q. A product-service system using requirement analysis and knowledge management technologies. Kybernetes 2015;44:823-42.
9. Bereketli I, Erol Genevois M. An integrated QFDE approach for identifying improvement strategies in sustainable product development. J Clean Prod 2013;54:188-98.
10. Zhang L, Benyang B, Bao H, Peng H. An Improved calculation method of QFDE engineering parameter weights. Mech Design Res 2014;30:12-15+19.
11. Younesi M, Roghanian E. A framework for sustainable product design: a hybrid fuzzy approach based on quality function deployment for environment. J Clean Prod 2015;108:385-94.
12. Chu Y, Ren H. Product requirement analysis based on the improved house of quality. IEEE GSIS 2015:547-50.
13. Yuan C, Liu X, Chen Y. Product requirement analysis based on requirement unit. J Dalian Maritime Univ 2008; doi: 10.16411/j.cnki.issn1006-7736.2008.02.027.
14. Gao Y, Liu Z, Hu D, et al. A method of parameter conversion of customer demand engineering oriented to sustainable design. Chin J Mech Eng 2011;22:580-7.
15. Sheng B, Wang X, Xiao Z. Modular product configuration method based on customer demand analysis. Comput Int Manu Syst 2017;23:2091-100.
16. Ma X, Ding G, Qin S, et al. Transforming multidisciplinary customer requirements to product design specifications. Chin J Mech Eng 2017;30:1069-80.
17. Li Y, Yao X. Cloud manufacturing service composition and formal verification based on extended process calculus. Adv Mech Eng 2018;10:168781401878128.
18. Razavi R, Gharipour A, Fleury M, Akpan IJ. A practical feature-engineering framework for electricity theft detection in smart grids. Appl Energy 2019;238:481-94.
19. Zhang C, Huang H, Zhang L, Bao H, Liu Z. Low-carbon design of structural components by integrating material and structural optimization. Int J Adv Manuf Technol 2018;95:4547-60.
20. Sun H, Edziah BK, Kporsu AK, Sarkodie SA, Taghizadeh-hesary F. Energy efficiency: the role of technological innovation and knowledge spillover. Technol Forecast Soc Change 2021;167:120659.
21. Cao G, Tan R, Sun J. Process and realization of functional design based on extended-effect model. J Mech Eng 2009;45:157-67.
22. Feng Y, Song X, Tan J, et al. Solution of mechanical product motion scheme design based on K-WFA. J Zhejiang Univ Sci 2012;46:515-23.
23. Chang F, Zhou G, Lu Q. A mapping network model integrating service to warrant function availability of complex electro-mechanical products. Procedia CIRP 2017;61:667-72.
24. Bai J, Gao S, Tang W, Liu Y, Guo S. Design reuse oriented partial retrieval of CAD models. Comput Aided Des 2010;42:1069-84.
25. Algeddawy T, Elmaraghy H. Reactive design methodology for product family platforms, modularity and parts integration. CIRP J Manuf Sci Technol 2013;6:34-43.
26. Qiao H, Mo R, Chen T, et al. Research on construction method of variant design knowledge base. Available from: http://qikan.cmes.org/zgjxgc/CN/Y2011/V22/I16/1974 [Last accessed on 8 Dec 2022].
27. Jingzhong Gong, Jing Qiu, Guoxi Li, et al. Extension variant design method for product module. Comput Integra Manuf Sys 2008;14:1256-312.
28. Tai K, Chee TH. Design of structures and compliant mechanisms by evolutionary optimization of morphological representations of topology. J Mech Design 2000;122:560-6.
29. Zhou M. Similarity Science, Beijing: Science Press; 2004. pp. 81-94.
30. Jun Ma. Research on product evolution design driven by environmental performance. Available from: https://kns.cnki.net/kcms/detail/detail.aspx?dbcode=CMFD&dbname=CMFD201502&filename=1015574064.nh&uniplatform=NZKPT&v=_6EXhufEFTiGqM2HQysbs_kVfBQZx3K3btT85p56JI-GGNeOMkFvxLWYTykngLkV [Last accessed on 8 Dec 2022].
Cite This Article
 , ... Lei Zhang
How to Cite
Download Citation
Export Citation File:
Type of Import
Tips on Downloading Citation
Citation Manager File Format
Type of Import
Direct Import: When the Direct Import option is selected (the default state), a dialogue box will give you the option to Save or Open the downloaded citation data. Choosing Open will either launch your citation manager or give you a choice of applications with which to use the metadata. The Save option saves the file locally for later use.
Indirect Import: When the Indirect Import option is selected, the metadata is displayed and may be copied and pasted as needed.
About This Article
Copyright

Data & Comments
Data
0


Comments
Comments must be written in English. Spam, offensive content, impersonation, and private information will not be permitted. If any comment is reported and identified as inappropriate content by OAE staff, the comment will be removed without notice. If you have any queries or need any help, please contact us at [email protected].