


Applications and prospects of machine learning in the diagnosis and treatment of SLE
 0
0 
Abstract
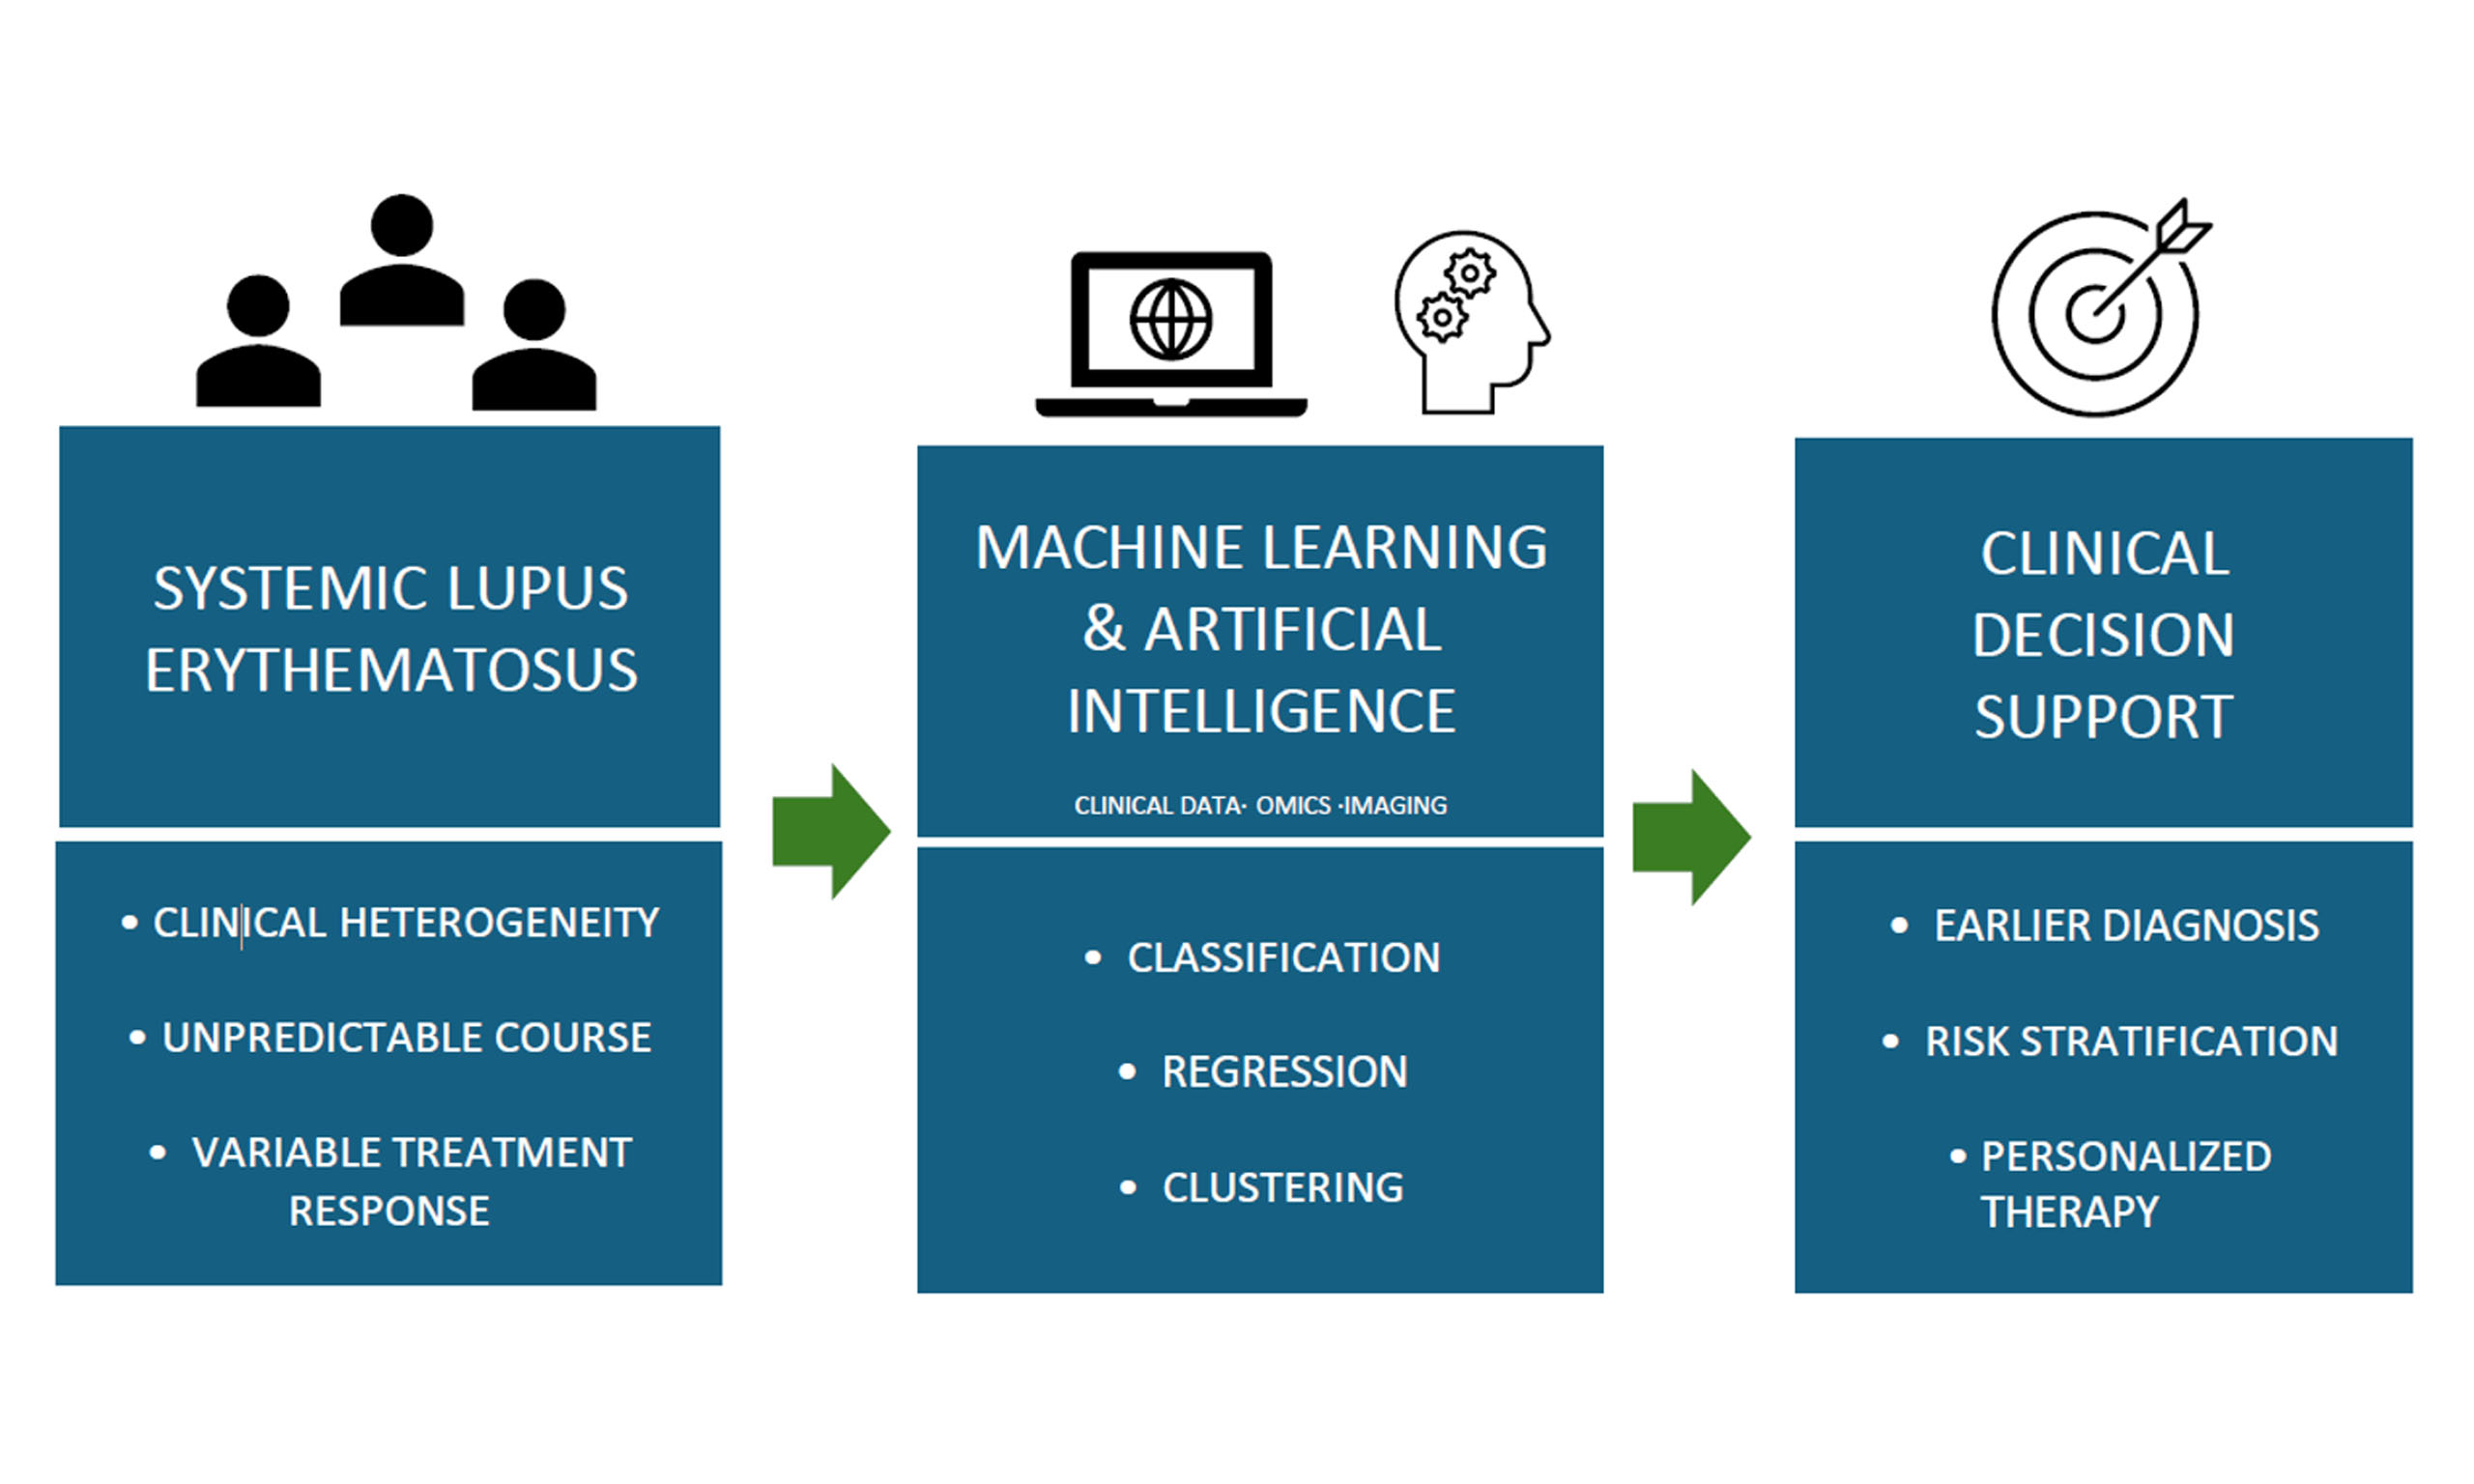
Systemic lupus erythematosus (SLE) remains a major clinical challenge due to its broad phenotypic variability, unpredictable disease trajectory, and inconsistent therapeutic responses. The limitations of conventional diagnostic and prognostic tools underscore the need for more precise, data-driven approaches to support clinical decision-making. Artificial intelligence-based methods, including machine learning (ML) have emerged as powerful technologies capable of analyzing complex, high-dimensional data to reveal hidden patterns and enhance disease understanding. These methods are particularly well-suited for tackling the multifactorial nature of SLE and have demonstrated utility in improving diagnostic accuracy, classifying disease subtypes, and guiding personalized treatment strategies. This review offers a clinician-oriented overview of foundational ML approaches and their practical applications in SLE, highlighting how these tools might be incorporated into clinical workflows to support more timely, accurate, and individualized care.
Keywords
INTRODUCTION
Despite decades of research, systemic lupus erythematosus (SLE) continues to pose substantial unmet medical need. Its diagnostic complexity, unpredictable disease course, and variable response to therapy often result in delayed diagnosis, suboptimal treatment, and increased risk of irreversible organ damage[1]. Conventional clinical and laboratory markers frequently fail to capture the full extent of disease heterogeneity, highlighting the urgent need for more precise tools to support diagnosis, prognosis, and therapeutic decision-making[2].
Recent advancements in machine learning (ML) and artificial intelligence (AI) offer promising avenues to transform traditional approaches in SLE care[3]. Unlike conventional statistical methods, ML excels at recognizing complex, nonlinear patterns in large and heterogeneous datasets -making it particularly well-suited to decipher the multifactorial nature of SLE[4]. This capability becomes increasingly valuable as data from large SLE cohorts continue to accumulate, necessitating scalable, high-throughput analytical approaches. At the same time, ML can be leveraged to enhance data interpretation in underrepresented disease manifestations, such as neuropsychiatric lupus (NPSLE), where sample sizes are often small and conventional methods struggle to yield meaningful insights[5].
ML approaches have the potential to accelerate the transition to personalized medicine by enabling therapeutic tailoring based on each patient’s molecular profile through endotype classification[6]. In this review, we provide an overview of key ML algorithms and examine their current and emerging applications in the diagnosis, classification, prognosis, and treatment of SLE. We also discuss challenges related to the application of ML in SLE datasets and its integration into clinical practice.
ARTIFICIAL INTELLIGENCE AND MACHINE LEARNING: A PRIMER FOR CLINICIANS
Although the terms AI and ML are often used interchangeably, they are not synonymous. AI refers to systems designed to replicate human cognitive functions such as reasoning, problem-solving, and pattern recognition. ML is a subset of AI that employs algorithms to “learn” from input data and make predictions or uncover patterns -without the need for explicitly programmed instructions[7]. Unlike hypothesis-driven statistical models, ML is well-suited for discovering previously unrecognized associations, making it a powerful tool for hypothesis generation and predictive modeling[8].
ML algorithms infer patterns directly from input data, enabling them to handle high-dimensional biomedical data - a common scenario in SLE, where datasets often include genomics, transcriptomics, imaging, and longitudinal clinical data.
ML applications generally fall into three main categories: classification, regression, and clustering[4]. Classification refers to the prediction of categorical outcomes (e.g., distinguishing between patients with active versus inactive SLE), whereas regression predicts continuous outcomes (such as anti-double-stranded DNA (dsDNA) antibody levels). Clustering, an unsupervised technique, groups patients based on shared features without relying on predefined labels, which can be particularly useful in identifying novel subtypes of SLE based on gene expression profiles or clinical features.
Regardless of the ML task, the development of a model typically follows a standard workflow: data preprocessing, model construction, validation, and performance assessment.
Data preprocessing
The quality of the input data is fundamental to model performance[9]. Preprocessing may involve handling missing values (e.g., imputation), transforming data into machine-readable formats (scaling), and selecting relevant variables (feature selection). In clinical datasets, missing data is common, and choosing appropriate imputation methods is crucial to preserve data integrity[10,11].
After imputation, biomedical data often require transformation into numerical formats that computers can interpret. For instance, unstructured text from electronic health records (EHRs) can be converted into structured data using natural language processing (NLP), enabling ML algorithms to extract meaningful patterns[12]. Additionally, numerical variables often need to be normalized - using techniques such as min-max scaling or z-score transformation - to ensure consistent ranges across features and improve model performance[13].
Dimensionality reduction techniques can further enhance model efficiency by transforming high-dimensional data into a smaller set of informative variables[14]. One commonly used method, principal component analysis (PCA), reduces data complexity by identifying principal components that capture the most variance. Other approaches include multidimensional scaling (MDS), low-variance and high-correlation filters, forward selection, and backward elimination[4].
Feature selection, while related to dimensionality reduction, focuses on identifying the subset of variables that are most predictive of a specific outcome. Feature selection methods can be broadly categorized into filter, wrapper, and embedded techniques[15]. Filter methods assess the statistical relationship between each variable and the outcome, independently of any ML algorithm[15]. Wrapper methods evaluate subsets of features based on their impact on model performance through iterative training[16]. Embedded methods, in contrast, incorporate feature selection into the model training process itself, with examples such as regularized regression (e.g., Least Absolute Shrinkage and Selection Operator [LASSO]) or tree-based algorithms that quantify feature importance[16]. By retaining only the most informative features, these techniques improve model interpretability, reduce overfitting, and minimize computational cost - critical advantages when dealing with complex biomedical data.
Algorithm selection
The choice of algorithm depends on the task - classification, regression, or clustering - and the nature of the input data [Table 1]. Common classifiers include decision trees, random forest (RF), gradient boosting machine (GBM), naïve Bayes, k-nearest neighbors (k-NN), support vector machine (SVM), and logistic regression. For regression tasks, LASSO or ridge regression is often employed. Clustering approaches typically utilize algorithms such as k-means or hierarchical clustering.
Common machine learning algorithms in SLE research
| Algorithm | Strengths | Limitations | Clinical applications |
| Random forest (RF) | Handles high-dimensional data | Less interpretable | Classification tasks |
| Gradient boosting machine (GBM) | Sequential error correction | Less interpretable, overfitting if unregularized | Classification tasks |
| Naïve bayes | Fast, scalable, handles sparse data | Assumes feature independence | Text-based data, classification tasks |
| k-nearest neighbors (k-NN) | Simple, intuitive, no training required | Computationally expensive, sensitive to irrelevant features, poor in high dimensions | Classification tasks, anomaly detection |
| Support vector machine (SVM) | Effective in structured, high-dimensional data | Sensitive to parameter tuning | Classification tasks (medical imaging, genomics) |
| Logistic regression | Interpretable, feature selection (LASSO), handles multicollinearity (LASSO) | Feature selection instability, sensitivity to scaling and outliers | Classification tasks |
| Neural networks/deep learning | Captures complex patterns, unstructured data | Data and resource intensive, less interpretable | Medical imaging, genomics |
| k-means/hierarchical clustering | Unsupervised clustering | Sensitive to scaling/initialization | Identification of disease endotypes |
In addition to task-based categorization, algorithms can also be grouped by architectural paradigms, which provides insight into their learning behavior and performance trade-offs. Ensemble algorithms improve predictive performance by aggregating multiple base learners[17]. The two most widely used ensemble approaches are bagging and boosting. RF employs bagging by training multiple decision trees on bootstrapped subsets of the data and aggregating their predictions via majority vote or averaging[18]. This reduces model variance and prevents overfitting, particularly in high-dimensional spaces. GBM uses boosting, in which models are trained sequentially, with each model correcting the errors of the previous one[19]. While GBMs often achieve higher accuracy, they are less interpretable and more prone to overfitting if not well-regularized.
Bayesian methods, including naïve Bayes, apply Bayes’ theorem to estimate class membership[20]. Despite assuming feature independence, naïve Bayes is fast, scalable, and performs well in high-dimensional, sparse data[21]. Instance-based algorithms, such as k-NN and SVM, make predictions by referencing specific training examples rather than learning explicit global models[22].
Regularized regression models are particularly useful when interpretability and feature selection are critical. LASSO and ridge regression apply L1 and L2 penalties, respectively, to shrink coefficients and reduce model complexity[23]. LASSO performs embedded feature selection by driving some coefficients to zero, while ridge regression shrinks all coefficients towards zero but retains all features in the model. Both are effective in multicollinear and high-dimensional settings.
Neural networks are computational models inspired by the brain’s structure, capable of both supervised and unsupervised learning[24]. They consist of interconnected layers: an input layer that receives the data, one or more hidden layers that transform the input through learned weights, and an output layer that produces the final prediction[25]. While powerful for modeling complex patterns, they are computationally demanding. Deep learning refers to neural networks with multiple hidden layers[26].
In clinical/translational research, algorithm choice should be driven by the type of data, the clinical question, and the need for interpretability. For interpretability, simpler models such as logistic regression or decision trees are preferred. Ensemble methods such as RF provide robust performance in complex or high-dimensional datasets. Bayesian and SVM models perform well with structured or text-based data. When variable selection is key, LASSO helps identify the most predictive clinical features. For large, unstructured data such as imaging or genomics, deep learning models are effective but require more resources and offer less interpretability.
Model training and validation
After selecting an appropriate algorithm, the model is trained. This process is iterative, with the model adjusting internal parameters to minimize prediction error.
To assess model generalizability, data are typically split into training and validation sets[8,27]. The training set is used to build the model, while the validation set - either a holdout from the training data or a completely independent dataset - is used to evaluate performance and fine-tune hyperparameters[8,28]. When available, a third independent test set is used for final performance assessment to provide an unbiased estimate of model accuracy[8].
In situations where a dedicated validation set is unavailable, holdout validation (e.g., an 80/20 split) or k-fold cross-validation is used[28]. In k-fold cross-validation, the dataset is divided into k parts. The model is trained k times, with each iteration using one unique part as the validation set and the remaining k -1 parts for training. This resampling technique reduces bias and variance in model evaluation, making it especially valuable in datasets with limited size.
Model performance evaluation
Evaluating ML models requires appropriate metrics. For classification problems, accuracy, sensitivity, specificity, and the area under the receiver operating characteristic curve (AUC) are commonly used[29]. Regression models are assessed using metrics such as mean squared error (MSE) or the coefficient of determination (R2)[30]. The evaluation of the clustering models is more challenging due to the absence of ground-truth labels; nevertheless, internal metrics such as silhouette scores can provide some insight.
Utilizing ML approaches in SLE diagnostics
ML algorithms have been proposed to assist SLE diagnosis and predict organ-specific involvement.
Clinical feature-based ML models for SLE classification
ML techniques offer promising support in the diagnosis of SLE, a disease known for its clinical complexity and lack of a definitive diagnostic test.
An exquisite example is SLE Risk Probability Index (SLERPI), a diagnostic algorithm assisting physicians in SLE diagnosis, developed using ML, RF and LASSO-LR for feature selection[31]. Among the 14 adjusted features of this model, the most potent SLE predictors included thrombocytopenia/hemolytic anemia, malar rash, proteinuria, antinuclear antibodies (ANA) levels, C3 and C4 consumption and immune disorder. This model also approximated SLE risk probability, speculating disease severity and progression and enabling patient categorization upon diagnostic certainty degree (unlikely, possible, likely, definitive SLE). Accuracy levels reached 95% for a binary outcome (lupus/not-lupus), while sensitivity regarding early onset, lupus nephritis (LN), NPSLE and severe disease course was equally high[31]. Subsequent studies conducted in diverse regions and clinical settings have confirmed the high sensitivity of SLERPI in identifying SLE cases, along with very good specificity compared to formal classification criteria [Table 2].
Performance of SLERPI in “real world” cohorts
| Setting (country) | No. patients | Sensitivity | Specificity | Comments |
| Hospitalized patients (initial diagnosis)[32] | 191 (SLE) | 87.4% | - | High prevalence of NP and thrombotic events |
| Pediatric cohort[33] | 111 (SLE) - 171 (controls) | 90.0% | 81.2% | Misclassifications: HUS, MCTD |
| UCTD cohort (not meeting any of the formal SLE criteria)[34] | 422 | - | - | 9.2% classified as SLE (frequently used GC, HCQ) - possible use to define “at-risk” groups |
| Chinese cohort[35] | 352 (SLE) - 385 (controls) | 98.3% | 89.4% | Shorter time-to-classification (~clinical Dx) Misclassifications: primary SS, MCTD |
| Referral hospitals (Bogota, Colombia)[36] | 146 (SLE; prospectively diagnosed) | 89.0% | - | SLERPI +ve pts frequently used GC, AZA |
| Australian Lupus Registry (ACR 97 or SLICC 12 criteria)[37] | 394 (SLE) - 123 (controls) | 98.5% | 84.6% | High sensitivity (97.6%) in early (< 15 months) disease |
In a similar approach, Ceccarelli et al. sought to identify the most discriminative features - or “red flags” - of SLE by comparing patients with SLE to those with other diagnostically relevant rheumatologic diseases (RMDs)[38]. The ReliefF algorithm was applied to rank diagnostic features according to their ability to discriminate SLE from other RMDs. This analysis identified anti-dsDNA, low complement levels, and malar or maculopapular rash as the most robust and clinically informative predictors of SLE[38].
To surpass the barrier of low specificity inherent in ANA testing, the primary yet often misleading SLE diagnostic screening, ML algorithms were applied on established clinical stratification guidelines[39]. Real-world data were derived from a cohort of 24,990 patients clinically monitored over a decade, stratified by ANA positivity and undergoing feature selection to pinpoint key factors implicated in SLE diagnosis and design a Clinical Decision Support System (CDSS). Three distinct ML-based diagnostic algorithms - decision tree, RF and gradient boosting - were assessed, showcasing accuracy rates of 70%, 88% and 87%, respectively[39].
While these clinical feature-based ML models demonstrate high diagnostic performance, certain limitations should be acknowledged. Most studies rely on retrospective datasets, which are susceptible to incomplete data capture, misclassification bias and variability in clinical documentation. Model performance may be influenced by cohort composition and referral bias, thereby limiting generalizability. Moreover, external validation in independent cohorts across different settings is often lacking, raising concerns about robustness and reproducibility. Finally, ML models aimed at early SLE diagnosis would ideally be developed and validated in cohorts with very early or preclinical disease, prior to the development of adverse outcomes, to better reflect their intended clinical application.
Integrative ML and multi-omics frameworks to facilitate SLE classification
Despite the relatively small individual contribution of each risk allele to disease susceptibility, the polygenic risk scoring (PRS) model - based on the assumption of independent and cumulative effects of genetic variants - could be utilized to assess the overall risk of developing SLE[40]. Leveraging this foundation, a RF model trained on genome-wide association study (GWAS) data from Chinese and European cohorts successfully classified SLE cases and controls, achieving a mean AUC of 0.84[41].
Similarly, transcriptomic profiling of peripheral blood has shown classification potential. For instance, a linear discriminant analysis model utilizing differentially expressed genes demonstrated a median diagnostic accuracy of 87.5%[42], while the expression patterns of neutrophil extracellular trap (NET)-related and interferon-stimulated genes could also aid in distinguishing SLE from healthy controls[43]. In this context, differential expression analysis and weighted gene co-expression network analysis (WGCNA), combined with protein-protein interaction mapping, RF, and LASSO regression, were used to identify shared hub genes between SLE and metabolic syndrome and to construct a diagnostic algorithm[44]. Among the identified genes, TNFSF13B and OAS1, predominantly expressed by monocytes, showed the highest diagnostic performance for SLE[44]. ML approaches applied to whole blood gene expression have further enabled the differentiation of SLE patients with antiphospholipid syndrome from healthy individuals[45].
Despite their promising performance, these genomic ML approaches are prone to limitations. Thus, many studies are based on relatively small, or ethnically homogeneous cohorts, which may restrict generalizability. In addition, the high dimensionality of omics data increases the risk of overfitting, and most models lack external validation required for clinical translation.
Organ-specific ML applications in SLE
Lupus nephritis
Lupus nephritis (LN) is one of the most severe manifestations of SLE, affecting up to 60% of patients over the course of the disease[46]. Current diagnostic tests, including serum creatinine, proteinuria, and histopathologic evaluation of the renal biopsy, are either non-specific, invasive, or insensitive to early subclinical disease activity.
Supervised ML approaches were applied as early as four decades ago to assess clinical and laboratory data related to glomerular diseases, demonstrating strong potential in diagnosing LN, though still falling short of the accuracy achieved by renal biopsy[47]. Building on this foundation, deep convolutional neural networks (CNNs) were deployed to diagnose and classify LN based on glomerular pathology, using renal biopsy images selected by nephropathologists. When tested on unannotated glomerular images, accuracy levels of CNN models reached 95% for lesion classification, achieving high levels of agreement with experts[48]. In a related study, Tang et al. developed an ML algorithm combining multilinear regression and RF analysis to classify LN histology and predict acute and chronic pathology indices, with urinary N-acetyl-β-D-glucosaminidase isoenzyme emerging as a key predictor[49]. In the same context, longitudinal analysis of urinary samples revealed that levels of interleukin (IL)-16 and CD163 correlated with the National Institutes of Health (NIH) activity index. Notably, a three-month decline in CD163 predicted one-year treatment response with an AUC of 0.86, outperforming proteinuria, which showed an AUC of 0.75[50].
In parallel, novel blood biomarkers for the non-invasive detection of LN have been proposed[51-53]. For instance, an 18-gene ML-based signature derived from whole blood RNA sequencing demonstrated high accuracy in distinguishing LN from non-renal SLE[51]. Similarly, a related study applying LASSO and SVM models to gene expression data from blood and renal tissue identified diagnostically valuable biomarkers for LN[53]. These included complement C1q subcomponent subunit A (C1QA), complement C1q subcomponent subunit B (C1QB), MX dynamin-like GTPase 1 (MX1), RAR-related orphan receptor C (RORC), CD177 antigen (CD177), defensin alpha 4 (DEFA4), and HERC E3 ubiquitin protein ligase 5 (HERC5). Complementing these findings, the serum protein V-set immunoglobulin domain-containing protein 4 showed strong discriminative power in differentiating active from inactive LN[54]. Wang et al. further explored ‘liquid biopsy’ potential by analyzing plasma cell-free DNA (cfDNA) using fragmentomics and epigenetics, revealing significantly lower cfDNA levels and higher methylation scores in LN patients[52].
Expanding beyond nucleic acid biomarkers, Mondal et al. applied in situ mass spectrometry to renal biopsy tissue from patients with nephrotic syndrome of diverse etiologies, including LN[55]. The ML-based lipidomic classifier achieved excellent accuracy and reduced diagnostic time, offering a rapid, non-invasive complement to traditional histopathology[55].
Cutaneous lupus
Cutaneous lupus (CLE) encompasses a broad spectrum of dermatologic manifestations and presents significant diagnostic challenges. CNNs have been employed to facilitate the differential diagnosis of CLE against other skin conditions through automatic assessment of clinical images[56]. The model developed outperformed three state-of-the-art CNN algorithms, achieving an overall accuracy exceeding 90% and approaching the diagnostic performance of expert dermatologists[56]. In a complementary approach,
At molecular level, ML-based analysis of gene expression profiles from lesional and non-lesional skin from patients with CL, psoriasis, systemic sclerosis, and atopic dermatitis revealed distinct, disease-specific signatures - particularly in non-lesional skin - including key pathways such as interferon, tumor necrosis factor (TNF), IL-23, and IL-12 gene signatures[58].
Although these organ-specific ML approaches demonstrate high accuracy, their translation into routine clinical practice is constrained by several challenges, including limited external validation, heterogeneity in tissue processing and analytical assays, and a lack of standardized cutoff thresholds. These factors collectively impede reproducibility and clinical implementation.
ML in prediction of treatment response in SLE
SLE treatment relies on immunosuppressive drugs, with delayed response, limited efficacy, and considerable side effects, underscoring the need for predictive biomarkers to guide personalized therapy. ML has shown strong potential in this context by integrating clinical, laboratory, histopathological, and biomarker data to predict treatment outcomes[59-62].
ML approaches to predict treatment response in Lupus Nephritis
In LN, clinical factors such as C3 and C4 levels, age, sex, race, anti-dsDNA, baseline estimated glomerular filtration rate (eGFR), urine protein-to-creatinine ratio (UPCR), and urinary biomarkers (e.g., C-X-C motif chemokine ligand 8 (CXCL8), IL-8, IL-2Ra, pentraxin, adiponectin, osteoprotegerin, macrophage colony-stimulating factor (M-CSF)) have been identified as potential predictors of treatment response[60,61]. Among the most effective models, an artificial neural network achieved high predictive accuracy (AUC 0.93) for complete renal response, despite limited external validation and interpretability. Input features included erythrocyte sedimentation rate, C-reactive protein, serum albumin, triglycerides, C3, C4, antinuclear antibody status, UPCR, and histopathological data[63]. Similarly, a RF model demonstrated comparable performance (AUC 0.92) in predicting preserved renal function, defined as an eGFR greater than 90 mL/min at one year or a decline of no more than 25% from baseline following LN diagnosis[60].
Focusing specifically on renal flares, an eXtreme Gradient Boosting (XGBoost) algorithm was applied to predict five-year flare risk in biopsy-confirmed LN patients in post-treatment remission. Key predictors included partial remission status, baseline endocapillary hypercellularity, age, serum albumin, anti-dsDNA antibody levels, and serum C3 levels at the time of remission[64]. Additionally, the Aspreva Lupus Management Study (ALMS) cohort was analyzed to identify factors associated with treatment response at six months. Notably, a LN disease duration of 2-4 years was linked to a reduced likelihood of achieving complete renal response six months post-treatment initiation[65].
Similar to other approaches discussed above, these studies may be limited by the absence of robust validation, potential overfitting, and the limited interpretability of complex algorithms, which may hinder reproducibility and clinical translation.
Prediction of long-term outcomes
Beyond organ-specific outcomes, ML approaches have also been applied to predict the likelihood of achieving disease remission in patients with SLE[66-68]. For example, a SVM model applied to demographic, clinical, and laboratory data from a single-center SLE cohort achieved moderate predictive performance (AUC 0.71) in forecasting sustained remission for at least one year, along with no evidence of chronic damage progression in the preceding year[66]. Similarly, the Flare Risk Index (FRI), a serologic prognostic tool comprising 11 plasma mediators including osteopontin and tumor necrosis factor receptor type I, was able to distinguish patients at risk of disease flare from those in remission with high accuracy[69]. More recently, supervised ML methods, including sparse partial least squares discriminant analysis and regularized RF, were applied to clinical data from the randomized controlled BEAT-LUPUS trial (NCT05714930). This analysis revealed a predictive association between baseline serum immunoglobulin A subclass 2 (IgA2) anti-double-stranded DNA antibody concentrations and clinical response to belimumab following rituximab treatment[67]. Additionally, predictive models based on whole blood transcriptional profiles have been proposed to forecast response to belimumab therapy[68].
Unsupervised ML methods have also been increasingly applied to identify molecular endotypes in SLE, offering valuable insights into disease heterogeneity and treatment response variability[70-74]. For instance, using whole blood transcriptomic data from 120 SLE patients, unbiased clustering approaches revealed distinct molecular subgroups, enabling the proposal of cluster-specific therapeutic strategies[70].
SLE-associated hospitalization has also been predicted using ML-based analysis of EHR features, such as demographics, laboratory tests, prescribed medications, ICD-9/10 codes for SLE symptoms, and healthcare utilization[75]. Among various models, RF achieved the highest predictive performance, with AUCs of 0.75 and 0.77 for averaging and progressive models, respectively. Key predictors included dsDNA positivity, C3 levels, blood counts, inflammatory markers, age, and albumin levels[75].
These studies have several limitations. They primarily rely on single-center cohorts, which limits generalizability and increases the risk of overfitting. In addition, variability in data extraction from medical records and the lack of external validation may reduce reproducibility and hinder clinical implementation.
Challenges and future directions
The increasing availability of big data and AI is poised to revolutionize rheumatology by facilitating earlier diagnosis, improving disease outcome predictions, and enabling personalized treatments, especially for complex conditions such as SLE. By analyzing multidimensional datasets - from genomics to imaging and clinical records - AI models can uncover hidden patterns and molecular subtypes, supporting targeted therapies and timely interventions.
However, alongside these advances, several challenges and risks must be addressed[76]. Data quality and heterogeneity can significantly affect model robustness and generalizability. AI systems trained on small or poorly annotated datasets may yield unstable or biased predictions, limiting their utility in real-world settings. The successful development and deployment of AI models in SLE require access to large, high-quality datasets derived from well-characterized clinical cohorts, where disease phenotypes, treatments, outcomes, and relevant covariates are systematically recorded. Furthermore, effective clinical adoption of AI tools requires proper data preprocessing and modeling to ensure compatibility with existing EHRs systems and seamless integration into clinical workflows.
Bias in AI systems represents a critical concern. ML algorithms are inherently dependent on the data used for training, and models developed from unrepresentative or imbalanced datasets may perpetuate or amplify existing healthcare disparities. For instance, algorithms trained primarily on data from a single racial or ethnic group may underperform in underrepresented populations, resulting in unequal diagnostic accuracy or treatment predictions. Bias can also affect other clinically relevant subgroups, including those defined by sex, age, or socioeconomic status, potentially contributing to inequities in care. Addressing these challenges requires the use of diverse, representative datasets that capture genetic variability, socioeconomic determinants, and a wide spectrum of clinical phenotypes. Complementary strategies, including bias detection frameworks, fairness-aware learning, and systematic evaluation of model performance across demographic subgroups, are essential to ensure equitable and generalizable AI-driven predictions.
External validation is essential to ensure that AI models perform reliably across diverse patient populations. Even models trained on large, well-curated datasets may overfit to cohort-specific characteristics. Evaluating models in independent cohorts spanning different geographic regions, ethnic backgrounds, and healthcare systems could help confirm generalizability, minimize overfitting, and support the reliable translation of AI tools into real-world clinical practice.
Another key challenge to the clinical adoption of ML models is their limited interpretability. Although advanced algorithms such as artificial neural networks often achieve high predictive accuracy, they frequently operate as black-box systems, offering little insight into how predictions are generated. In clinical practice, where treatment decisions carry significant consequences, this lack of transparency can undermine clinician trust. Integrating explainable AI techniques, such as Shapley Additive Explanations (SHAP) and Local Interpretable Model-Agnostic Explanations (LIME), can enable feature-level attribution, enhance transparency, support clinical decision-making, and facilitate more effective integration of ML models into personalized care.
Ethical and regulatory considerations are also paramount. Safeguarding patient privacy, ensuring data security, and complying with regulations governing sensitive clinical and biological information are critical. Clear regulatory frameworks, combined with ethical governance structures and interdisciplinary collaboration among clinicians, data scientists, and ethicists, are essential to ensure the secure integration of AI into SLE care.
CONCLUSIONS
Collectively, the integration of AI tools into clinical workflows demands not only rigorous validation and regulatory oversight but also thoughtful model design, interdisciplinary collaboration, and ongoing clinician education to ensure responsible and effective implementation.
DECLARATIONS
Authors’ contributions
Contributed to the writing of the manuscript: Garantziotis P, Ainatzoglou A, Bertsias G
Conducted the primary literature search: Garantziotis P, Ainatzoglou A, Lapsiwala M, Zoli A
Supervised the project and provided critical oversight and guidance throughout the development of the manuscript: Garantziotis P
Availability of data and materials
Not applicable.
AI and AI-assisted tools statement
Not applicable.
Financial support and sponsorship
None.
Conflicts of interest
All authors declared that there are no conflicts of interest.
Ethical approval and consent to participate
Not applicable.
Consent for publication
Not applicable.
Copyright
© The Author(s) 2026.
REFERENCES
1. Lazar S, Kahlenberg JM. Systemic lupus erythematosus: new diagnostic and therapeutic approaches. Annu Rev Med. 2023;74:339-52.
2. Zhan K, Buhler KA, Chen IY, Fritzler MJ, Choi MY. Systemic lupus in the era of machine learning medicine. Lupus Sci Med. 2024;11:e001140.
3. Nelson AE, Arbeeva L. Narrative review of machine learning in rheumatic and musculoskeletal diseases for clinicians and researchers: biases, goals, and future directions. J Rheumatol. 2022;49:1191-200.
4. Kingsmore KM, Puglisi CE, Grammer AC, Lipsky PE. An introduction to machine learning and analysis of its use in rheumatic diseases. Nat Rev Rheumatol. 2021;17:710-30.
5. Ceccarelli F, Natalucci F, Picciariello L, et al. Application of machine learning models in systemic lupus erythematosus. Int J Mol Sci. 2023;24:4514.
6. Hubbard EL, Bachali P, Kingsmore KM, et al. Analysis of transcriptomic features reveals molecular endotypes of SLE with clinical implications. Genome Med. 2023;15:84.
7. Jordan MI, Mitchell TM. Machine learning: trends, perspectives, and prospects. Science. 2015;349:255-60.
8. Kim KJ, Tagkopoulos I. Application of machine learning in rheumatic disease research. Korean J Intern Med. 2019;34:708-22.
9. Bhaya WS. Review of data preprocessing techniques in data mining. ARPN J Eng Appl Sci. 2017;12:4102-7.
11. Tuikkala J, Elo LL, Nevalainen OS, Aittokallio T. Missing value imputation improves clustering and interpretation of gene expression microarray data. BMC Bioinf. 2008;9:202.
12. Clay B, Bergman HI, Salim S, Pergola G, Shalhoub J, Davies AH. Natural language processing techniques applied to the electronic health record in clinical research and practice - an introduction to methodologies. Comput Biol Med. 2025;188:109808.
13. Cao XH, Stojkovic I, Obradovic Z. A robust data scaling algorithm to improve classification accuracies in biomedical data. BMC Bioinf. 2016;17:359.
14. Bouchefry KE, de Souza RS. Chapter 12 - Learning in big data: introduction to machine learning. In: Knowledge discovery in big data from astronomy and earth observation. Elsevier; 2020, pp. 225-49.
15. Stanczyk U. Feature evaluation by filter, wrapper, and embedded approaches. Stud Comput Intell. 2015;584:29-44.
16. Guyon I, Elisseeff A. An introduction to variable and feature selection. J Mach Learn Res. 2023;3:1157-82.
17. Dietterich TG. Ensemble methods in machine learning. In: Multiple classifier systems. Berlin, Heidelberg: Springer Berlin Heidelberg; 2000, pp. 1-15.
18. Altman N, Krzywinski M. Ensemble methods: bagging and random forests. Nat Methods. 2017;14:933-4.
19. Schapire RE. The Boosting approach to machine learning: an overview. In: Denison DD, Hansen MH, Holmes CC, Mallick B, Yu B, editors. Nonlinear estimation and classification. New York, NY: Springer New York; 2003, pp. 149-71.
20. Snoek J, Larochelle H, Adams RP. Practical bayesian optimization of machine learning algorithms. ArXiv. 2021:arXiv:1206.2944. Available from: https://arxiv.org/abs/1206.2944 [Last accessed on 27 Apr 2026].
25. Kotsiantis SB, Zaharakis ID, Pintelas PE. Machine learning: a review of classification and combining techniques. Artif Intell Rev. 2006;26:59-190.
26. Arnold L, Rebecchi S, Chevallier S, Paugam-Moisy H. An introduction to deep learning. Available from: https://www.esann.org/sites/default/files/proceedings/legacy/es2011-4.pdf [Last accessed on 27 Apr 2026].
28. Kim JH. Estimating classification error rate: repeated cross-validation, repeated hold-out and bootstrap. Comput Stat Data Anal. 2009;53:3735-45.
31. Adamichou C, Genitsaridi I, Nikolopoulos D, et al. Lupus or not? SLE Risk Probability Index (SLERPI): a simple, clinician-friendly machine learning-based model to assist the diagnosis of systemic lupus erythematosus. Ann Rheum Dis. 2021;80:758-66.
32. Kapsala N, Nikolopoulos D, Flouda S, et al. First diagnosis of systemic lupus erythematosus in hospitalized patients: clinical phenotypes and pitfalls for the non-specialist. Am J Med. 2022;135:244-53.e3.
33. Batu ED, Kaya Akca U, Basaran O, Bilginer Y, Ozen S. Correspondence on 'Lupus or not? SLE Risk Probability Index (SLERPI): a simple, clinician-friendly machine-learning-based model to assist the diagnosis of systemic lupus erythematosus'. Ann Rheum Dis. 2023;82:e144.
34. Erden A, Apaydın H, Fanouriakis A, et al. Performance of the systemic lupus erythematosus risk probability index in a cohort of undifferentiated connective tissue disease. Rheumatology. 2022;61:3606-13.
35. Zhang L, Lu W, Yan D, Liu Z, Xue L. Systemic lupus erythematosus risk probability index: ready for routine use? Results from a Chinese cohort. Lupus Sci Med. 2023;10:e000988.
36. Castañeda-González JP, Mogollón Hurtado SA, Rojas-Villarraga A, et al. Comparison of the SLE Risk Probability Index (SLERPI) scale against the European League Against Rheumatism/American College of Rheumatology (ACR/EULAR) and Systemic Lupus International Collaborating Clinics (SLICC) criteria. Lupus. 2024;33:520-4.
37. Tan BCH, Tang I, Bonin J, Koelmeyer R, Hoi A. The performance of different classification criteria for systemic lupus erythematosus in a real-world rheumatology department. Rheumatology. 2022;61:4509-13.
38. Ceccarelli F, Lapucci M, Olivieri G, et al. Can machine learning models support physicians in systemic lupus erythematosus diagnosis? Results from a monocentric cohort. Joint Bone Spine. 2022;89:105292.
39. Park M. Improving the diagnosis of systemic lupus erythematosus with machine learning algorithms based on real-world data. Mathematics. 2024;12:2849.
40. Mok CC. Polygenic risk score: the potential role in the management of systemic lupus erythematosus. RMD Open. 2024;10:e004156.
41. Ma W, Lau YL, Yang W, Wang YF. Random forests algorithm boosts genetic risk prediction of systemic lupus erythematosus. Front Genet. 2022;13:902793.
42. Panousis NI, Bertsias GK, Ongen H, et al. Combined genetic and transcriptome analysis of patients with SLE: distinct, targetable signatures for susceptibility and severity. Ann Rheum Dis. 2019;78:1079-89.
43. Li H, Zhang X, Shang J, et al. Identification of NETs-related biomarkers and molecular clusters in systemic lupus erythematosus. Front Immunol. 2023;14:1150828.
44. Wang Y, Huang Z, Xiao Y, Wan W, Yang X. The shared biomarkers and pathways of systemic lupus erythematosus and metabolic syndrome analyzed by bioinformatics combining machine learning algorithm and single-cell sequencing analysis. Front Immunol. 2022;13:1015882.
45. Nikolopoulos D, Loukogiannaki C, Sentis G, et al. Disentangling the riddle of systemic lupus erythematosus with antiphospholipid syndrome: blood transcriptome analysis reveals a less-pronounced IFN-signature and distinct molecular profiles in venous versus arterial events. Ann Rheum Dis. 2024;83:1132-43.
46. Hocaoǧlu M, Valenzuela-Almada MO, Dabit JY, et al. Incidence, prevalence, and mortality of lupus nephritis: a population-based study over four decades using the lupus midwest network. Arthritis Rheumatol. 2023;75:567-73.
47. Agar JW, Webb GI. Application of machine learning to a renal biopsy database. Nephrol Dial Transplant. 1992;7:472-8.
48. Zheng Z, Zhang X, Ding J, et al. Deep learning-based artificial intelligence system for automatic assessment of glomerular pathological findings in lupus nephritis. Diagnostics. 2021;11:1983.
49. Tang Y, Zhang W, Zhu M, et al. Lupus nephritis pathology prediction with clinical indices. Sci Rep. 2018;8:10231.
50. Fava A, Buyon J, Magder L, et al. Urine proteomic signatures of histological class, activity, chronicity, and treatment response in lupus nephritis. JCI Insight. 2024;9:e172569.
51. Frangou E, Garantziotis P, Grigoriou M, et al. Cross-species transcriptome analysis for early detection and specific therapeutic targeting of human lupus nephritis. Ann Rheum Dis. 2022;81:1409-19.
52. Wang L, Yang Z, Yu H, et al. Predicting diagnostic gene expression profiles associated with immune infiltration in patients with lupus nephritis. Front Immunol. 2022;13:839197.
53. Wang F, Miao HB, Pei ZH, Chen Z. Serological, fragmentomic, and epigenetic characteristics of cell-free DNA in patients with lupus nephritis. Front Immunol. 2022;13:1001690.
54. Tang C, Zhang S, Teymur A, et al. V-set immunoglobulin domain-containing protein 4 as a novel serum biomarker of lupus nephritis and renal pathology activity. Arthritis Rheumatol. 2023;75:1573-85.
55. Mondal S, Singh MP, Kumar A, et al. Rapid molecular evaluation of human kidney tissue sections by in situ mass spectrometry and machine learning to classify the nephrotic syndrome. J Proteome Res. 2023;22:967-76.
56. Wu H, Yin H, Chen H, et al. A deep learning-based smartphone platform for cutaneous lupus erythematosus classification assistance: Simplifying the diagnosis of complicated diseases. J Am Acad Dermatol. 2021;85:792-3.
57. Guo LN, Said JT, Woodbury MJ, Nambudiri VE, Merola JF. Development and validation of algorithms to identify individuals with cutaneous lupus from healthcare databases. J Cutan Med Surg. 2025;29:131-6.
58. Martínez BA, Shrotri S, Kingsmore KM, Bachali P, Grammer AC, Lipsky PE. Machine learning reveals distinct gene signature profiles in lesional and nonlesional regions of inflammatory skin diseases. Sci Adv. 2022;8:eabn4776.
59. Lee DJ, Tsai PH, Chen CC, Dai YH. Incorporating knowledge of disease-defining hub genes and regulatory network into a machine learning-based model for predicting treatment response in lupus nephritis after the first renal flare. J Transl Med. 2023;21:76.
60. Ayoub I, Wolf BJ, Geng L, et al. Prediction models of treatment response in lupus nephritis. Kidney Int. 2022;101:379-89.
61. Wolf BJ, Spainhour JC, Arthur JM, Janech MG, Petri M, Oates JC. Development of biomarker models to predict outcomes in lupus nephritis. Arthritis Rheumatol. 2016;68:1955-63.
62. Helget LN, Dillon DJ, Wolf B, et al. Development of a lupus nephritis suboptimal response prediction tool using renal histopathological and clinical laboratory variables at the time of diagnosis. Lupus Sci Med. 2021;8:e000489.
63. Stojanowski J, Konieczny A, Rydzyńska K, et al. Artificial neural network - an effective tool for predicting the lupus nephritis outcome. BMC Nephrol. 2022;23:381.
64. Chen Y, Huang S, Chen T, et al. Machine learning for prediction and risk stratification of lupus nephritis renal flare. Am J Nephrol. 2021;52:152-60.
65. McDonald S, Yiu S, Su L, et al. Predictors of treatment response in a lupus nephritis population: lessons from the Aspreva Lupus Management Study (ALMS) trial. Lupus Sci Med. 2022;9:e000584.
66. Ceccarelli F, Olivieri G, Sortino A, et al. Comprehensive disease control in systemic lupus erythematosus. Semin Arthritis Rheum. 2021;51:404-8.
67. Shipa M, Santos LR, Nguyen DX, et al. Identification of biomarkers to stratify response to B-cell-targeted therapies in systemic lupus erythematosus: an exploratory analysis of a randomised controlled trial. Lancet Rheumatol. 2023;5:e24-35.
68. Moysidou GS, Garantziotis P, Sentis G, et al. Molecular basis for the disease-modifying effects of belimumab in systemic lupus erythematosus and molecular predictors of early response: blood transcriptome analysis implicates the innate immunity and DNA damage response pathways. Ann Rheum Dis. 2025;84:262-73.
69. Munroe ME, Blankenship D, DeFreese D, et al. A flare risk index informed by select immune mediators in systemic lupus erythematosus. Arthritis Rheumatol. 2023;75:723-35.
70. Garantziotis P, Nikolakis D, Doumas S, et al. Molecular taxonomy of systemic lupus erythematosus through data-driven patient stratification: molecular endotypes and cluster-tailored drugs. Front Immunol. 2022;13:860726.
71. Qiao J, Zhang SX, Chang MJ, et al. Deep stratification by transcriptome molecular characters for precision treatment of patients with systemic lupus erythematosus. Rheumatology. 2023;62:2574-84.
72. Toro-Domínguez D, Lopez-Domínguez R, García Moreno A. et al. Differential treatments based on drug-induced gene expression signatures and longitudinal systemic lupus erythematosus stratification. Sci Rep. 2019;9:15502.
73. Kan H, Nagar S, Patel J, Wallace DJ, Molta C, Chang DJ. Longitudinal treatment patterns and associated outcomes in patients with newly diagnosed systemic lupus erythematosus. Clin Ther. 2016;38:610-24.
74. Maeda S, Hashimoto H, Maeda T, et al. High-dimensional analysis of T-cell profiling variations following belimumab treatment in systemic lupus erythematosus. Lupus Sci Med. 2023;10:e000976.
75. Jorge AM, Smith D, Wu Z, et al. Exploration of machine learning methods to predict systemic lupus erythematosus hospitalizations. Lupus. 2022;31:1296-305.
Cite This Article
How to Cite
Download Citation
Export Citation File:
Type of Import
Tips on Downloading Citation
Citation Manager File Format
Type of Import
Direct Import: When the Direct Import option is selected (the default state), a dialogue box will give you the option to Save or Open the downloaded citation data. Choosing Open will either launch your citation manager or give you a choice of applications with which to use the metadata. The Save option saves the file locally for later use.
Indirect Import: When the Indirect Import option is selected, the metadata is displayed and may be copied and pasted as needed.
About This Article
Special Topic
Copyright

Data & Comments
Data
0


Comments
Comments must be written in English. Spam, offensive content, impersonation, and private information will not be permitted. If any comment is reported and identified as inappropriate content by OAE staff, the comment will be removed without notice. If you have any queries or need any help, please contact us at [email protected].