


The association of PGC-1α and its single-nucleotide polymorphism with the lipid metabolic disorders of diabetic kidney disease in patients with type 2 diabetes
 0
0 
Abstract
Aim: This study aimed to explore the correlation between peroxisome proliferator-activated receptor γ coactivator 1α (PGC-1α) and diabetic kidney disease (DKD) susceptibility in the Han Chinese population.
Methods: The distribution of Gly482Ser (rs8192678) and its relationship with blood PGC-1α messenger RNA (mRNA) expression were examined in healthy volunteers, patients with type 2 diabetes mellitus (T2DM), and those with DKD. The single-nucleotide polymorphism was genotyped using a DNA extraction kit and TaqMan-minor groove binder (MGB) probe real-time polymerase chain reaction.
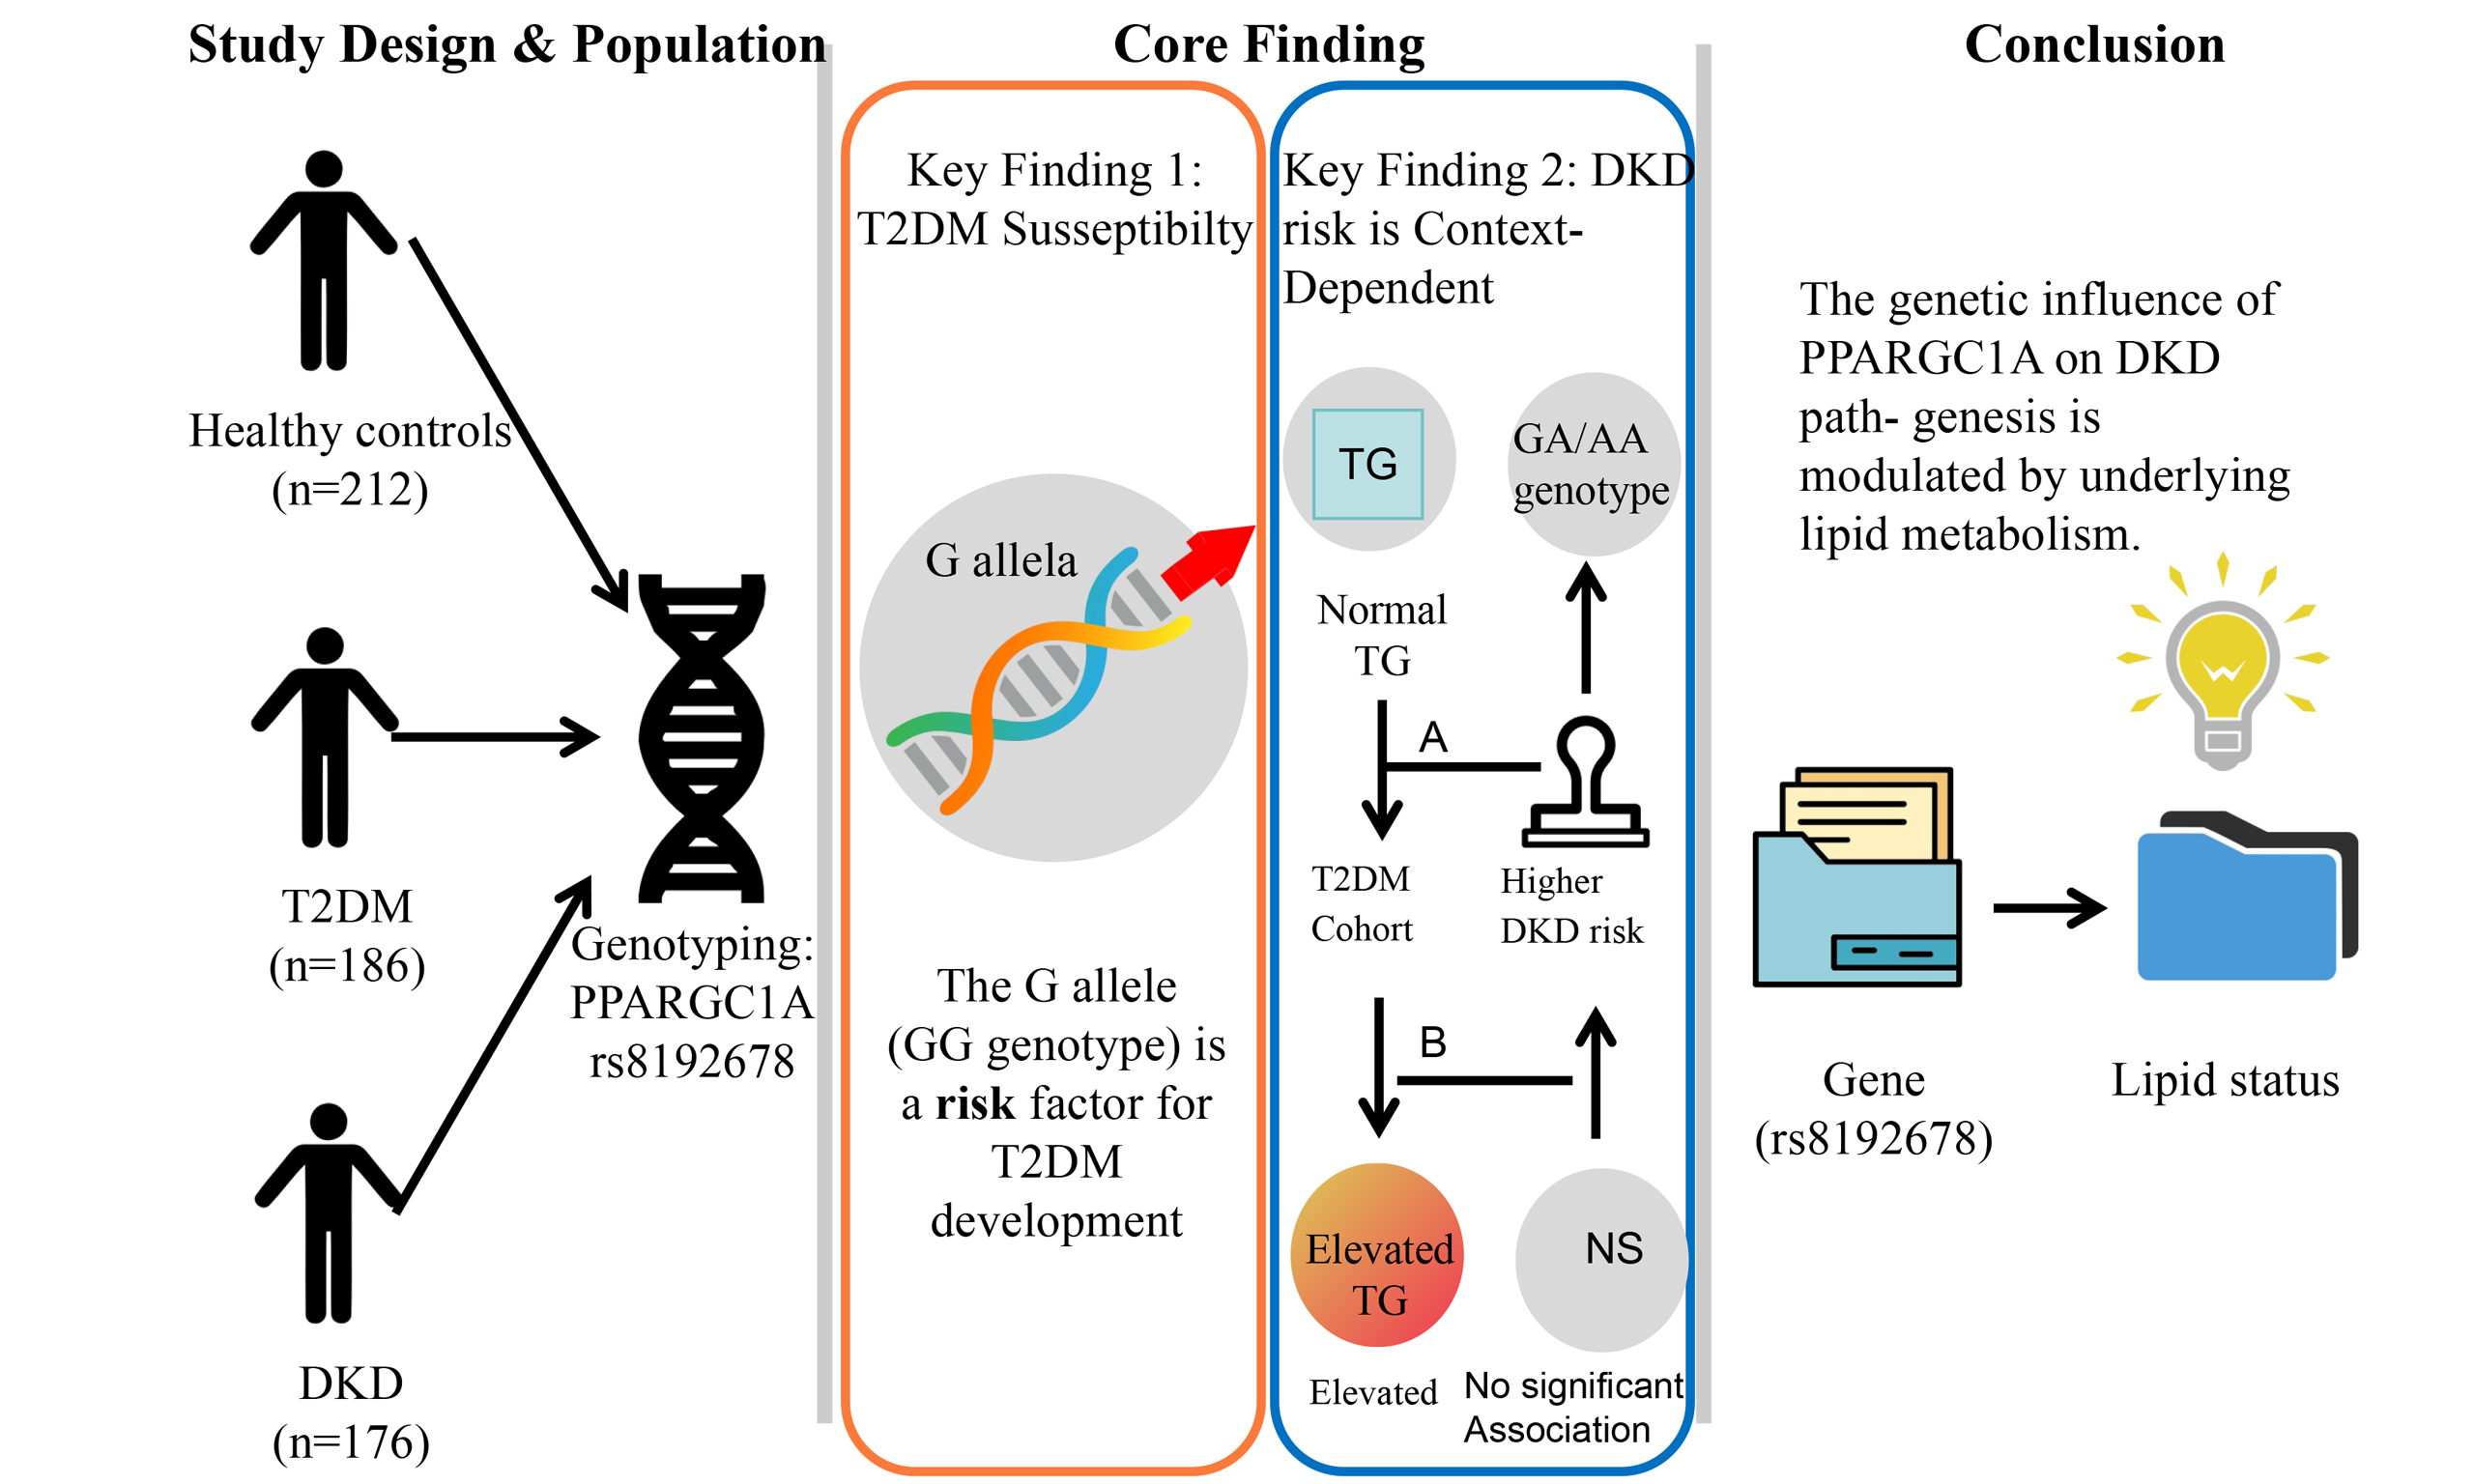
Results: We enrolled 574 subjects: 212 healthy controls, 186 with T2DM, and 176 with DKD. The rs8192678 AA genotype was more frequent in controls than in T2DM or DKD groups (P < 0.001). Under additive, dominant, and recessive models, the GG genotype was linked to higher T2DM risk after age and sex adjustment (P < 0.001), but not to progression from T2DM to DKD. PGC-1α mRNA levels were also higher in AA carriers than in GG carriers across all groups (P < 0.05).
Conclusion: Our study identifies the G allele of PPARGC1A rs8192678 as a risk factor for T2DM, but its role in DKD is context-dependent. Although not a risk factor in the general T2DM population, this allele is linked to higher DKD risk specifically in patients with normal triglyceride levels. This association was driven by the GA and AA genotypes, not the GG genotype, highlighting the complex interplay between genetics and metabolic state in DKD.
Keywords
INTRODUCTION
Diabetic kidney disease (DKD) is a common microvascular complication of diabetes mellitus (DM)[1,2]. Approximately 30%-40% of diabetic patients may develop DKD, which is a leading cause of end-stage renal disease (ESRD) and significantly contributes to the mortality rate in diabetic patients[3-6]. With our modern lifestyle transitioning towards sedentary habits, high-fat, and high-fructose diets, there has been an increasing prevalence of lipid metabolic disorders[7]. Long-term lipid metabolic disorders are also a major factor leading to the development of DKD[8].
Genetic and environmental factors play crucial roles in the development of DKD[9]. Peroxisome proliferator-activated receptor γ coactivator 1α (PGC-1α) is regulated by the PPARGC1A gene, and the expression of PGC-1α can modulate lipid secretion, fatty acid metabolism, and insulin sensitivity[10]. Therefore, the PGC-1α gene is a candidate gene for studying the lipid metabolic disorders in DKD. Genetic variations in this gene have been identified and are of scientific interest due to their potential influence on several health conditions. Among these variants, the Gly482Ser polymorphism, also known as rs8192678, is particularly noteworthy. This variant is characterized by a guanine-to-adenine transition (a G-to-A nucleotide substitution)[11]. This change results in the substitution of the glycine (G) amino acid at position 482 with serine (S) in exon 8. Such alterations in protein structure can potentially affect the function of the PPARGC1A gene[11]. However, findings have been inconsistent, and previous research has found that the rs8192678 A allele of PPARGC1A may be one of the risk factors for type 2 diabetes mellitus (T2DM)[12,13]. Moreover, a study focusing on the Malaysian population found that rs8192678 is associated with DKD[14].
However, genetic associations can vary substantially across different ethnicities. To date, there has been no comprehensive study evaluating the role of this polymorphism in the Chinese Han population. Therefore, this study detects the polymorphism of rs8192678 in Chinese Han healthy volunteers, T2DM, and DKD patients, and in combination with the messenger RNA (mRNA) expression of PGC-1α, aims to explore its correlation with T2DM and DKD susceptibility in this specific population.
METHODS
Subjects
This case-control study with a cross-sectional design was conducted from October 15, 2022, to May 15, 2023, in the Nephrology and Endocrinology departments of Shunyi Hospital, affiliated with Beijing Hospital of Traditional Chinese Medicine. It encompassed three groups: (1) patients with T2DM who had DKD, (2) patients with T2DM but without DKD, and (3) healthy volunteers. Individuals aged 18 years and above were enlisted from both outpatient and inpatient units. At the point of recruitment, pertinent clinical and biochemical data were gathered, including total cholesterol (TC), triglyceride (TG), low-density lipoprotein cholesterol (LDL-C), and high-density lipoprotein cholesterol (HDL-C). Additionally, 6 mL of ethylenediaminetetraacetic acid (EDTA)-anticoagulated whole blood was collected from all participants and stored at -80 °C. The study protocol received approval from the Medical Ethics Committee of Shunyi Hospital, Beijing Hospital of Traditional Chinese Medicine, Beijing, China (Approval number: 2022SYKY007-01), and written informed consent was obtained from all participants. The study was registered with the China Clinical Trial Registry Center under the number ChiCTR2200064703. The diagnosis of T2DM was established according to the World Health Organization 1999 criteria[15] and was further confirmed by typical clinical features, including onset in adulthood (age > 30 years), absence of ketonuria or episodes of ketoacidosis at diagnosis, and no history of continuous insulin use within the first year following diagnosis. Patients with known or suspected type 1 diabetes, maturity-onset diabetes of the young (MODY), or other specific types of diabetes were excluded from the study. DKD was defined according to the Kidney Disease: Improving Global Outcomes (KDIGO) 2022 Clinical Practice Guideline for Diabetes Management in Chronic Kidney Disease[16].
Stratification criteria
For subgroup analyses, participants were stratified based on clinical indices. “Normal” TG was defined as TG < 1.7 mmol/L, and “abnormal” as TG ≥ 1.7 mmol/L, according to the Chinese guidelines for the prevention and treatment of dyslipidemia in adults[17]. Similarly, “normal” TC was defined as TC < 5.2 mmol/L. The atherosclerosis index (AI) was calculated as (TC - HDL-C)/HDL-C, with AI < 4 considered “normal” and AI ≥ 4 considered “abnormal”, a threshold commonly used to indicate increased cardiovascular risk[18].
DNA extraction and genotyping analysis
Genomic DNA was extracted from peripheral blood lymphocytes using the FlexGen Blood DNA Kit (Mei5bio, Beijing, China) according to the manufacturer’s instructions and diluted to 20 ng/μL. Polymerase chain reaction (PCR) amplification of PGC-1α was performed using a total reaction volume of 25 μL, which included 12.5 μL of 2 × Taq Master Mix (Thermo Scientific, USA), 50 ng of DNA, and 3 pmol of each probe (Applied Biosystems, USA). The PCR protocol involved 40 cycles of denaturation at 92 °C for 15 s, annealing at 60 °C for 60 s, followed by a final extension at 95 °C for 10 min. All primers used in single-nucleotide polymorphism (SNP) detection were procured from Applied Biosystems. In order to validate the genotyping accuracy, a selection of PCR products was sequenced using biotechnological methods, and the outcomes were confirmed through TaqMan genotyping. The primer sequences used for the PCR were rs8192678, 5’-ATCACTAAGTCAACCACCTCAA-3’ (forward) and 5’-CATCACTCCCAGCCCTCTAA-3’(reverse).
RNA extraction and genotyping analysis
In accordance with the manufacturer’s instructions, total RNA was obtained from peripheral blood lymphocytes using the Whole Blood Total RNA Extraction Kit (Mei5bio, Beijing, China). Reverse transcription was carried out using the RevertAid First Strand cDNA (complementary DNA) Synthesis Kit (Mei5bio). Quantitative real-time PCR analysis was performed using the UltraSYBR Mixture (Mei5bio) on the 7500 Fast Real-Time PCR System (Applied Biosystems, Waltham, MA, USA), with the primer sets indicated in Table 1. All primers used for PCR analysis were synthesized by Shanghai Jierui Bioengineering Co., Ltd. (Shanghai, China).
Primer sequences for real-time PCR
| Gene primer sequence (5’-3’) | ||
| PGC-1α | F: TCTGAGTCTGTATGGAGTGACAT | R: CCAAGTCGTTCACATCTAGTTCA |
| β-actin | F: AGGCATCCTCACCCTGAAGTA | R: CACACGCAGCTCATTGTAGA |
Statistical analysis
Statistical analyses were performed using SPSS (Statistical Package for the Social Sciences) 22.0 software (IBM SPSS, Inc., Chicago, IL, USA). Quantitative data were presented as mean ± standard deviation or as median (interquartile range) for non-normally distributed variables. Categorical data were presented as frequencies and percentages. Differences in continuous clinical features among the three groups were analyzed using the Kruskal-Wallis H test, and differences in categorical variables were analyzed using the Chi-square test. The Hardy-Weinberg equilibrium analysis for the SNP and the genotype and allele frequencies of the SNP were compared using Chi-square tests. Associations between rs8192678 and susceptibility to T2DM and susceptibility to DKD within the T2DM population were assessed through three genetic models (additive, dominant, and recessive) using multivariate logistic regression. Given the variables available in this dataset, the primary analyses were adjusted for age and gender. We acknowledge that other important confounders [e.g., body mass index (BMI), blood pressure, hemoglobin A1c (HbA1c)] were not available for adjustment; this limitation is discussed in detail later. Comparison of quantitative clinical data among three groups was conducted using one-way analysis of variance, while comparison between two groups was conducted using Student’s t-test. Categorical data were analyzed by the Chi-square test, with a threshold of P < 0.05 to determine statistical significance.
RESULTS
Participant characteristics, genotype distributions, and allele frequencies
The participants’ clinical characteristics are summarized in Table 2. Kruskal-Wallis H tests revealed significant differences among the three groups in age, serum creatinine (Scr), TC, TG, LDL-C, HDL-C, and the AI (all P < 0.01). Moreover, chi-square tests showed significant differences in genotype distributions and allele frequencies (all P < 0.001). No significant difference was found only in gender distribution (P = 0.183) among the groups.
Clinical characteristics and genotype and allele frequencies of SNP rs8192678 among the Control, T2DM-only, and DKD groups
| Variable | Control group (N = 212) | T2DM-only group (N = 186) | DKD group (N = 176) | Statistical test value | P value |
| Continuous variables | |||||
| Age (years) | 72 (67,74) | 61 (54,69) | 61 (53,69) | H:108.07 | < 0.001 |
| Scr (μmol/L) | 75.00 (63.00, 86.00) | 62.00 (51.25, 72.40) | 77.75 (62.25, 120.33) | H:73.420 | < 0.001 |
| TC (mmol/L) | 4.80 (4.12, 5.45) | 4.29 (3.53, 5.08) | 4.60 (3.63, 5.54) | H:18.971 | < 0.001 |
| TG (mmol/L) | 1.18 (0.80, 1.80) | 1.53 (1.07, 2.43) | 1.58 (1.11, 2.37) | H:29.451 | < 0.001 |
| LDL-C (mmol/L) | 2.87 (2.35, 3.39) | 2.58 (1.96, 3.11) | 2.58 (1.88, 3.52) | H:13.858 | < 0.001 |
| HDL-C (mmol/L) | 1.28 (1.11, 1.56) | 1.01 (0.84, 1.18) | 0.99 (0.82, 1.29) | H:90.796 | < 0.001 |
| Atherosclerosis index (AI) | 2.63 (1.96, 3.46) | 3.22 (2.44, 4.20) | 3.40 (2.43, 4.49) | H:34.468 | < 0.001 |
| Categorical variables, n (%) | |||||
| Men, n (%) | 128 (60.4%) | 101 (54.3%) | 112 (63.6) | χ 2: 3.399 | 0.183 |
| Genotype | |||||
| GG | 40 (18.9%) | 97 (52.2%) | 96 (54.5%) | χ 2: 86.957 | < 0.001 |
| GA | 74 (34.9%) | 70 (37.6%) | 64 (36.4%) | ||
| AA | 98 (46.2%) | 19 (10.2%) | 16 (9.1%) | ||
| Allele | |||||
| G | 154 (36.3%) | 264 (71.0%) | 256 (72.7%) | χ 2: 139.266 | < 0.001 |
| A | 270 (63.7%) | 108 (29.0%) | 96 (27.3%) | ||
Genotype Distributions and Allele Frequencies between the Control and Combined T2DM Groups.
Table 3 presents the genotype and allele frequencies of SNP rs8192678 in the Control group (N = 212) and the combined T2DM group (N = 362), which includes both T2DM-only and T2DM with DKD patients. Chi-square tests revealed significant differences in the genotype distributions and allele frequencies between the two groups (P < 0.001).
Genotype and allele frequencies of SNP rs8192678 in the Control group and the combined T2DM group
| Variable | Control group (N = 212) | Combined T2DM group (N = 362) | Statistical test value | P value |
| Genotype, n (%) | ||||
| GG | 40 (18.9%) | 193 (53.3%) | χ 2 = 86.96 | < 0.001 |
| GA | 74 (34.9%) | 134 (37.0%) | ||
| AA | 98 (46.2%) | 35 (9.7%) | ||
| Allele, n (%) | ||||
| G | 154 (36.3%) | 520 (71.8%) | χ 2 = 139.27 | < 0.001 |
| A | 270 (63.7%) | 204 (28.2%) |
Relationship between PPARGC1A rs8192678 Polymorphism and T2DM susceptibility
We examined the association between the rs8192678 polymorphism and susceptibility to T2DM through three genetic models (additive, dominant, and recessive) by comparing the combined T2DM group (including both T2DM-only and T2DM with DKD patients) against the healthy controls. In the dominant model, carriers of the GG genotype had a significantly higher risk of T2DM than carriers of the A allele (GA + AA genotypes). Specifically, the GG genotype was associated with an approximately 5.8-fold increased risk [odds ratio (OR) = 1/0.171≈5.85; 95% confidence interval (CI): 1/0.227-1/0.129≈4.4-7.8], with P < 0.001. In the additive model, using GG as the reference, the risk of T2DM was significantly lower for the GA and AA genotypes (GA vs. GG: OR 0.262, 95%CI 0.194-0.354; AA vs. GG: OR 0.057, 95%CI 0.038-0.085; P < 0.001). In the recessive model, the OR for AA compared with GG + GA was 0.116 (95%CI 0.081-0.168; P < 0.001). The results remained unchanged after adjustment for age and sex [Table 4].
Genetic model analyses of the association between rs8192678 and T2DM susceptibility (combined T2DM patients vs. controls), adjusted for age and sex
| Genetic models | Geno type | Control group (N = 212) | Combined T2DM group (N = 362) | Without adjustment | With adjustment¶ | ||
| OR (95%CI) | P | OR (95%CI) | P | ||||
| Additive | GG | 40 (18.9%) | 193 (53.3%) | 1# | 1# | ||
| GA | 74 (34.9%) | 134 (37.0%) | 0.262 (0.194-0.354) | < 0.001 | 0.265 (0.196-0.358) | < 0.001 | |
| AA | 98 (46.2%) | 35 (9.7%) | 0.057 (0.038-0.085) | < 0.001 | 0.057 (0.038-0.086) | < 0.001 | |
| Dominant | GG | 40 (18.9%) | 193 (53.3%) | 1# | < 0.001 | 1# | < 0.001 |
| GA + AA | 172 (81.1%) | 169 (46.7%) | 0.171 (0.129-0.227) | 0.173 (0.130-0.229) | |||
| Recessive | GG + GA | 114 (53.8%) | 327 (90.3%) | 1# | < 0.001 | 1# | < 0.001 |
| AA | 98 (46.2%) | 35 (9.7%) | 0.116 (0.081-0.168) | 0.117 (0.081-0.168) | |||
Relationship between PPARGC1A rs8192678 polymorphism and DKD incidence in T2DM patients
We examined the association between rs8192678 polymorphism and DKD incidence in T2DM patients through three genetic models (additive, dominant, and recessive). No statistically significant associations were observed in any of the genetic models. In the dominant model, the OR for GA + AA compared with GG was 0.756 (95%CI 0.562-1.017; P = 0.065). In the additive model, using GG as the reference, no significant risk alteration for DKD was observed for GA (OR 0.722, 95%CI 0.386-1.350; P = 0.307) or AA (OR 0.947, 95%CI 0.496-1.805; P = 0.868) genotypes. Similarly, in the recessive model, the OR for AA compared with GG + GA was 0.799 (95%CI 0.432-1.478; P = 0.474). The results remained unchanged after adjustment for age and sex [Table 5].
Genetic model analyses of the association between the rs8192678 and DKD in T2DM patients with adjustment for age and gender
| Genetic models | Geno type | T2DM-only group (N = 186) | DKD group (N = 176) | Without adjustment | With adjustment¶ | ||
| OR (95%CI) | P | OR (95%CI) | P | ||||
| Additive | GG | 97 (52.2%) | 96 (54.5%) | 1# | 1# | ||
| GA | 70 (37.6%) | 64 (36.4%) | 0.722 (0.386-1.350) | 0.307 | 0.671 (0.341-1.320) | 0.247 | |
| AA | 19 (10.2%) | 16 (9.1%) | 0.947 (0.496-1.805) | 0.868 | 0.841 (0.419-1.689) | 0.626 | |
| Dominant | GG | 97 (52.2%) | 96 (54.5%) | 1# | 0.065 | 1# | 0.099 |
| GA + AA | 89 (47.8%) | 80 (45.5%) | 0.756 (0.562-1.017) | 0.778 (0.577-1.048) | |||
| Recessive | GG + GA | 167 (89.8%) | 160 (91.9%) | 1# | 0.474 | 1# | 0.396 |
| AA | 19 (10.2%) | 16 (9.1%) | 0.799 (0.432-1.478) | 0.765 (0.412-1.420) | |||
Relationship between PPARGC1A rs8192678 polymorphism and DKD incidence in T2DM patients after TG stratification
We further examined the association between rs8192678 polymorphism and DKD incidence in T2DM patients, stratified by TG levels, through three genetic models.
In the normal TG subgroup, a statistically significant association was observed only in the dominant model. In this model, carriers of the GA + AA genotypes had a significantly higher risk of DKD compared with GG genotype carriers (OR 1.598, 95%CI 1.070-2.388; P = 0.022). No significant associations were observed in the additive model (GA vs. GG: OR 0.740, 95%CI 0.328-1.678; P = 0.471; AA vs. GG: OR 1.106, 95%CI 0.474-2.581; P = 0.815) or in the recessive model (AA vs. GG + GA: OR 0.861, 95%CI 0.385-1.923; P = 0.714).
In the abnormal TG subgroup, no statistically significant associations were observed in any of the three genetic models (all P > 0.05).
The results for both subgroups remained unchanged after adjustment for age and sex [Table 6].
Relationship between PPARGC1A rs8192678 polymorphism and DKD incidence in T2DM patients after TG stratification
| Genetic models | Geno type | T2DM-only group | DKD group | Without adjustment | With adjustment¶ | |||
| OR (95%CI) | P | OR (95%CI) | P | |||||
| Normal TG | Additive | GG | 110 (52.1%) | 116 (63.0%) | 1# | 1# | ||
| GA | 86 (40.8%) | 57 (31.0%) | 0.740 (0.328-1.678) | 0.471 | 0.919 (0.401-2.104) | 0.841 | ||
| AA | 15 (7.1%) | 11 (6.0%) | 1.106 (0.474-2.581) | 0.815 | 1.318 (0.550-3.158) | 0.536 | ||
| Dominant | GG | 110 (52.1%) | 116 (63.0%) | 1# | 0.022 | 1# | 0.042 | |
| GA + AA | 101 (47.9%) | 68 (37.0%) | 1.598 (1.070-2.388) | 1.524 (1.016-2.286) | ||||
| Recessive | GG + GA | 196 (92.9%) | 173 (94.0%) | 1# | 0.714 | 1# | 0.590 | |
| AA | 15 (7.1%) | 11 (6.0%) | 0.861 (0.385-1.923) | 0.800 (0.356-1.801) | ||||
| Abnormal TG | Additive | GG | 98 (59.8%) | 103 (61.3%) | 1# | 1# | ||
| GA | 56 (34.1%) | 57 (33.9%) | 0.715 (0.271-1.887) | 0.498 | 0.589 (0.209-1.662) | 0.317 | ||
| AA | 10 (6.1%) | 8 (4.7%) | 0.772 (0.284-2.100) | 0.612 | 0.604 (0.207-1.855) | 0.356 | ||
| Dominant | GG | 98 (59.8%) | 103 (61.3%) | 1# | 0.539 | 1# | 0.588 | |
| GA + AA | 66 (41.2%) | 65 (38.7%) | 0.870 (0.558-1.356) | 0.884 (0.566-1.381) | ||||
| Recessive | GG + GA | 154 (93.9%) | 160 (95.3%) | 1# | 0.528 | 1# | 0.513 | |
| AA | 10 (6.1%) | 8 (4.7%) | 0.735 (0.282-1.912) | 0.726 (0.278-1.896) | ||||
Baseline clinical features within each genotype group in T2DM and DKD normal TG subgroups
The clinical features stratified by the rs8192678 genotype in the normal TG subgroups are presented in Table 7. In the T2DM-only subgroup, significant differences were observed in TG and LDL-C levels (P < 0.05, Kruskal-Wallis H test). Post-hoc analysis revealed that AA genotype carriers had significantly lower TG levels compared with the GG group and lower LDL-C levels compared with the GA group.
Baseline clinical features within each genotype group in T2DM-only and DKD normal TG subgroups
| Variable | T2DM-only normal TG subgroup | P value | DKD normal TG subgroup | P value | ||||
| GG (N = 110) | GA (N=86) | AA (N = 15) | GG (N = 116) | GA (N = 57) | AA (N = 11) | |||
| Continuous variables | ||||||||
| Age (years) | 62.1 (56.0, 69.0) | 60.3 (53.0, 68.0) | 65.3 (59.5, 72.0) | 0.271 | 64.7 (57.0, 73.0) | 61.6 (53.0, 71.5) | 63.7 (59.0, 69.0) | 0.387 |
| TC (mmol/L) | 4.15 (3.50, 4.80) | 4.10 (3.40, 4.80) | 3.63 (2.90, 4.55) | 0.485 | 4.11 (3.40, 4.83) | 4.51 (3.50, 5.40) | 3.29 (2.70, 3.85) | 0.018 |
| TG (mmol/L) | 1.20 (0.95, 1.50) | 1.14 (0.90, 1.50) | 1.01 (0.90, 1.10) | 0.045 | 1.29 (1.10, 1.50) | 1.27 (1.00, 1.60) | 0.99 (0.80, 1.10) | 0.007 |
| LDL-C (mmol/L) | 2.54 (2.00, 3.10) | 2.37 (1.90, 2.90) | 1.91 (1.40, 2.50) | 0.038 | 2.39 (1.80, 3.10) | 2.81 (2.00, 3.50) | 1.98 (1.40, 2.50) | 0.002 |
| HDL-C (mmol/L) | 1.07 (0.90, 1.30) | 1.13 (0.90, 1.30) | 0.97 (0.80, 1.10) | 0.209 | 1.10 (0.90, 1.40) | 1.17 (0.90, 1.40) | 1.07 (0.90, 1.20) | 0.587 |
| Atherosclerosis index (AI) | 2.63 (1.80, 3.80) | 2.80 (2.00, 3.50) | 2.79 (2.20, 3.20) | 0.874 | 3.01 (2.10, 3.90) | 3.13 (2.10, 4.20) | 2.12 (1.70, 2.50) | 0.051 |
| Categorical variables, n (%) | ||||||||
| Men | 68 (61.8%) | 50 (58.1%) | 8 (53.3%) | 0.752 | 76 (65.5%) | 34 (63.0%) | 9 (81.8%) | 0.049 |
In the DKD subgroup, genotype was associated with significant differences in TG, TC, LDL-C levels, and sex distribution. Specifically, the AA genotype was associated with lower TG, TC, and LDL-C levels compared with the GA genotype, and lower TG levels compared with the GG genotype. Additionally, the AA genotype group had a significantly higher proportion of males than both the GG and GA groups. The GA genotype group also showed higher LDL-C levels compared with the GG group.
The relationship between PPARGC1A rs8192678 polymorphism and the incidence of DKD in T2DM patients after TC stratification
Data were stratified based on normal or abnormal TC levels, and the association of the rs8192678 polymorphism with DKD occurrence in T2DM patients was evaluated using three genetic models (additive, dominant, and recessive). No statistically significant associations were observed in either the normal TC or abnormal TC subgroups (all P > 0.05). After adjustment for age and sex, the results remained unchanged [Supplementary Table 1].
The relationship between PPARGC1A rs8192678 polymorphism and the incidence of DKD in T2DM patients after AI stratification
Data were stratified based on normal or abnormal AI levels, and the association of the rs8192678 polymorphism with DKD occurrence in T2DM patients was evaluated using three genetic models (additive, dominant, and recessive). No statistically significant associations were observed in the abnormal AI (AI ≥ 4) subgroup (all P > 0.05). In the normal AI (AI < 4) subgroup, although a potential association was suggested in the dominant model (OR 0.664, 95%CI 0.463-0.953; P = 0.056), it did not reach statistical significance. No significant associations were found in the additive or recessive models. After adjustment for age and sex, the results remained unchanged [Supplementary Table 2].
DISCUSSION
Genetic factors are important in the development of DM and DKD[1,2]. Our previous studies have revealed several genomic gene variations related to DKD in the Chinese Han population with diabetes, such as liver X receptor alpha (LXR-α), ATP-binding cassette transporter A1 (ABCA1)[19], myosin heavy chain 9 (MYH9), and apolipoprotein L1 (APOL1)[20]. To our knowledge, this is the first study to assess the potential link between PGC-1α expression and rs8192678 polymorphism and DKD susceptibility in the Chinese Han population.
This study reveals a distinct role of the PPARGC1A rs8192678 polymorphism in T2DM susceptibility versus DKD progression. We found that the rs8192678 GG genotype frequency was significantly higher in the combined T2DM group (53.3%) and the DKD group (54.5%) than in the healthy control group (19.6%). Correspondingly, across additive, dominant, and recessive genetic models, the GG genotype was consistently associated with a markedly higher risk of developing T2DM (P < 0.001), suggesting that the G allele may be a significant risk factor for T2DM. This finding contradicts previous studies[12,13] and further provides evidence for the distinct genetics of T2DM.
However, when analyzing the risk of progressing from T2DM to DKD within the diabetic population, our results demonstrated no statistically significant association between the rs8192678 polymorphism and DKD incidence in any genetic model. This indicates that while this polymorphism is strongly associated with the susceptibility to T2DM, it does not appear to be a primary driver for the development of DKD among diabetic patients.
A significant association with DKD risk was observed only under specific conditions. After stratifying T2DM patients by TG levels, we found that in the normal TG subgroup, carriers of the combined GA and AA genotypes had a significantly higher risk of DKD compared to GG genotype carriers in the dominant model (OR 1.598; P = 0.022). This suggests that the effect of this polymorphism on DKD risk may be dependent on lipid metabolic status. Furthermore, within the DKD normal TG subgroup, the AA genotype was linked with more favorable lipid profiles, including lower TG and LDL-C levels. This may be related to PGC-1α’s function as a nuclear receptor agonist that regulates lipid metabolism[21]. PGC-1α can upregulate the activity of liver X receptors (LXRs) and peroxisome proliferator-activated receptors (PPARs)[21]. LXRs control cholesterol reverse transport and intake, regulating cholesterol efflux via ABCA1 and ATP-binding cassette sub-family G member 1 (ABCG1), thus reversing cholesterol transport[22]. LXR activation is generally thought to slow atherosclerosis progression[22,23]. Peroxisome proliferator-activated receptor (PPAR)α participates in fatty acid oxidation, while PPARγ can increase fatty acid oxidation and oxidative phosphorylation to accelerate glycerol release[24,25]. In patients with non-alcoholic fatty liver disease (NAFLD), hepatic PGC-1α expression decreases by 40%, leading to insulin resistance, abnormal lipid accumulation, and mitochondrial dysfunction[26]. In diabetic kidneys, PGC-1α mRNA level decreases[27]. Murine studies show that reduced PGC-1α expression in insulin-sensitive tissues decreases glucose tolerance and insulin sensitivity, supporting the notion that diminished PGC-1α expression could increase DM risk[28]. Human studies have reported decreased PGC-1α mRNA expression in muscle and adipose tissue of DM patients[29]. A noticeable correlation exists between PGC-1α protein levels in adipose tissue and decreased insulin sensitivity[30]. Therefore, any genetic variables affecting PGC-1α expression could potentially contribute to the development and progression of conditions such as DM and DKD.
This study confirms the high prevalence of the PPARGC1A rs8192678 GG genotype in T2DM and DKD patients. In contrast, the AA genotype showed no difference in frequency between the T2DM and DKD groups, accounting for 10.2% and 9.1% of patients, respectively. This is consistent with the findings of Zhang et al.[31] in Chinese patients with NAFLD and Lin et al.[32] in obese Taiwanese children. The low AA genotype prevalence and consequent limited sample size may underpower the detection of its influence on DKD. According to the National Center for Biotechnology Information (NCBI) human SNP database, the A allele frequency of PPARGC1A rs8192678 is 0.453 in the Han Chinese population, whereas in our study, it was 29.9% and 27.3% in T2DM and DKD patients, respectively. Secondly, the complex biological role of PGC-1α and the precise mechanisms by which it contributes to DKD development remain to be fully elucidated[32].
Research shows that in NAFLD patients carrying the A allele, PGC-1α expression is significantly reduced[31]. Conversely, our study found that in whole blood from healthy controls, T2DM, and DKD patients, PGC-1α mRNA levels were significantly higher in AA genotype carriers than in GG carriers. While this appears contradictory to some prior reports, several mechanisms could explain the observation. The Gly482Ser (rs8192678) substitution may alter the protein's interaction with transcription factors or other co-regulators, potentially affecting the transcriptional activity or feedback regulation of the PPARGC1A gene itself, leading to increased mRNA expression. Alternatively, the A allele might enhance mRNA stability, resulting in higher steady-state levels. Additionally, tissue-specific (blood vs. muscle/liver) and disease-state (DM/DKD vs. NAFLD) differences in gene regulation could account for these divergent findings. Individuals with the PPARGC1A rs8192678 AA genotype appeared to gain greater advantages from weight reduction interventions, including dietary calorie restriction, bariatric surgery, and acarbose therapy[33,34], similar to our results.
Our study has several limitations. First and most critically, as rightly pointed out by the reviewers, key clinical confounders such as BMI, hypertension status, diabetes duration, and glycemic control (HbA1c) were not available in our dataset for adjustment in the multivariate analyses. The uneven distribution of these factors across genotype groups could potentially confound the observed genetic associations. For instance, if the high-risk GG genotype were also associated with poorer glycemic control or longer diabetes duration, the estimated genetic effect might be biased. Therefore, our findings, particularly the null association between rs8192678 and DKD in the overall cohort and the context-dependent association in the TG-stratified analysis, must be interpreted with caution and require validation in cohorts with comprehensively phenotyped clinical data. Second, the study has a single-center design and a relatively small sample size for mRNA expression analysis. Furthermore, our analysis focused on a single SNP; we did not account for potential gene-gene interactions or the polygenic background that may influence DKD risk. Future studies incorporating polygenic risk scores or genome-wide interaction analyses are warranted. Due to the presence and activity of RNases, which make RNA molecules highly unstable, RNA needs rapid extraction after blood draw. Additionally, given the small number of AA genotype carriers of rs8192678 in T2DM and DKD patients, the results should be interpreted with caution. Clearly, further validation of these preliminary findings is necessary.
Conclusions
In conclusion, our findings delineate distinct roles of the PPARGC1A rs8192678 polymorphism in T2DM susceptibility versus DKD progression. The G allele was identified as a risk factor for developing T2DM but did not confer an increased risk for DKD in the general T2DM population. A significant association with DKD risk was observed exclusively in T2DM patients with normal TG levels, in whom the GA and AA genotypes, rather than the GG genotype, were associated with higher risk. Furthermore, the AA genotype was linked to elevated PGC-1α mRNA expression in whole blood, contrasting with some previous reports. These results suggest that the effect of the PPARGC1A rs8192678 polymorphism on DKD pathogenesis is context-dependent, potentially modulated by lipid metabolic status, and may involve complex mechanisms beyond a simple reduction in PGC-1α expression. Confirmation of these findings will require additional studies with larger sample sizes.
DECLARATIONS
Authors’ contributions
Designed the research and wrote the manuscript: Wang Y, Liu P
Collected samples and analyzed data: Lan X, Jia Y, Shen Z, Wang C
Provided funding and revised the manuscript: Qiu X, Liu P
Availability of data and materials
All data relevant to the study are included in the article or uploaded as Supplementary Materials. Other raw/original data are available from the corresponding author upon reasonable request.
Financial support and sponsorship
This work was supported by the Capital’s Funds for Health Improvement and Research (No. 2022-4-7104).
Conflicts of interest
All authors declared that there are no conflicts of interest.
Ethical approval and consent to participate
This study was approved by the Medical Ethics Committee of Shunyi Hospital, Beijing Traditional Chinese Medicine Hospital, Beijing, China (Approval No. 2022SYKY007-01), and written informed consent was obtained from all participants.
Consent for publication
Not applicable.
Copyright
© The Author(s) 2026.
Supplementary Materials
REFERENCES
1. Duan J, Liu D, Zhao Z, et al. Short-term duration of diabetic retinopathy as a predictor for development of diabetic kidney disease. J Transl Int Med. 2023;11:449-58.
2. Liu D, Chen X, He W, et al. Update on the pathogenesis, diagnosis, and treatment of diabetic tubulopathy. Integr Med Nephrol Androl. 2024;11:e23-00029.
3. Zhao H, Zhao T, Li P. Gut microbiota-derived metabolites: a new perspective of traditional chinese medicine against diabetic kidney disease. Integr Med Nephrol Androl. 2024;11:e23-00024.
4. Zhao H, Li Z, Yan M, et al. Irbesartan ameliorates diabetic kidney injury in db/db mice by restoring circadian rhythm and cell cycle. J Transl Int Med. 2024;12:157-69.
5. Chung JY, Lan H, Tang PM. New insights into traditional chinese medicine in treatment of diabetic nephropathy. Integr Med Nephrol Androl. 2023;10:e00026.
6. Wu C, Wang J, Zhang R, et al. Research progress on Cornus officinalis and its active compounds in the treatment of diabetic nephropathy. Front Pharmacol. 2023;14:1207777.
7. Zhang R, Wang J, Wu C, Wang L, Liu P, Li P. Lipidomics-based natural products for chronic kidney disease treatment. Heliyon. 2025;11:e41620.
8. Deng Y, Zhu H, Xing J, et al. The role of natural products in improving lipid metabolism disorder-induced mitochondrial dysfunction of diabetic kidney disease. Front Physiol. 2025;16:1624077.
9. Ma L, Yan M, Kong X, et al. Association of EPHX2 R287Q polymorphism with diabetic nephropathy in Chinese type 2 diabetic patients. J Diabetes Res. 2018;2018:2786470.
10. Trombetta M, Bonetti S, Boselli ML, et al. PPARG2 Pro12Ala and ADAMTS9 rs4607103 as “insulin resistance loci” and “insulin secretion loci” in Italian individuals. The GENFIEV study and the verona newly diagnosed type 2 diabetes study (VNDS) 4. Acta Diabetol. 2013;50:401-8.
11. Yang R, Jin F, Wang L, et al. Prediction and identification of power performance using polygenic models of three single-nucleotide polymorphisms in Chinese elite athletes. Front Genet. 2021;12:726552.
12. Du F, Yang KJ, Piao LS. Correlation between PPARGC1A gene Rs8192678 G>A polymorphism and susceptibility to type-2 diabetes. Open Life Sci. 2019;14:43-52.
13. Xia W, Chen N, Peng W, et al. Systematic meta-analysis revealed an association of PGC-1α rs8192678 polymorphism in type 2 diabetes mellitus. Dis Markers. 2019;2019:2970401.
14. Seman N, Othman SH. Recent progress in genetics and epigenetics research on diabetic nephropathy in Malaysia. J Diabetes Res. 2023;2023:9053580.
15. Alberti KGMM, Zimmet P. Definition, diagnosis and classification of diabetes mellitus and its complications. Part 1: diagnosis and classification of diabetes mellitus. Provisional report of a WHO Consultation. Diabet Med. 1998;15:539-53.
16. Disease: Improving Global Outcomes (KDIGO) Diabetes Work Group. KDIGO 2022 clinical practice guideline for diabetes management in chronic kidney disease. Kidney Int. 2022;102:S1-S127.
17. Committee on the Chinese Guidelines for Lipid Management. Chinese guideline for lipid management (primary care version 2024). Chin J Cardiol. 2024;52:330-7.
18. Carvalho MO, Duque AP, Huguenin GVB, Felix Mediano MF, Rodrigues Júnior LF. Increased cardiometabolic risk in dynapenic obesity: results from the study of workers’ health (ESAT). Life. 2024;14:1174.
19. Liu P, Ma L, Zhao H, et al. Association between LXR-α and ABCA1 Gene Polymorphisms and the Risk of Diabetic Kidney Disease in Patients with Type 2 Diabetes Mellitus in a Chinese Han Population. J Diabetes Res. 2020;2020:8721536.
20. Freedman BI, Langefeld CD, Lu L, et al. Differential effects of MYH9 and APOL1 risk variants on FRMD3 Association with Diabetic ESRD in African Americans. PLoS Genet. 2011;7:e1002150.
21. Wang H, Su J, Yu M, Xia Y, Wei Y. PGC-1α in osteoarthritic chondrocytes: From mechanism to target of action. Front Pharmacol. 2023;14:1169019.
22. Savla SR, Prabhavalkar KS, Bhatt LK. Liver X receptor: a potential target in the treatment of atherosclerosis. Expert Opin Ther Targets. 2022;26:645-58.
23. Rasheed A, Cummins CL. Beyond the foam cell: the role of LXRs in preventing atherogenesis. Int J Mol Sci. 2018;19:2307.
24. Ahsan F, Oliveri F, Goud HK, et al. Pleiotropic effects of statins in the light of non-alcoholic fatty liver disease and non-alcoholic steatohepatitis. Cureus. 2020;12:e10446.
25. Luo L, Chua YB, Liu T, et al. Muscle injuries induce a prostacyclin-PPARγ/PGC1a-FAO spike that boosts regeneration. Adv Sci. 2023;10:e2301519.
26. Ahrens M, Ammerpohl O, von Schönfels W, et al. DNA methylation analysis in nonalcoholic fatty liver disease suggests distinct disease-specific and remodeling signatures after bariatric surgery. Cell Metab. 2013;18:296-302.
27. Chambers JM, Wingert RA. PGC-1α in disease: recent renal insights into a versatile metabolic regulator. Cells. 2020;9:2234.
28. Besse-Patin A, Léveillé M, Oropeza D, Nguyen BN, Prat A, Estall JL. Estrogen signals through peroxisome proliferator-activated receptor-γ coactivator 1α to reduce oxidative damage associated with diet-induced fatty liver disease. Gastroenterology. 2017;152:243-56.
29. Ghosh S, Lertwattanarak R, Lefort N, et al. Reduction in reactive oxygen species production by mitochondria from elderly subjects with normal and impaired glucose tolerance. Diabetes. 2011;60:2051-60.
30. Hammarstedt A, Jansson PA, Wesslau C, Yang X, Smith U. Reduced expression of PGC-1 and insulin-signaling molecules in adipose tissue is associated with insulin resistance. Biochem Biophys Res Commun. 2003;301:578-82.
31. Zhang RN, Shen F, Pan Q, Cao HX, Chen GY, Fan JG. PPARGC1A rs8192678 G>A polymorphism affects the severity of hepatic histological features and nonalcoholic steatohepatitis in patients with nonalcoholic fatty liver disease. World J Gastroenterol. 2021;27:3863-76.
32. Lin YC, Chang PF, Chang MH, Ni YH. A common variant in the peroxisome proliferator-activated receptor-γ coactivator-1α gene is associated with nonalcoholic fatty liver disease in obese children. Am J Clin Nutr. 2013;97:326-31.
33. Goyenechea E, Crujeiras AB, Abete I, Parra D, Martínez JA. Enhanced short-term improvement of insulin response to a low-caloric diet in obese carriers the Gly482Ser variant of the PGC-1alpha gene. Diabetes Res Clin Pract. 2008;82:190-6.
Cite This Article
How to Cite
Download Citation
Export Citation File:
Type of Import
Tips on Downloading Citation
Citation Manager File Format
Type of Import
Direct Import: When the Direct Import option is selected (the default state), a dialogue box will give you the option to Save or Open the downloaded citation data. Choosing Open will either launch your citation manager or give you a choice of applications with which to use the metadata. The Save option saves the file locally for later use.
Indirect Import: When the Indirect Import option is selected, the metadata is displayed and may be copied and pasted as needed.
About This Article
Copyright

Data & Comments
Data
0


Comments
Comments must be written in English. Spam, offensive content, impersonation, and private information will not be permitted. If any comment is reported and identified as inappropriate content by OAE staff, the comment will be removed without notice. If you have any queries or need any help, please contact us at [email protected].