


fig6
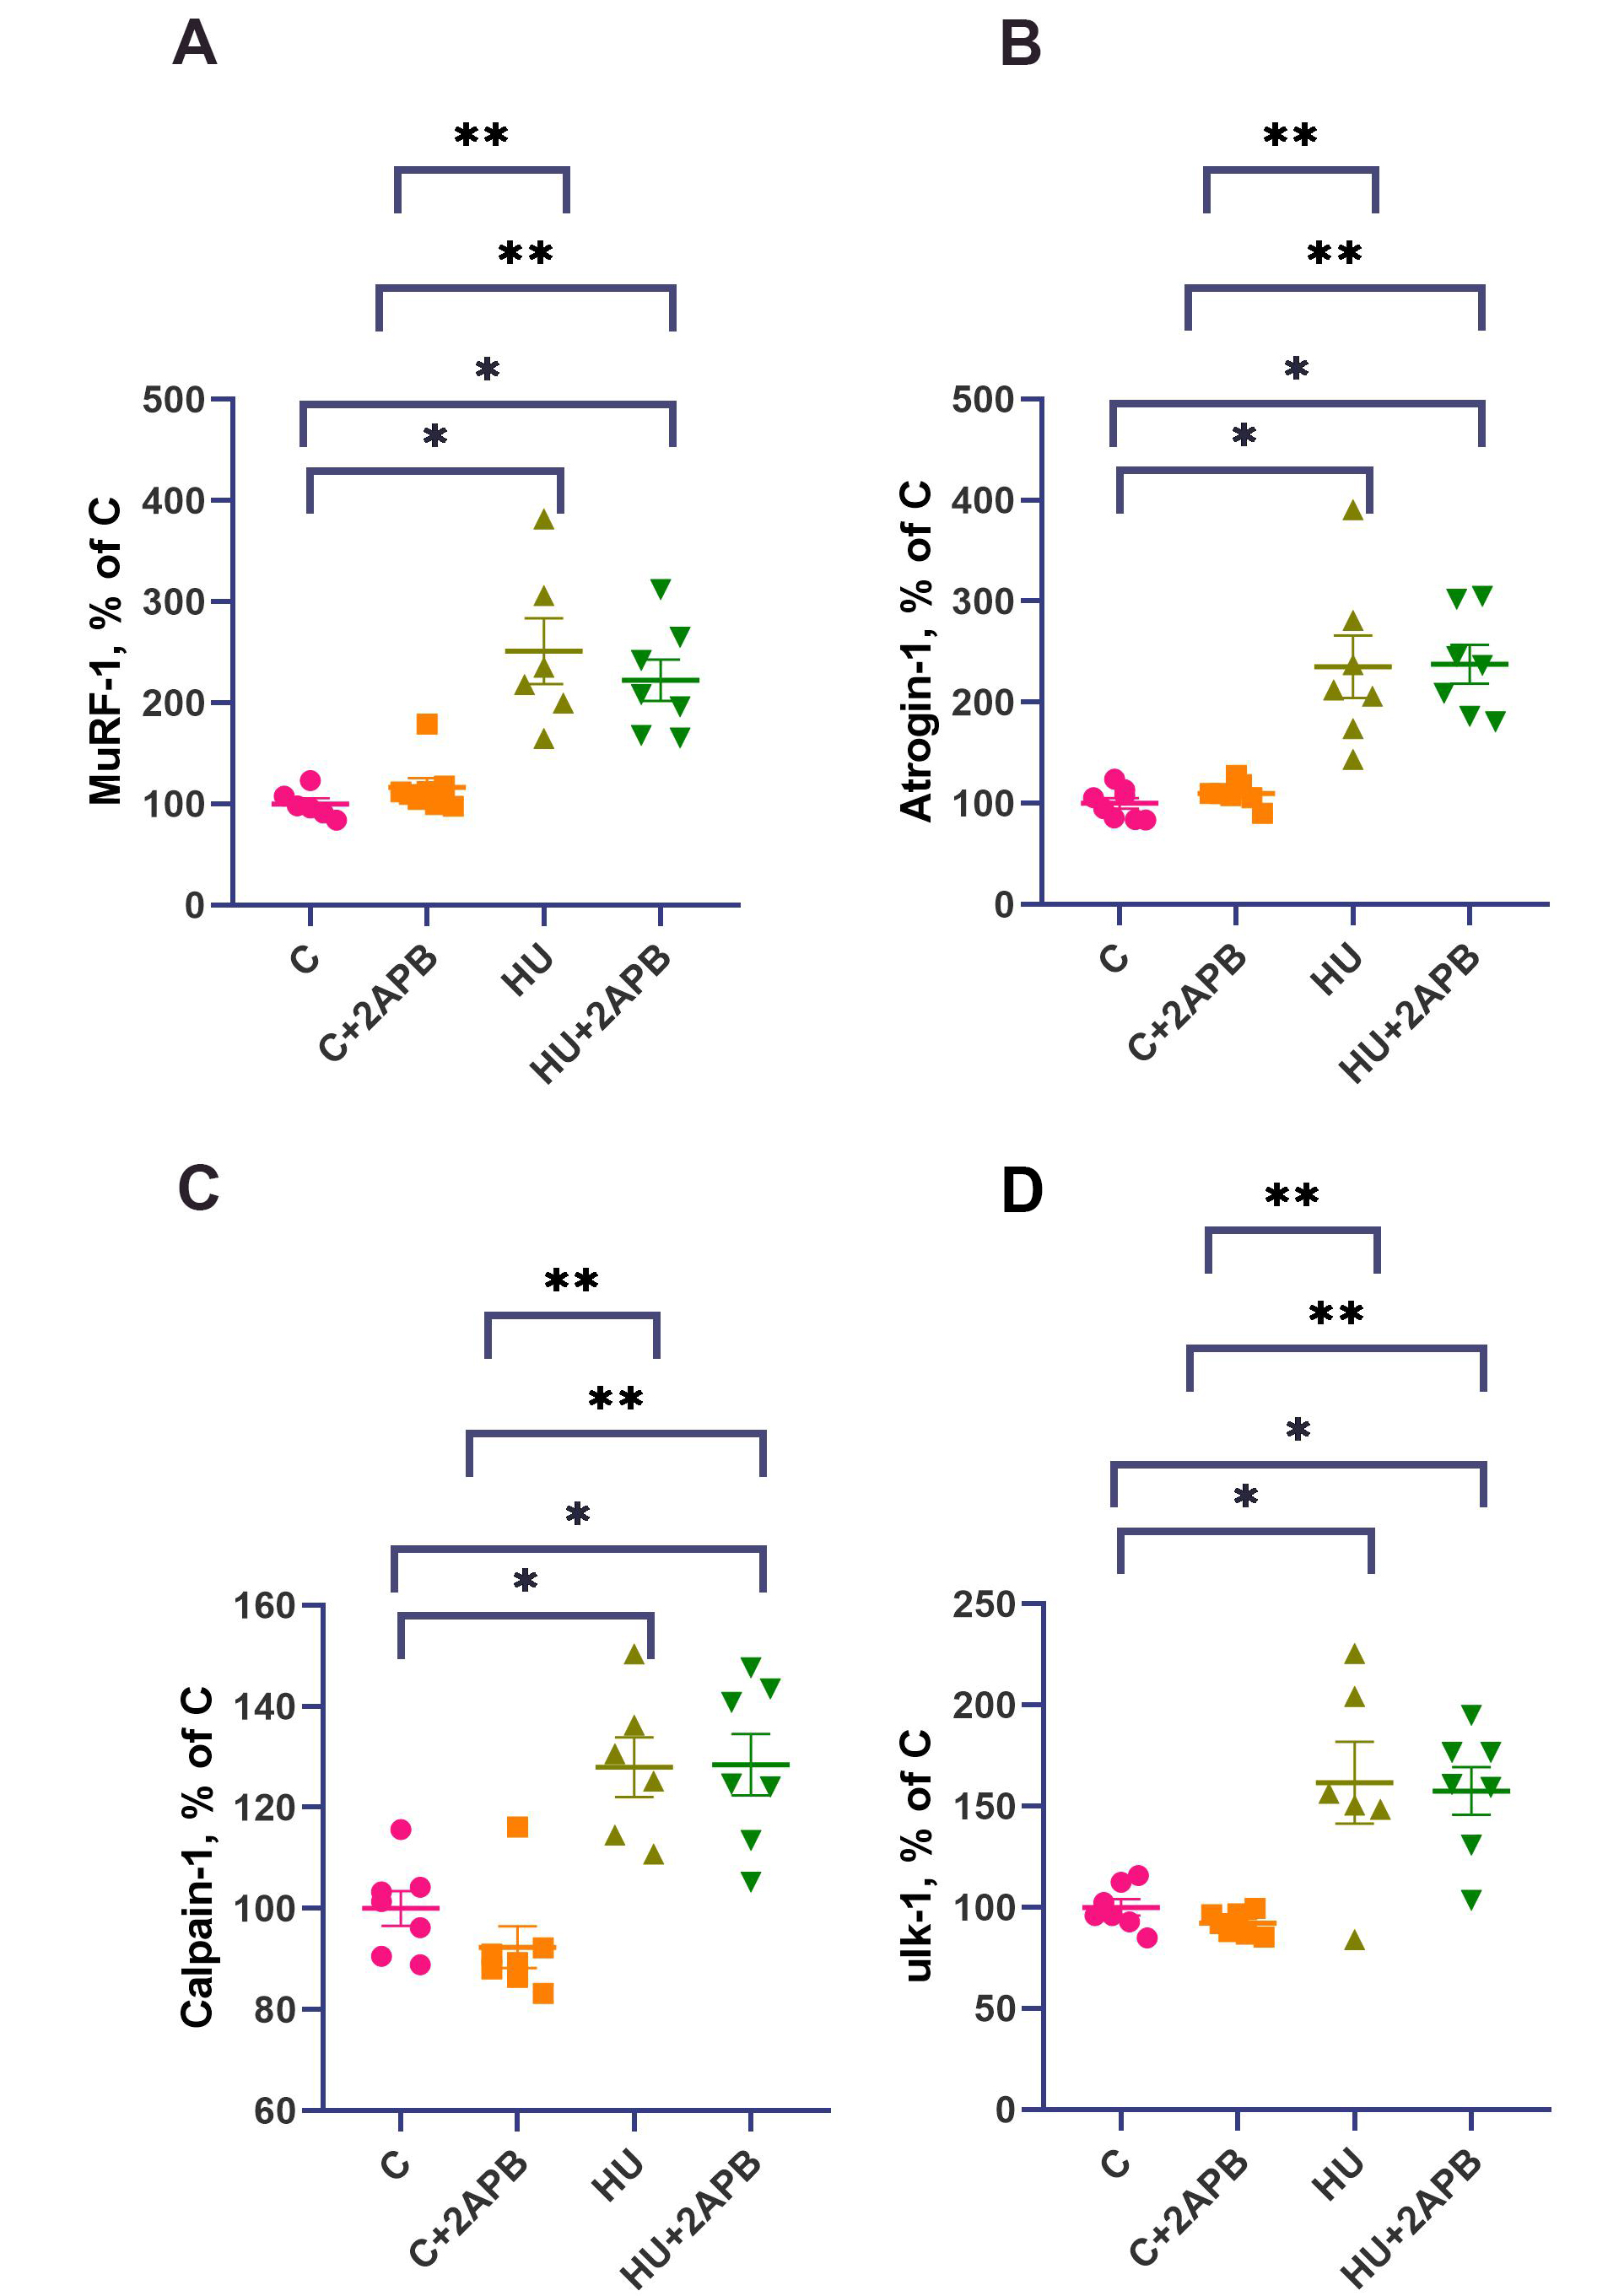
Figure 6. MuRF-1 (A), Atrogin-1 (B), calpain-1 (C) and ulk-1 (D) mRNA content. Data are shown as mean value±SEM. * - significantly different from the C group (P< 0.05). ** - significantly different from the 3CA group (P < 0.05). Gene expression was normalized to YWHAZ. HU: Hind limb unloading; SEM: standard error of the mean.


