


fig3
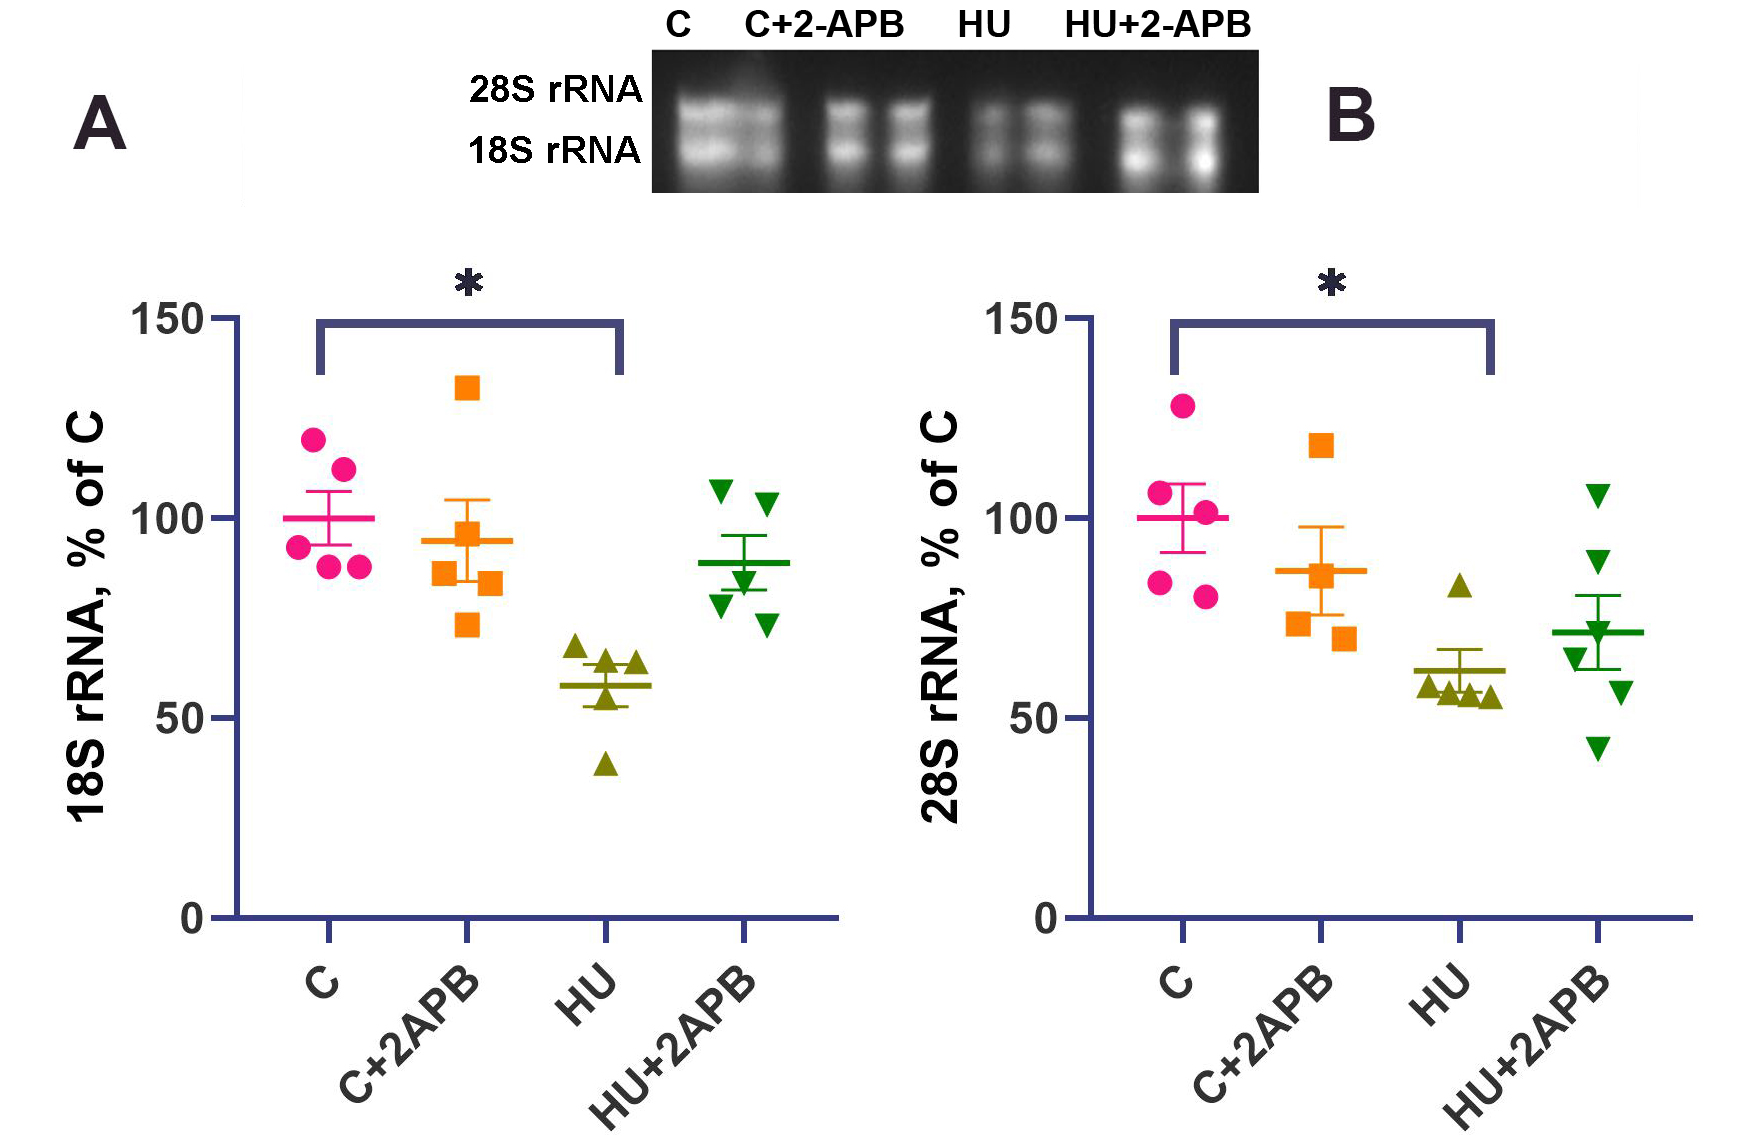
Figure 3. 18S rRNA content (A) and 28S rRNA content (B). Data are shown as mean value±SEM. * - significantly different from the C group (P < 0.05). HU: Hind limb unloading; SEM: standard error of the mean.
Figure 3. 18S rRNA content (A) and 28S rRNA content (B). Data are shown as mean value±SEM. * - significantly different from the C group (P < 0.05). HU: Hind limb unloading; SEM: standard error of the mean.


All published articles are preserved here permanently:
https://www.portico.org/publishers/oae/


