

fig2
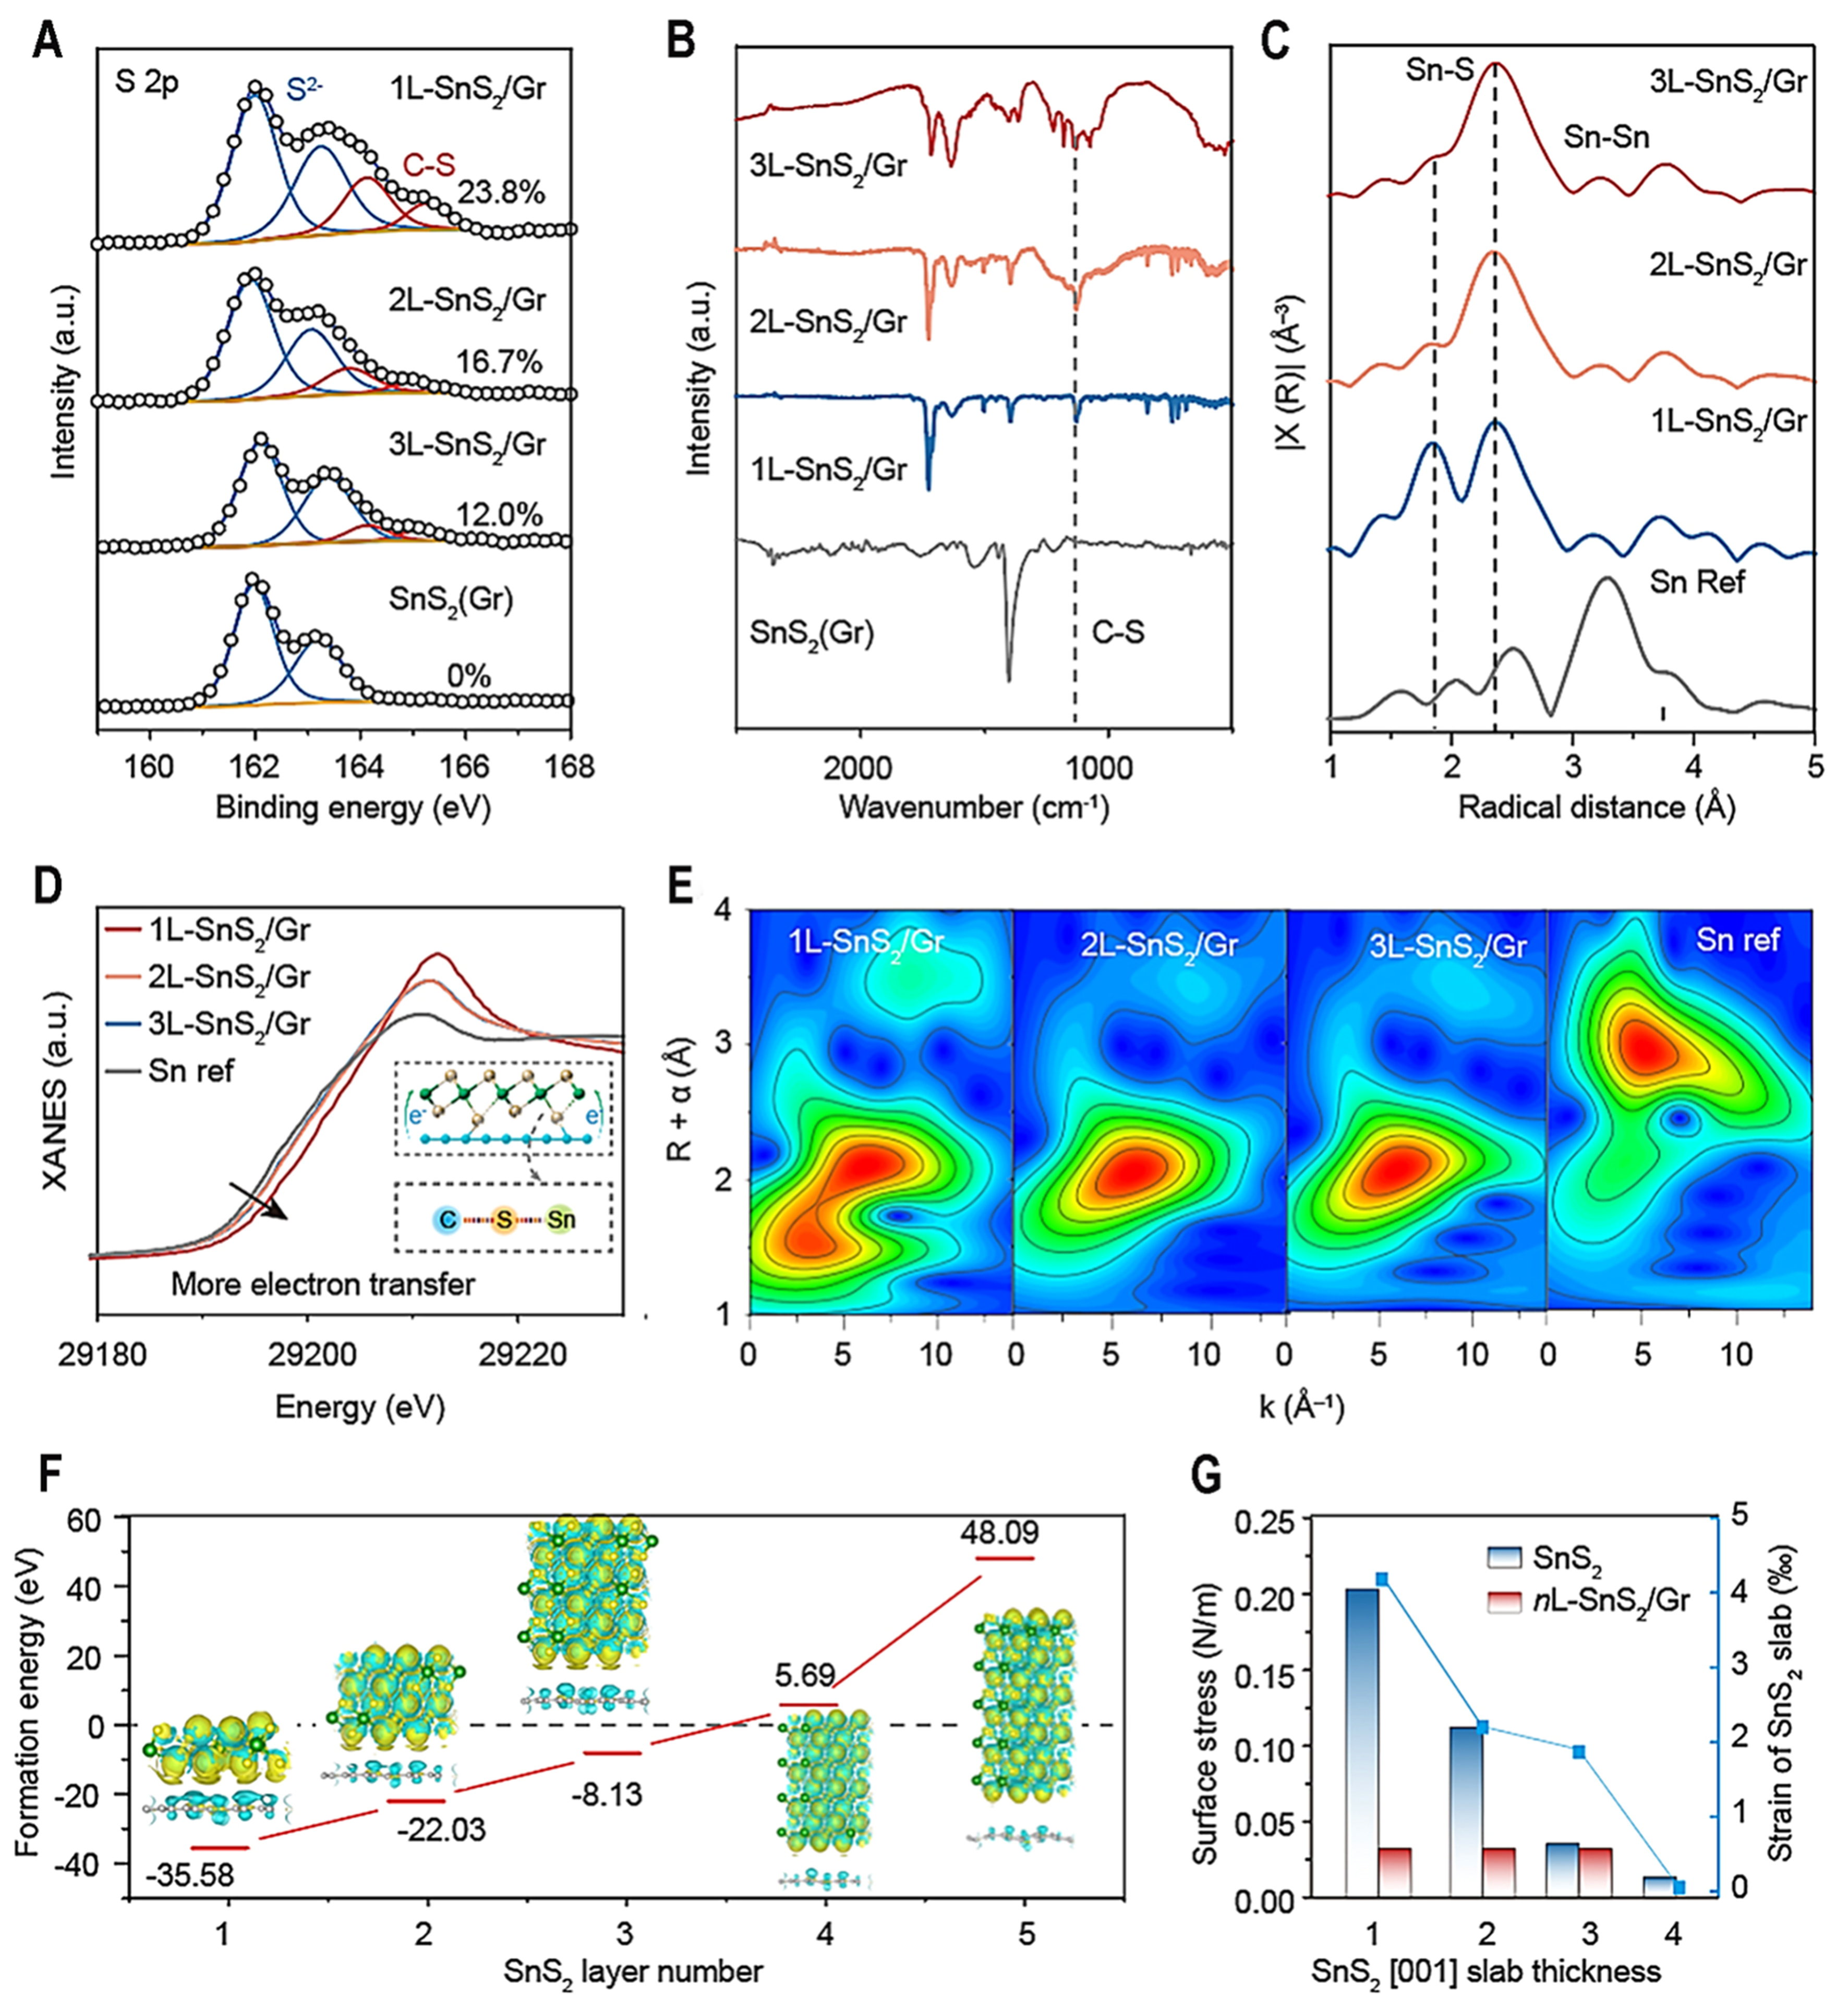
Figure 2. The characterization of chemical bond between SnS2 and graphene. (A) The S 2p high-resolution XPS and (B) FT-IR spectra of 1L-SnS2/Gr, 2L-SnS2/Gr, 3L-SnS2/Gr and SnS2 (Gr); (C) The EXAFS; (D) XANES curves; (E) Wavelet transform images of 1L-SnS2/Gr, 2L-SnS2/Gr, 3L-SnS2/Gr and Sn metal; (F) Calculated formation energies of 1L-SnS2/Gr, 2L-SnS2/Gr, 3L-SnS2/Gr, 4L-SnS2/Gr, 5L-SnS2/Gr. Inset: Differential charge densities of relative models. Yellow and cyan isosurfaces show electron gain and loss (0.003 Bohr-3), respectively; (G) Surface stress and strain of SnS2 and nL-SnS2/Gr with different layers. XPS: X-ray photoelectron spectroscopy; FT-IR: fourier transform infrared; EXAFS: extended X-ray absorption fine structure; XANES: X-ray absorption near edge structure.


