

fig6
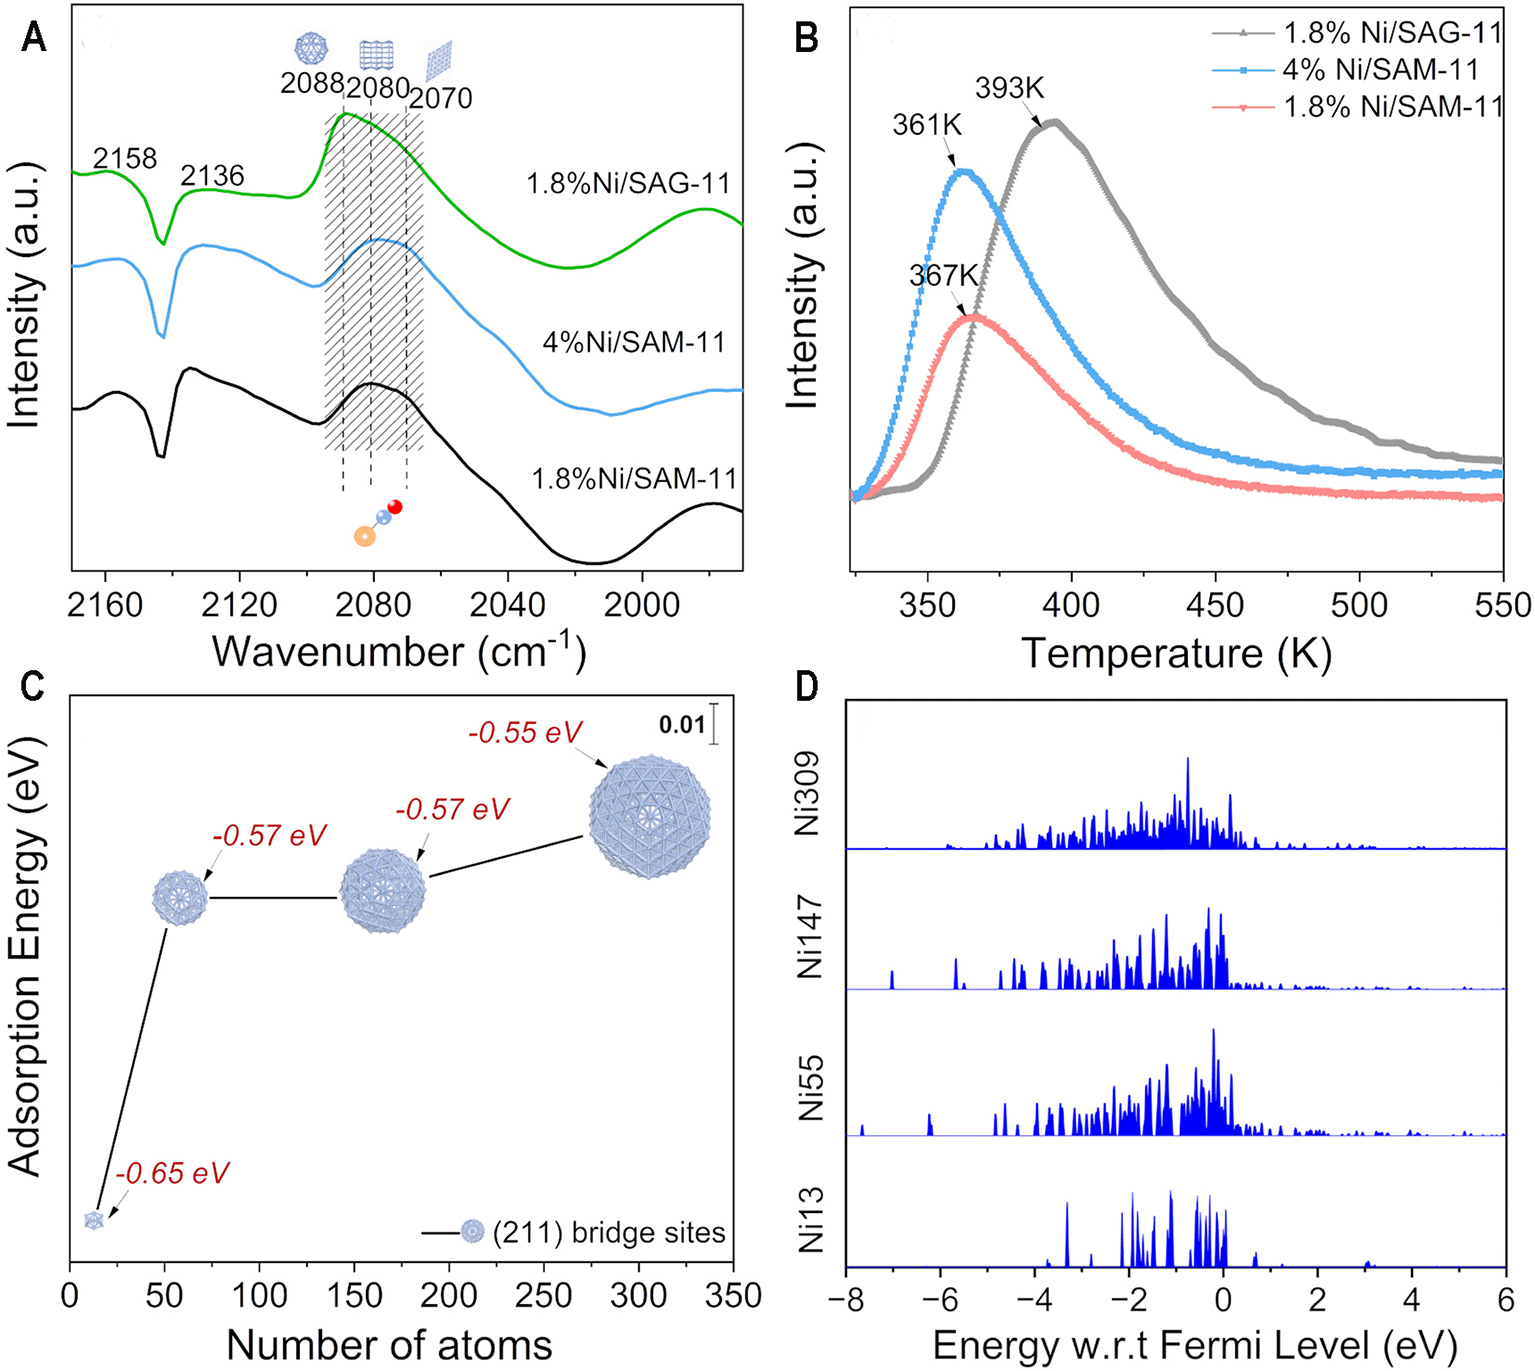
Figure 6. (A) CO-adsorbed FTIR spectroscopy and (B) H2-TPD profiles of the catalysts; (C) Calculated adsorption energies of H on the (211) bridge sites of Ni13, Ni55, Ni147 and Ni309 models; (D) Projected d-band density of states for Ni13, Ni55, Ni147 and Ni309 models. FTIR: Fourier transform infrared; H2-TPR: temperature-programmed reduction of hydrogen.


