

fig4
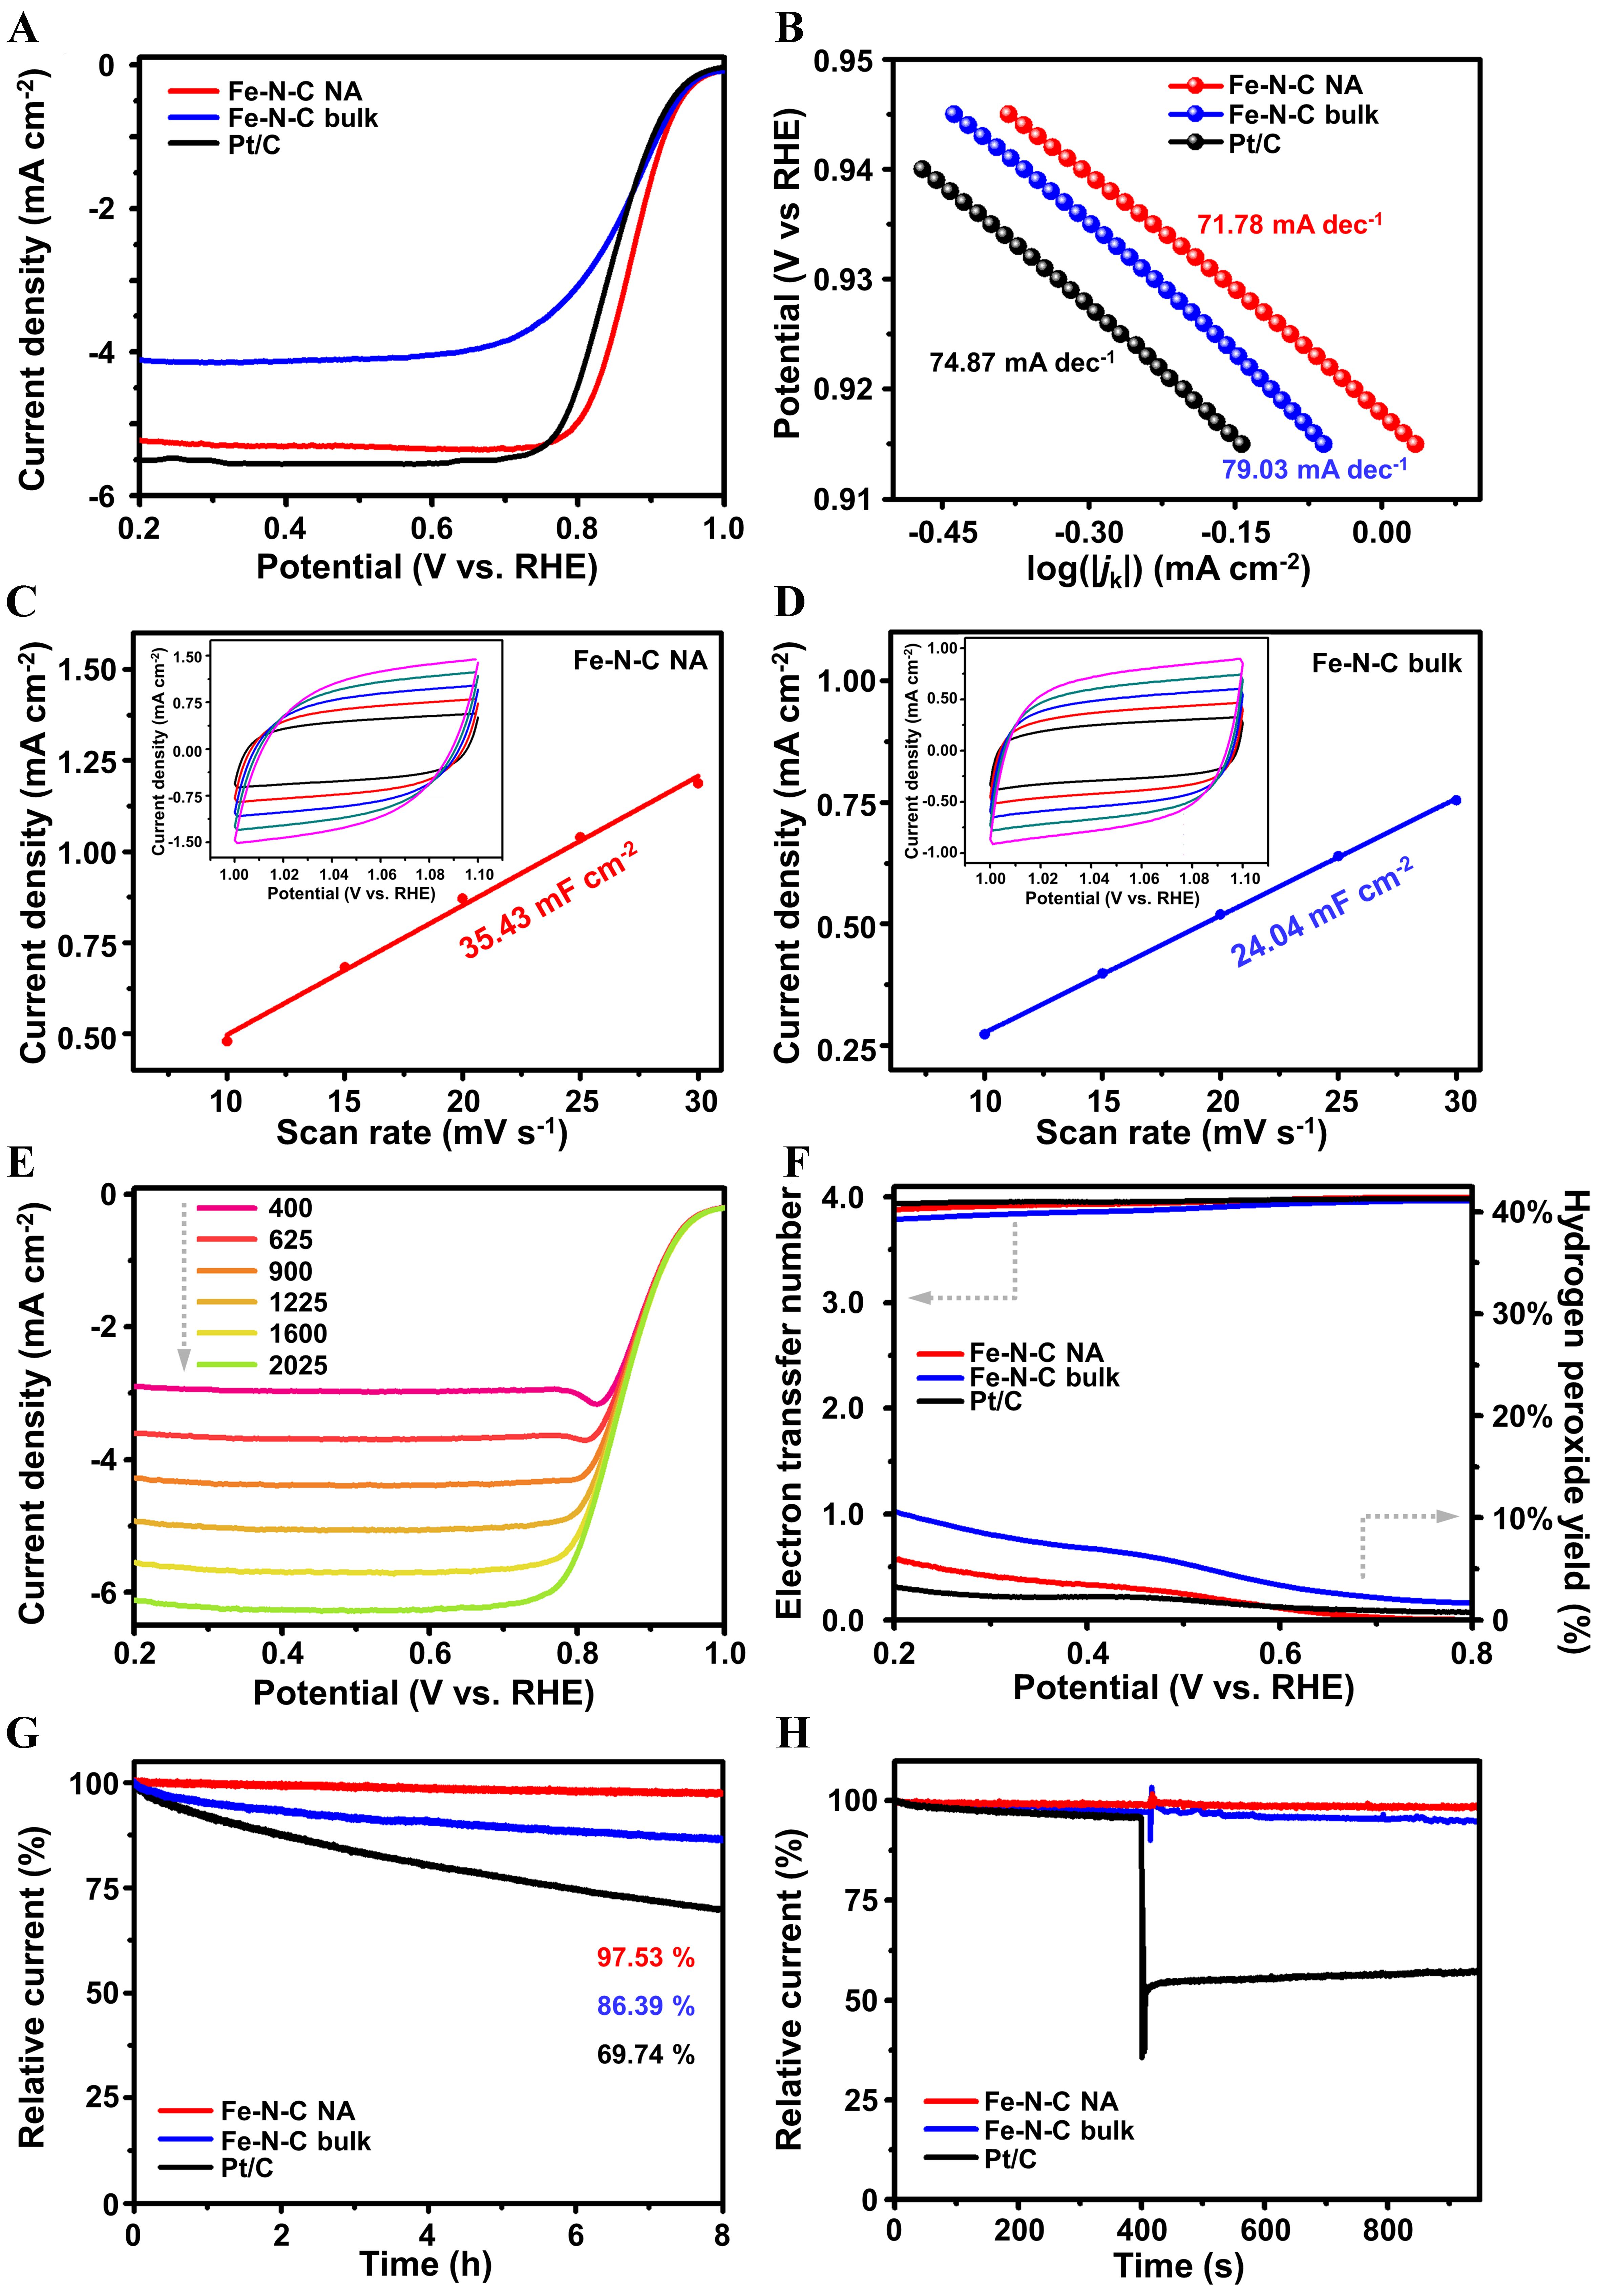
Figure 4. Electrochemical oxygen reduction performance. (A) LSV curves of Fe-N-C NA, Fe-N-C bulk and Pt/C at 1,600 rpm and O2 saturated electrolyte; (B) the corresponding Tafel plots of Fe-N-C NA, Fe-N-C bulk and Pt/C derived from Jk; (C and D) the relationship between current density and scanning rate of (C) Fe-N-C NA and (D) Fe-N-C bulk, respectively, derived from the CV curves at N2 saturated electrolytes of Fe-N-C NA (inset C) and Fe-N-C bulk (inset D) under 10 (black), 15 (red), 20 (blue), 25 (cyan), 30 (magenta) mV·s-1; (E) ORR polarization curves of Fe-N-C NA at different rotation speeds; (F) average electron transfer number and H2O2 yield curves of Fe-N-C NA, Fe-N-C bulk and Pt/C; (G) i - t plots under 0.75 V vs. RHE and 900 rpm of Fe-N-C NA, Fe-N-C bulk and Pt/C; and (H) i - t plots of Fe-N-C NA, Fe-N-C bulk, and Pt/C before and after methanol poisoning. LSV: Linear sweep voltammetry; NA: nano-assembly; CV: cyclic voltammetry; ORR: oxygen reduction reaction; RHE: reversible hydrogen electrode.


