

fig24
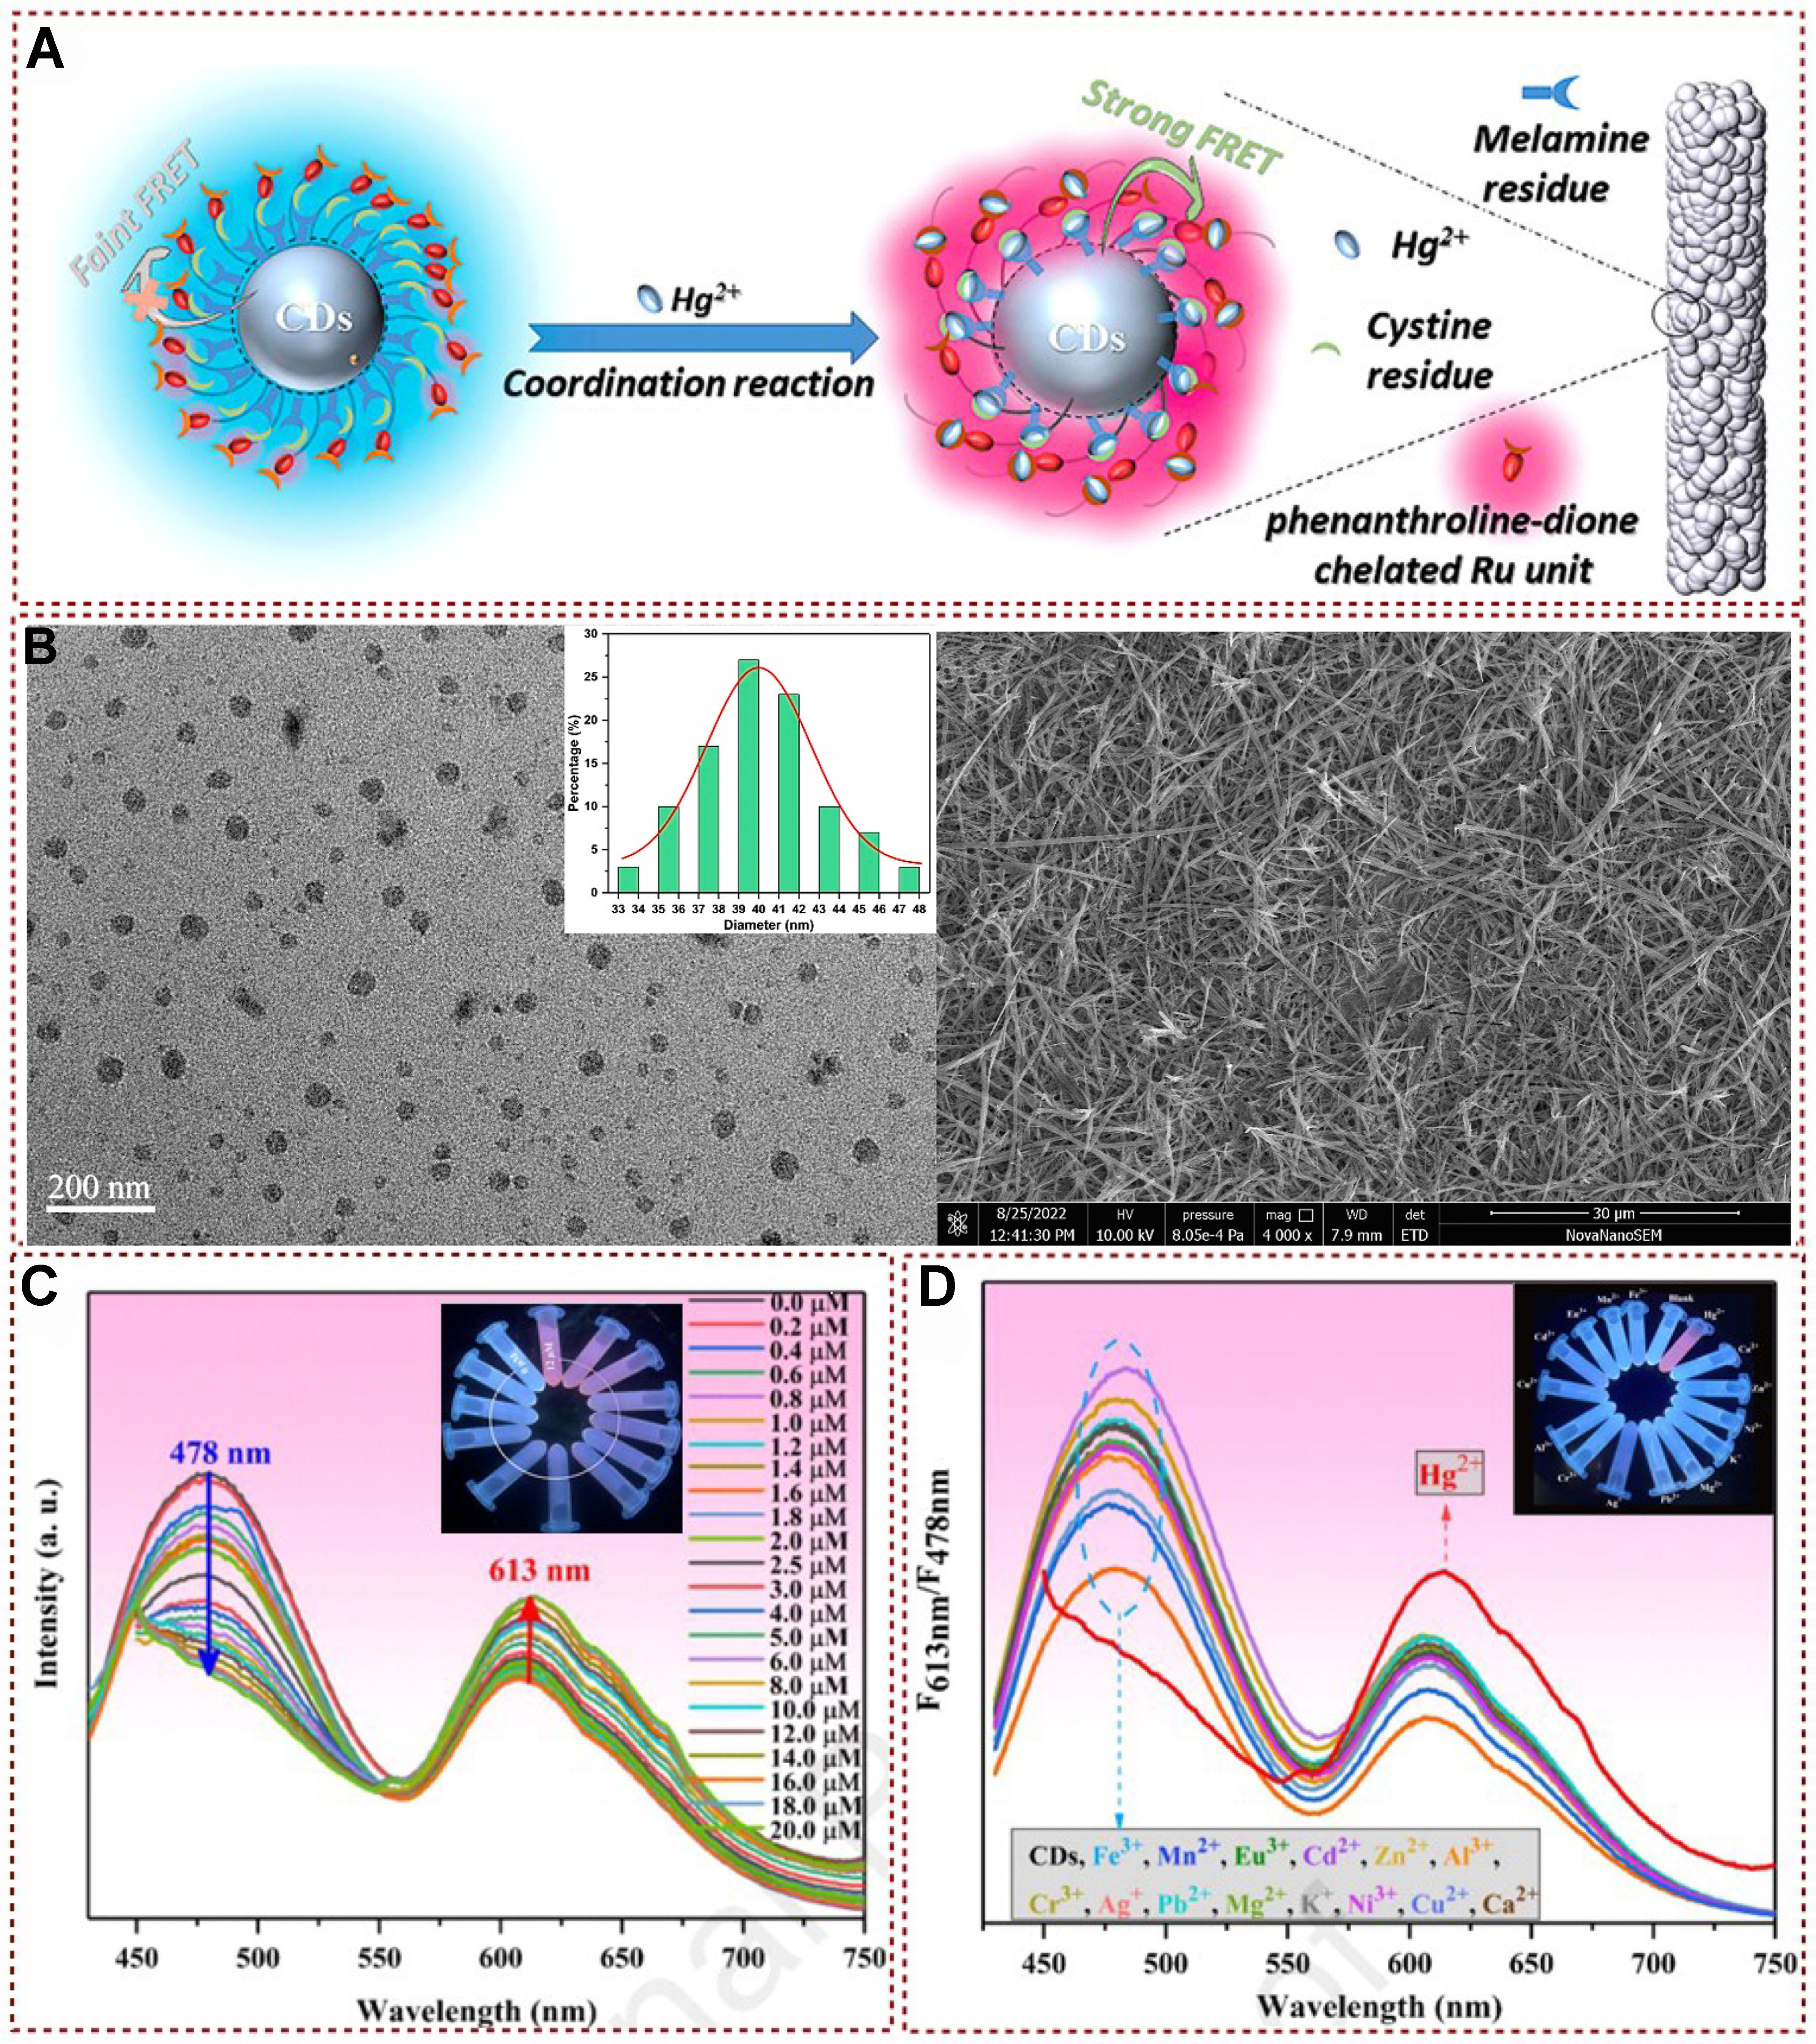
Figure 24. (A) Schematic illustration of Hg2+ detection based on N, S-CDs/Ru materials; (B) TEM image showing the detailed structure and size distribution of N, S-CDs/Ru nanocomposites. Additionally, an SEM image illustrates the morphology of N, S-CDs/Ru nanofibers after the introduction of Hg2+; (C) Fluorescence spectra of N, S-CDs/Ru in B-R buffer solution demonstrate changes in fluorescence intensity with varying amounts of Hg2+. The inset image provides a visual representation of how the fluorescence of N, S-CDs/Ru varies in the buffer at different concentrations of Hg2+; (D) Fluorescence spectra of N, S-CDs/Ru in the presence of different metal ions reveal its selectivity. The inset image offers a visual comparison of the fluorescence response of N, S-CDs/Ru to various metal ions[144]. Copyright 2024, Elsevier B.V. TEM: Transmission electron microscopy; SEM: scanning electron microscope.


