

fig19
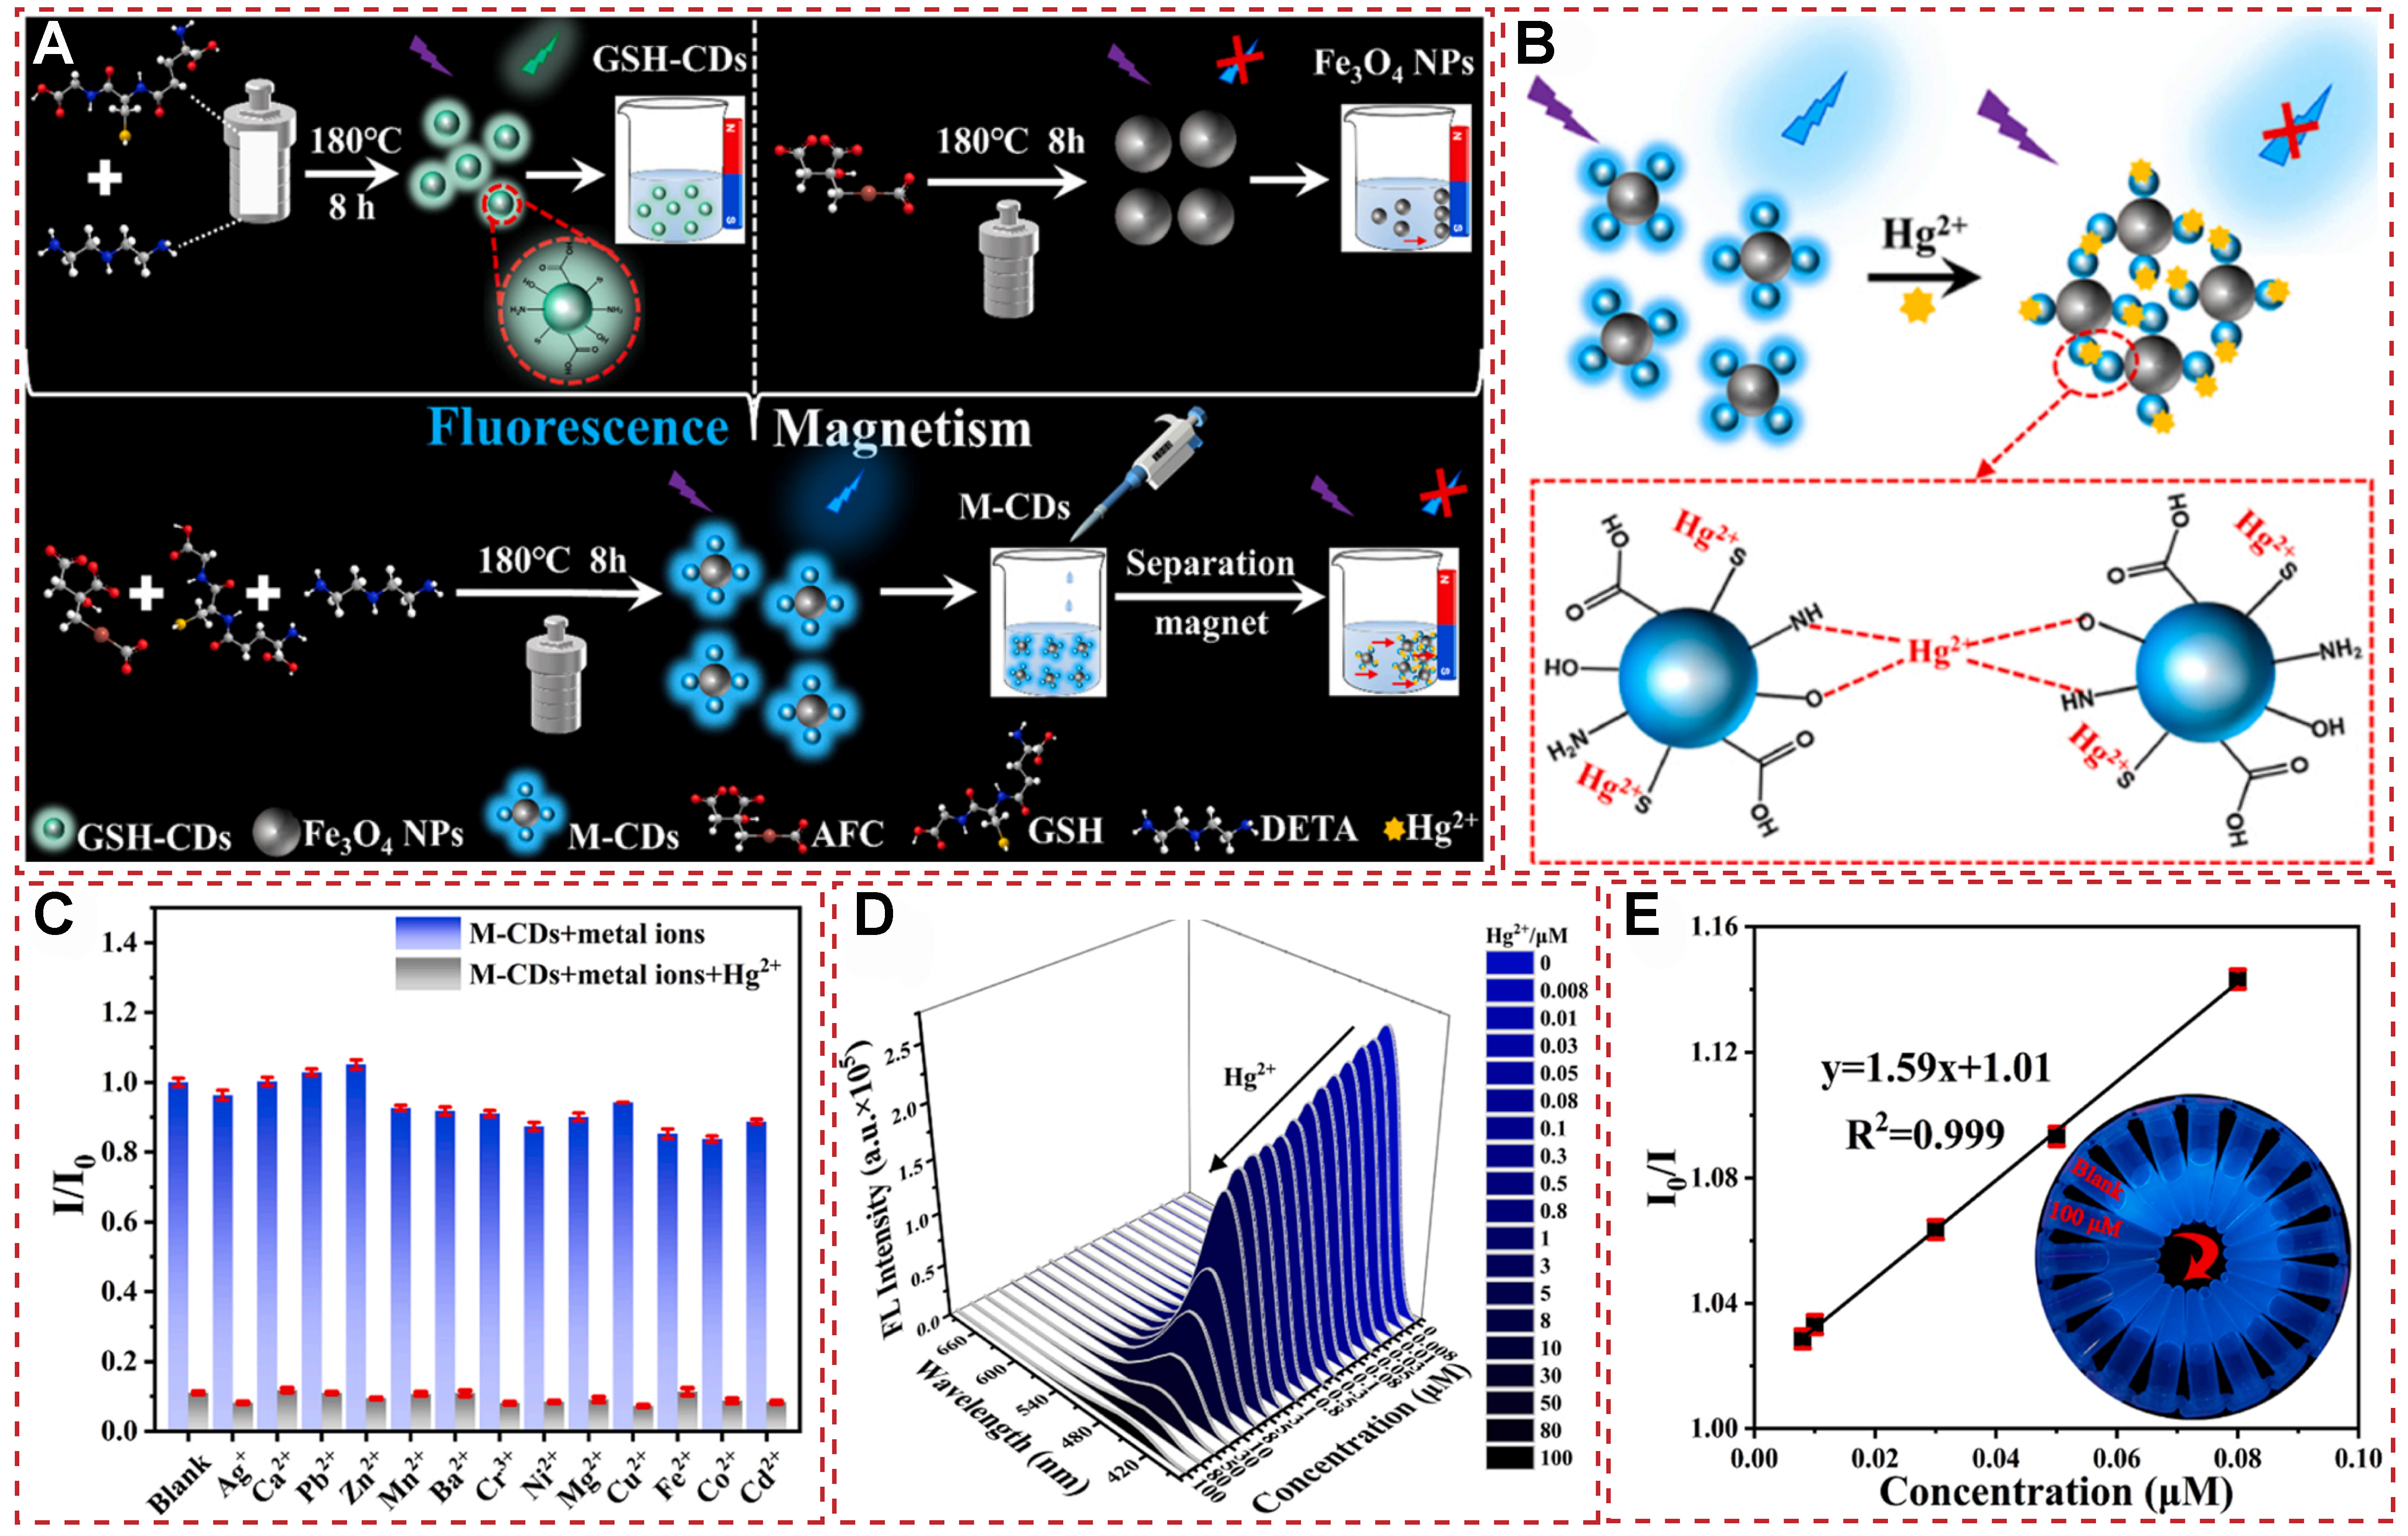
Figure 19. (A) The synthesis of GSH-CDs, Fe3O4 NPs and M-CDs; (B)Schematic mechanism for the binding of M-CDs to Hg2+; (C) The fluorescent intensity ratio I/I0 of M-CDs with various metal ions (100 μM) vs. Hg2+ (100 μM); (D) FL spectra of M-CDs exposed to different concentrations of Hg2+ (0-100 μM); (E) The linear fitting of I0/I vs. the Hg2+ concentration (0.008-0.08 μM, R2 = 0.999). Inset in (D): corresponding sample image under UV light[110]. Copyright 2023, Elsevier B.V. FL: fluorescence emission; UV: ultraviolet.


