

fig4
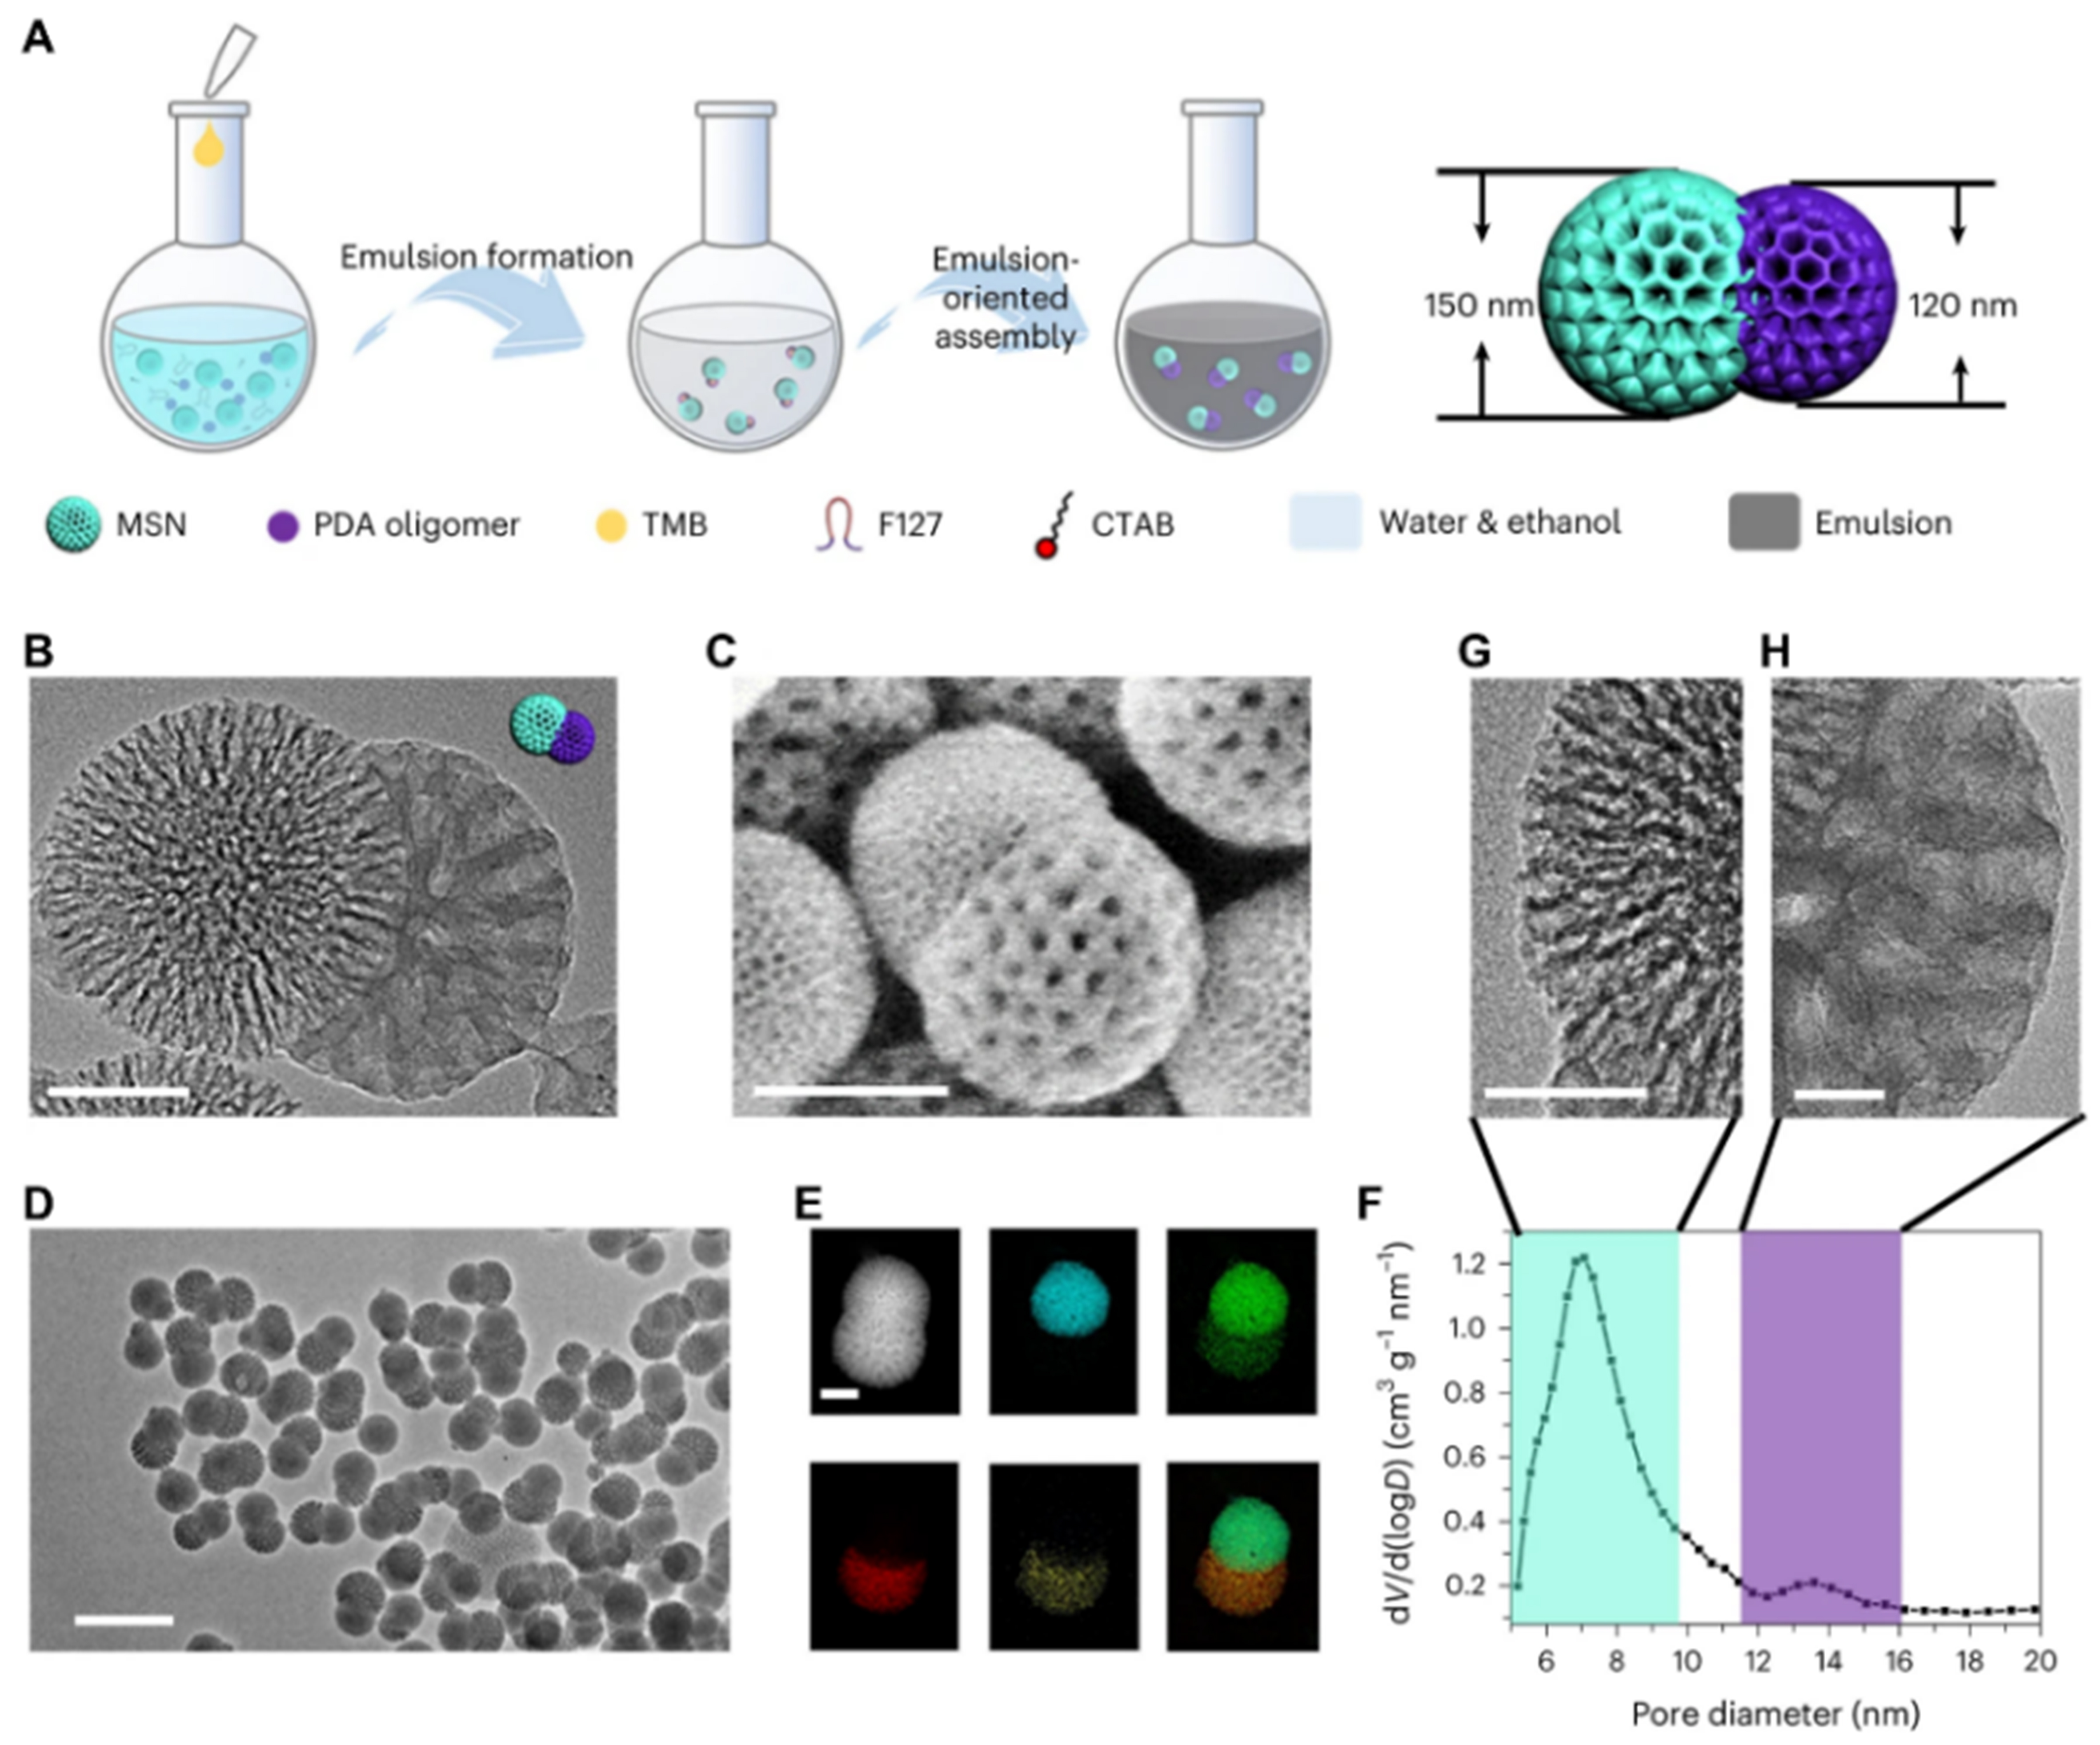
Figure 4. (A) Synthesis diagram; (B and D) TEM images with different magnifications; (C) SEM images; (E) dark-field TEM images and corresponding element maps; and (F) pore size distribution diagram of Janus MSN & mPDA nanoparticles; High-resolution TEM images of (G) MSN, and (H) mPDA. Scale bar: (B) 50 nm, (C) 100 nm, (D) 200 nm, (E, G, H) 20 nm. This figure is quoted with permission from Zhao et al.[95]. MSN: Mesoporous silica nanoparticle; PDA: polydopamine; TMB: 1,3,5-trimethylbenzene; CTAB: cetyltrimethylammonium bromide; TEM: transmission electron microscopy; SEM: scanning electron microscopy; mPDA: mesoporous polydopamine.


