

fig2
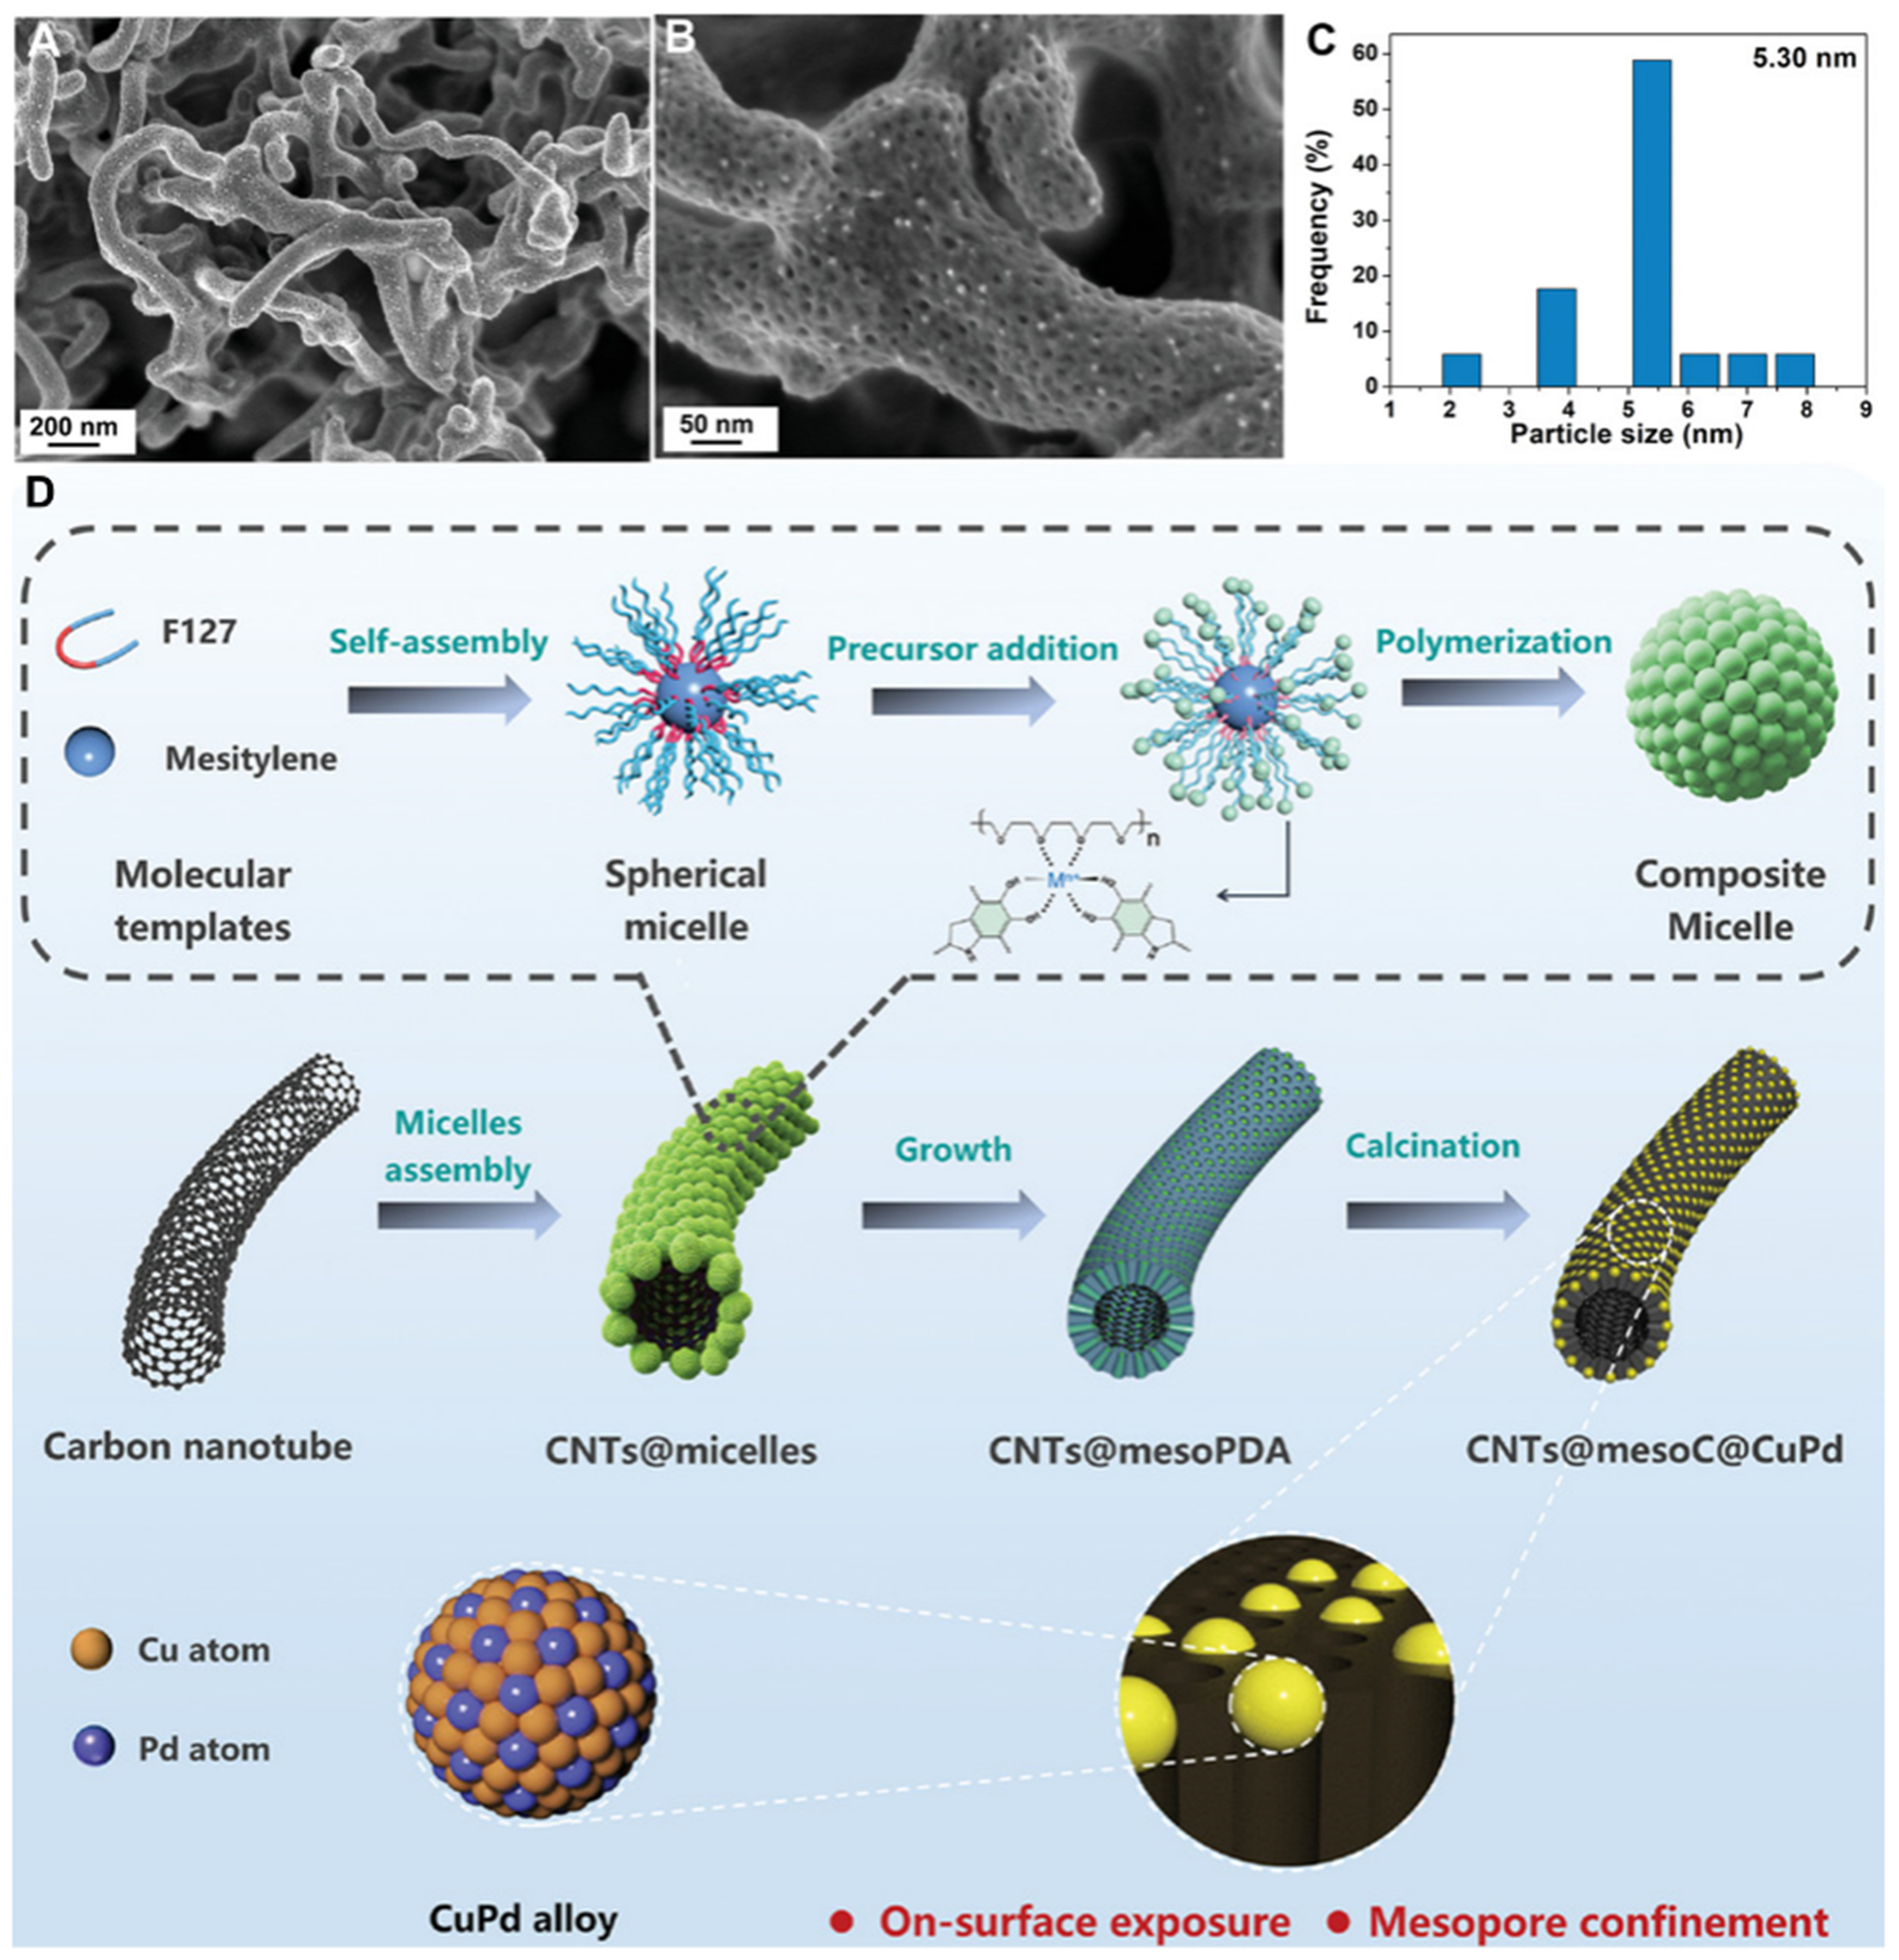
Figure 2. (A and B) SEM images of CNTs@mesoC@CuPd nanostructures at different magnifications; (C) Histogram of statistical distribution of CuPd nanoparticle size; (D) Synthesis scheme of CNTs@mesoC@CuPd. This figure is quoted with permission from Xu et al.[68]. CNTs: Carbon nanotubes; mesoPDA: mesoporous polydopamine; mesoC: mesoporous carbon; SEM: scanning electron microscopy.


