

fig9
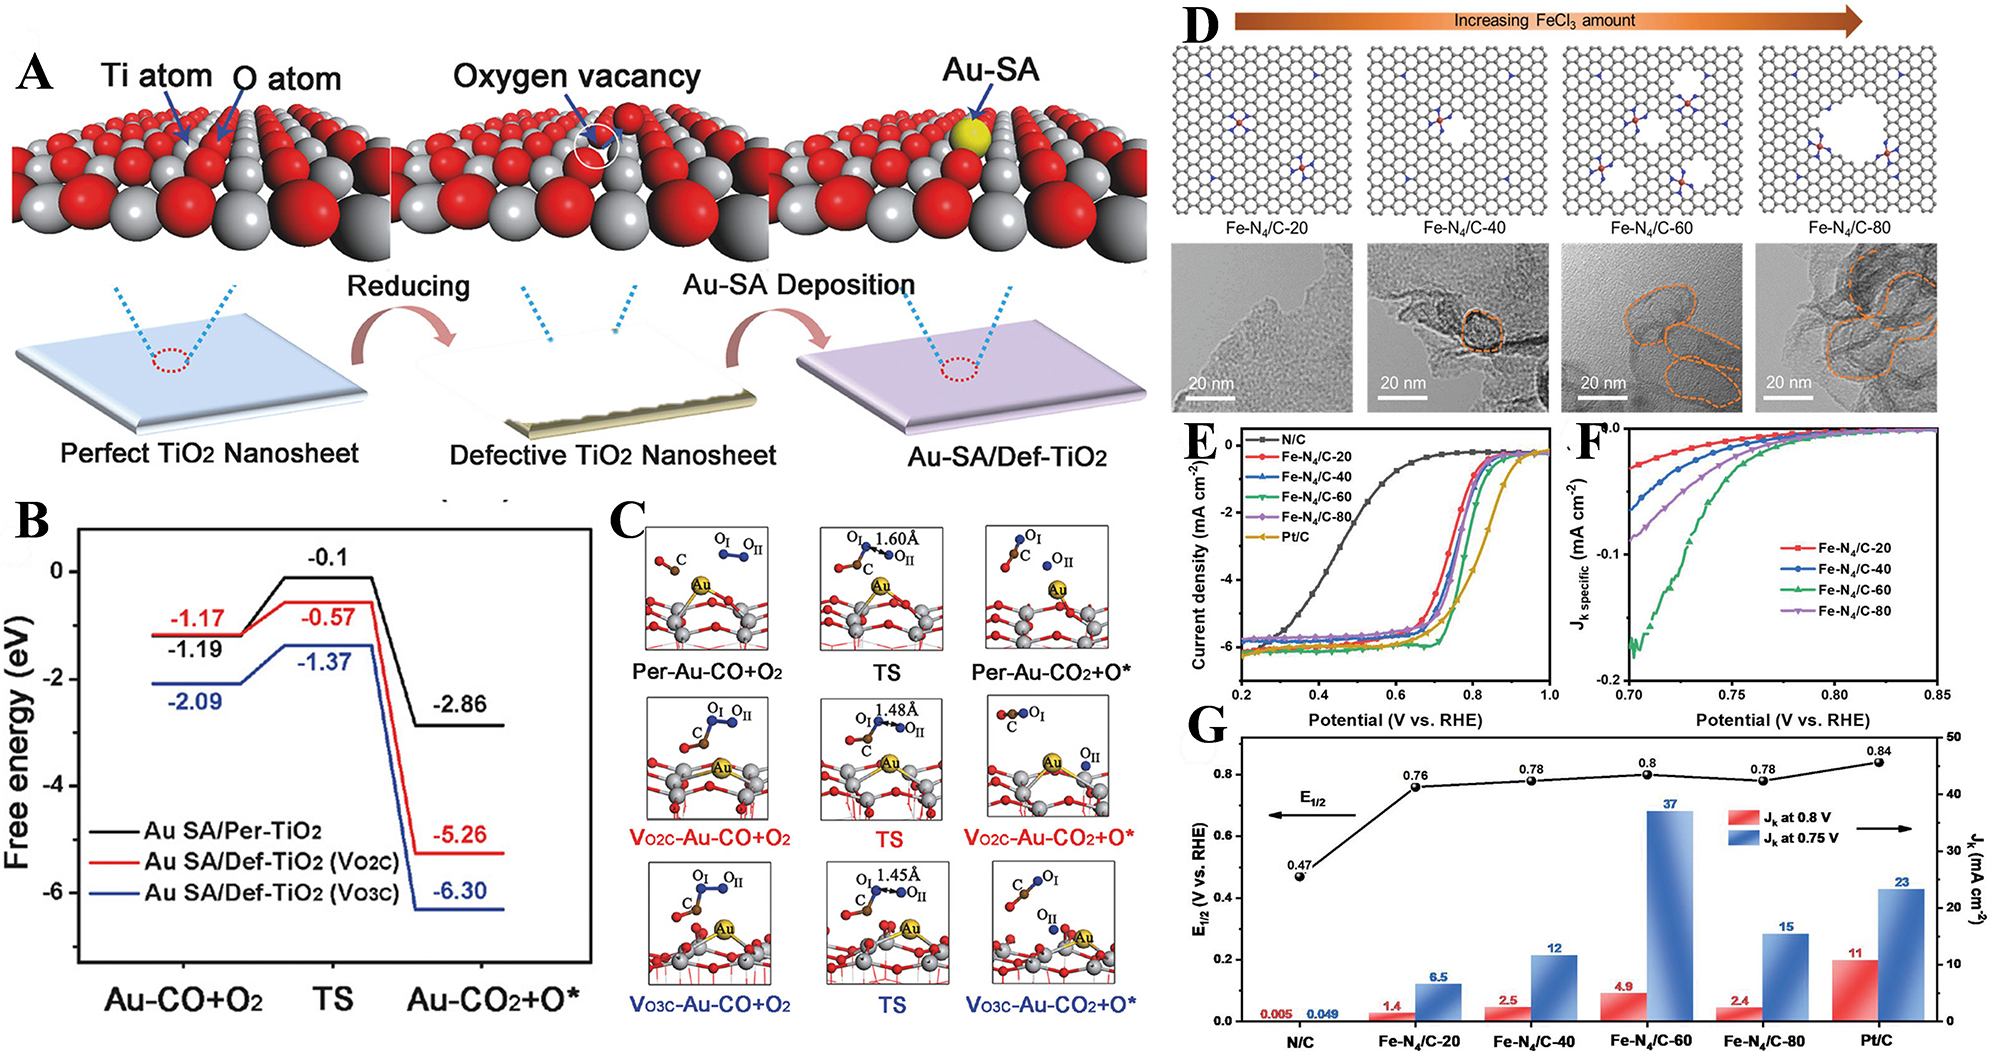
Figure 9. (A) Schematic illustration of the formation; (B) Free energy paths for Au-SA/Per-TiO2 and Au-SA/Def-TiO2; (C) Schematic models for the CO oxidation process. Adapted with permission[60]. Copyright 2018, Wiley-VCH Verlag GmbH & Co. KGaA, Weinheim; (D) The schematic illustration and TEM images of morphological evolution for Fe-N4-Cx samples when varying the amount of reactant FeCl3; (E) LSV curves for different catalysts in 0.1 M HClO4 electrolyte; (F) Potential dependence of Jk-specific for as-prepared various atomic Fe catalysts; (G) Comparison of E1/2 and Jk for different testing catalysts. Adapted with permission[63]. Copyright 2020, Wiley-VCH Verlag GmbH & Co. KGaA, Weinheim. TEM: Transmission electron microscopy; LSV: linear sweep voltammetry.


