fig3

Oxygen vacancy modulation in two-dimensional metal oxides for biomedical applications

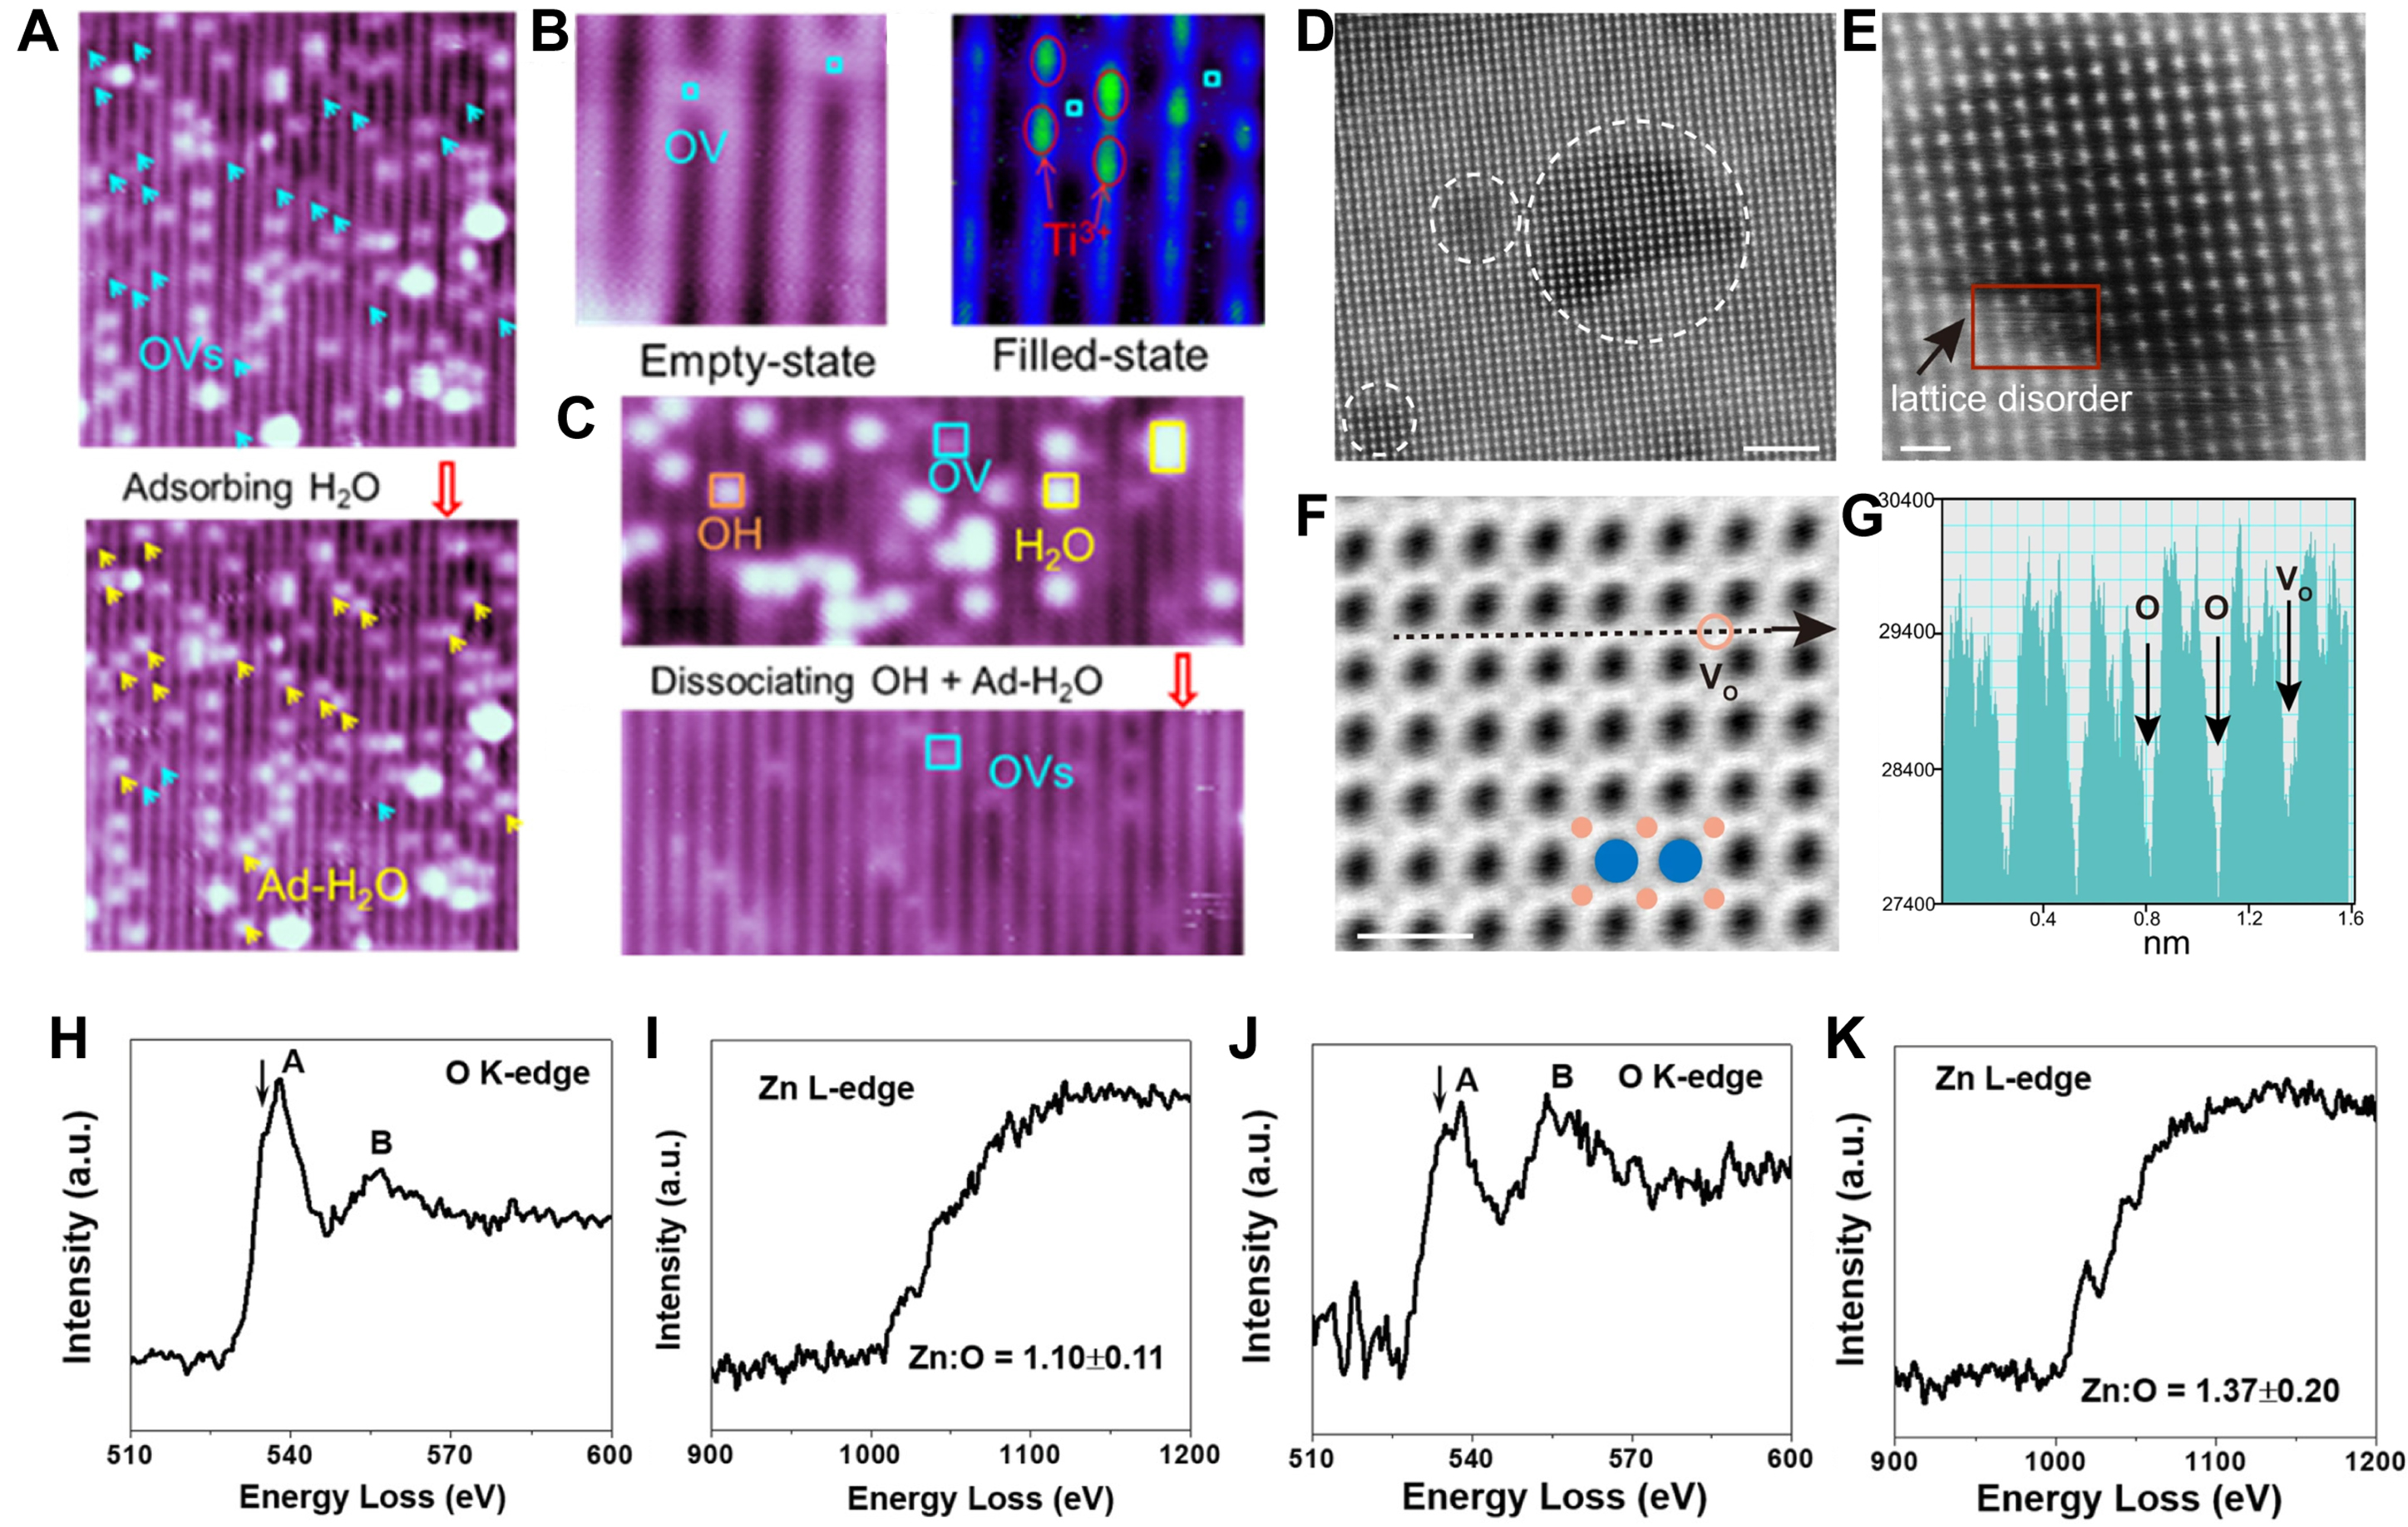
Figure 3. (A) STM image of TiO2 (110) surface (partially reduced) pre-/post-water adsorption, highlighting OVs (light blue arrows) (15 nm × 15 nm, 1.2 V, 20 pA); (B) STM images of TiO2 surface showing two OVs in empty (1.2 V, 20 pA) and filled (-2.3 V, 10 pA) states; (C) STM images of TiO2 surface before and after water dissociation. (Reproduced with permission[85]. Copyright 2018, American Chemical Society); (D and E) HAADF-STEM images of BOC-2 highlighting lattice disorders (circled). Scale bars: 2 nm (D), 0.5 nm (E); (F) ABF-STEM image with pink/blue circles marking oxygen/bismuth atoms (scale bar: 0.5 nm); (G) Intensity profile along the dashed line in (F) (arrow-indicated)[86]; (H-K) Cross-sectional EELS analysis: O K-edge (H/J) and Zn L-edge (I/K) of ZnO nanosheets vs. Al2O3-coated counterparts (Reproduced with permission[87]. Copyright 2020, Wiley). STM: Scanning tunneling microscopy; OVs: oxygen vacancies; HAADF-STEM: high-angle annular dark-field scanning transmission electron microscopy; BOC: tert-butoxycarbonyl; ABF: annular bright field; STEM: scanning transmission electron microscopy; EELS: electron energy loss spectroscopy.

Chemical Synthesis
ISSN 2769-5247 (Online)

Portico

All published articles are preserved here permanently:

https://www.portico.org/publishers/oae/

Portico

All published articles are preserved here permanently:

https://www.portico.org/publishers/oae/