

fig13
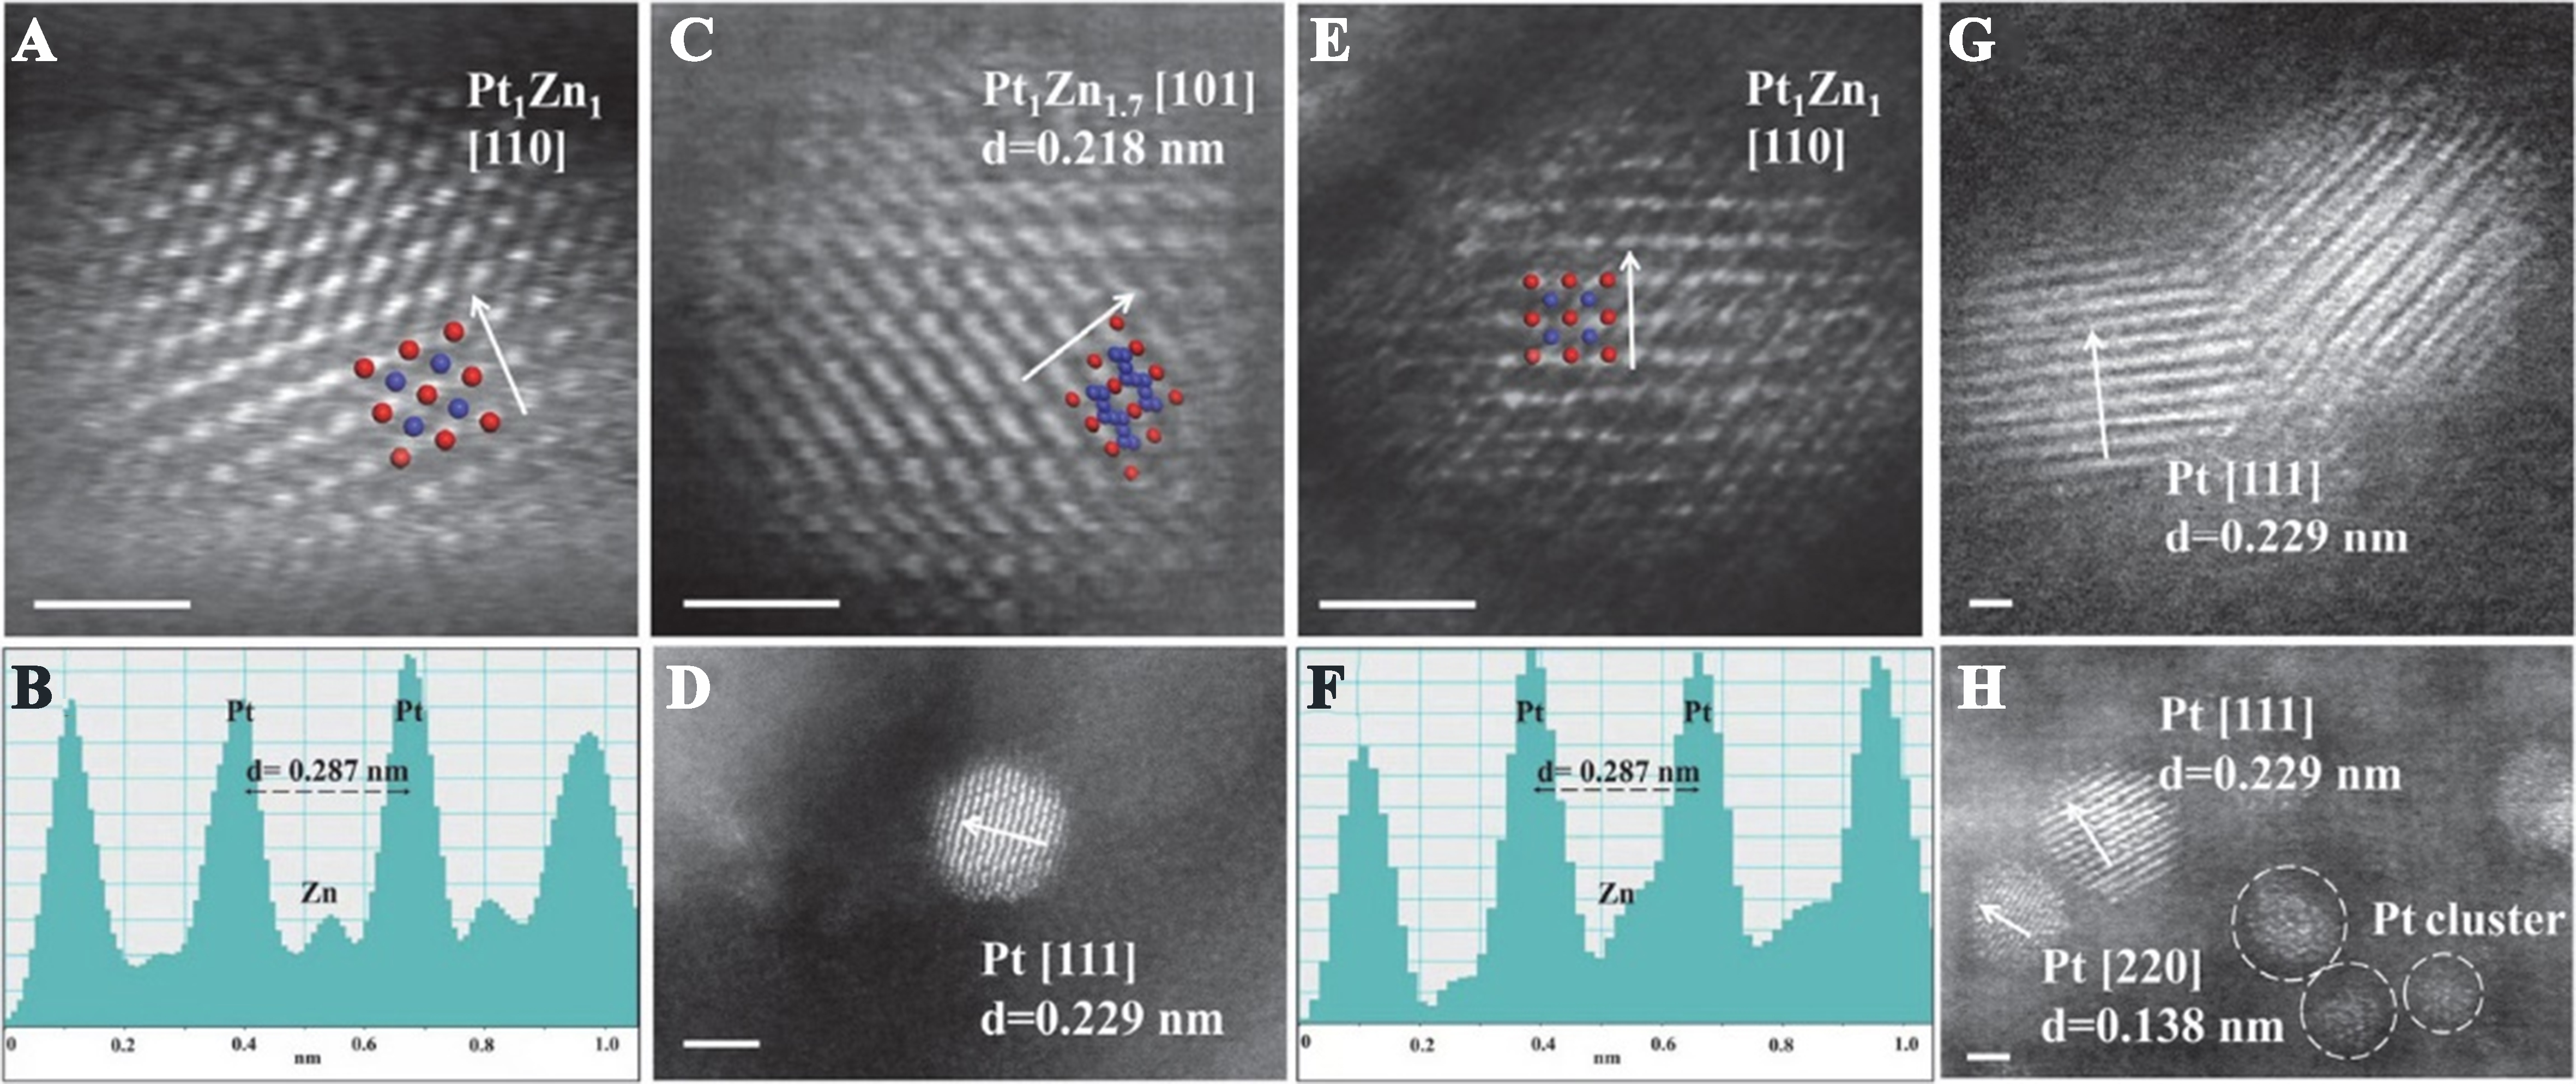
Figure 13. (A-D) Cs-corrected HAADF-STEM image and corresponding line intensity profile of PtZn@Beta; (E-H) HAADF-STEM image and corresponding line intensity profile of PtZn/Beta. The red represents Pt and blue represents Zn. Reprinted with permission[136]. Copyright 2023, Elsevier. HAADF-STEM: High-angle annular dark-field scanning transmission electron microscopy.


