

fig1
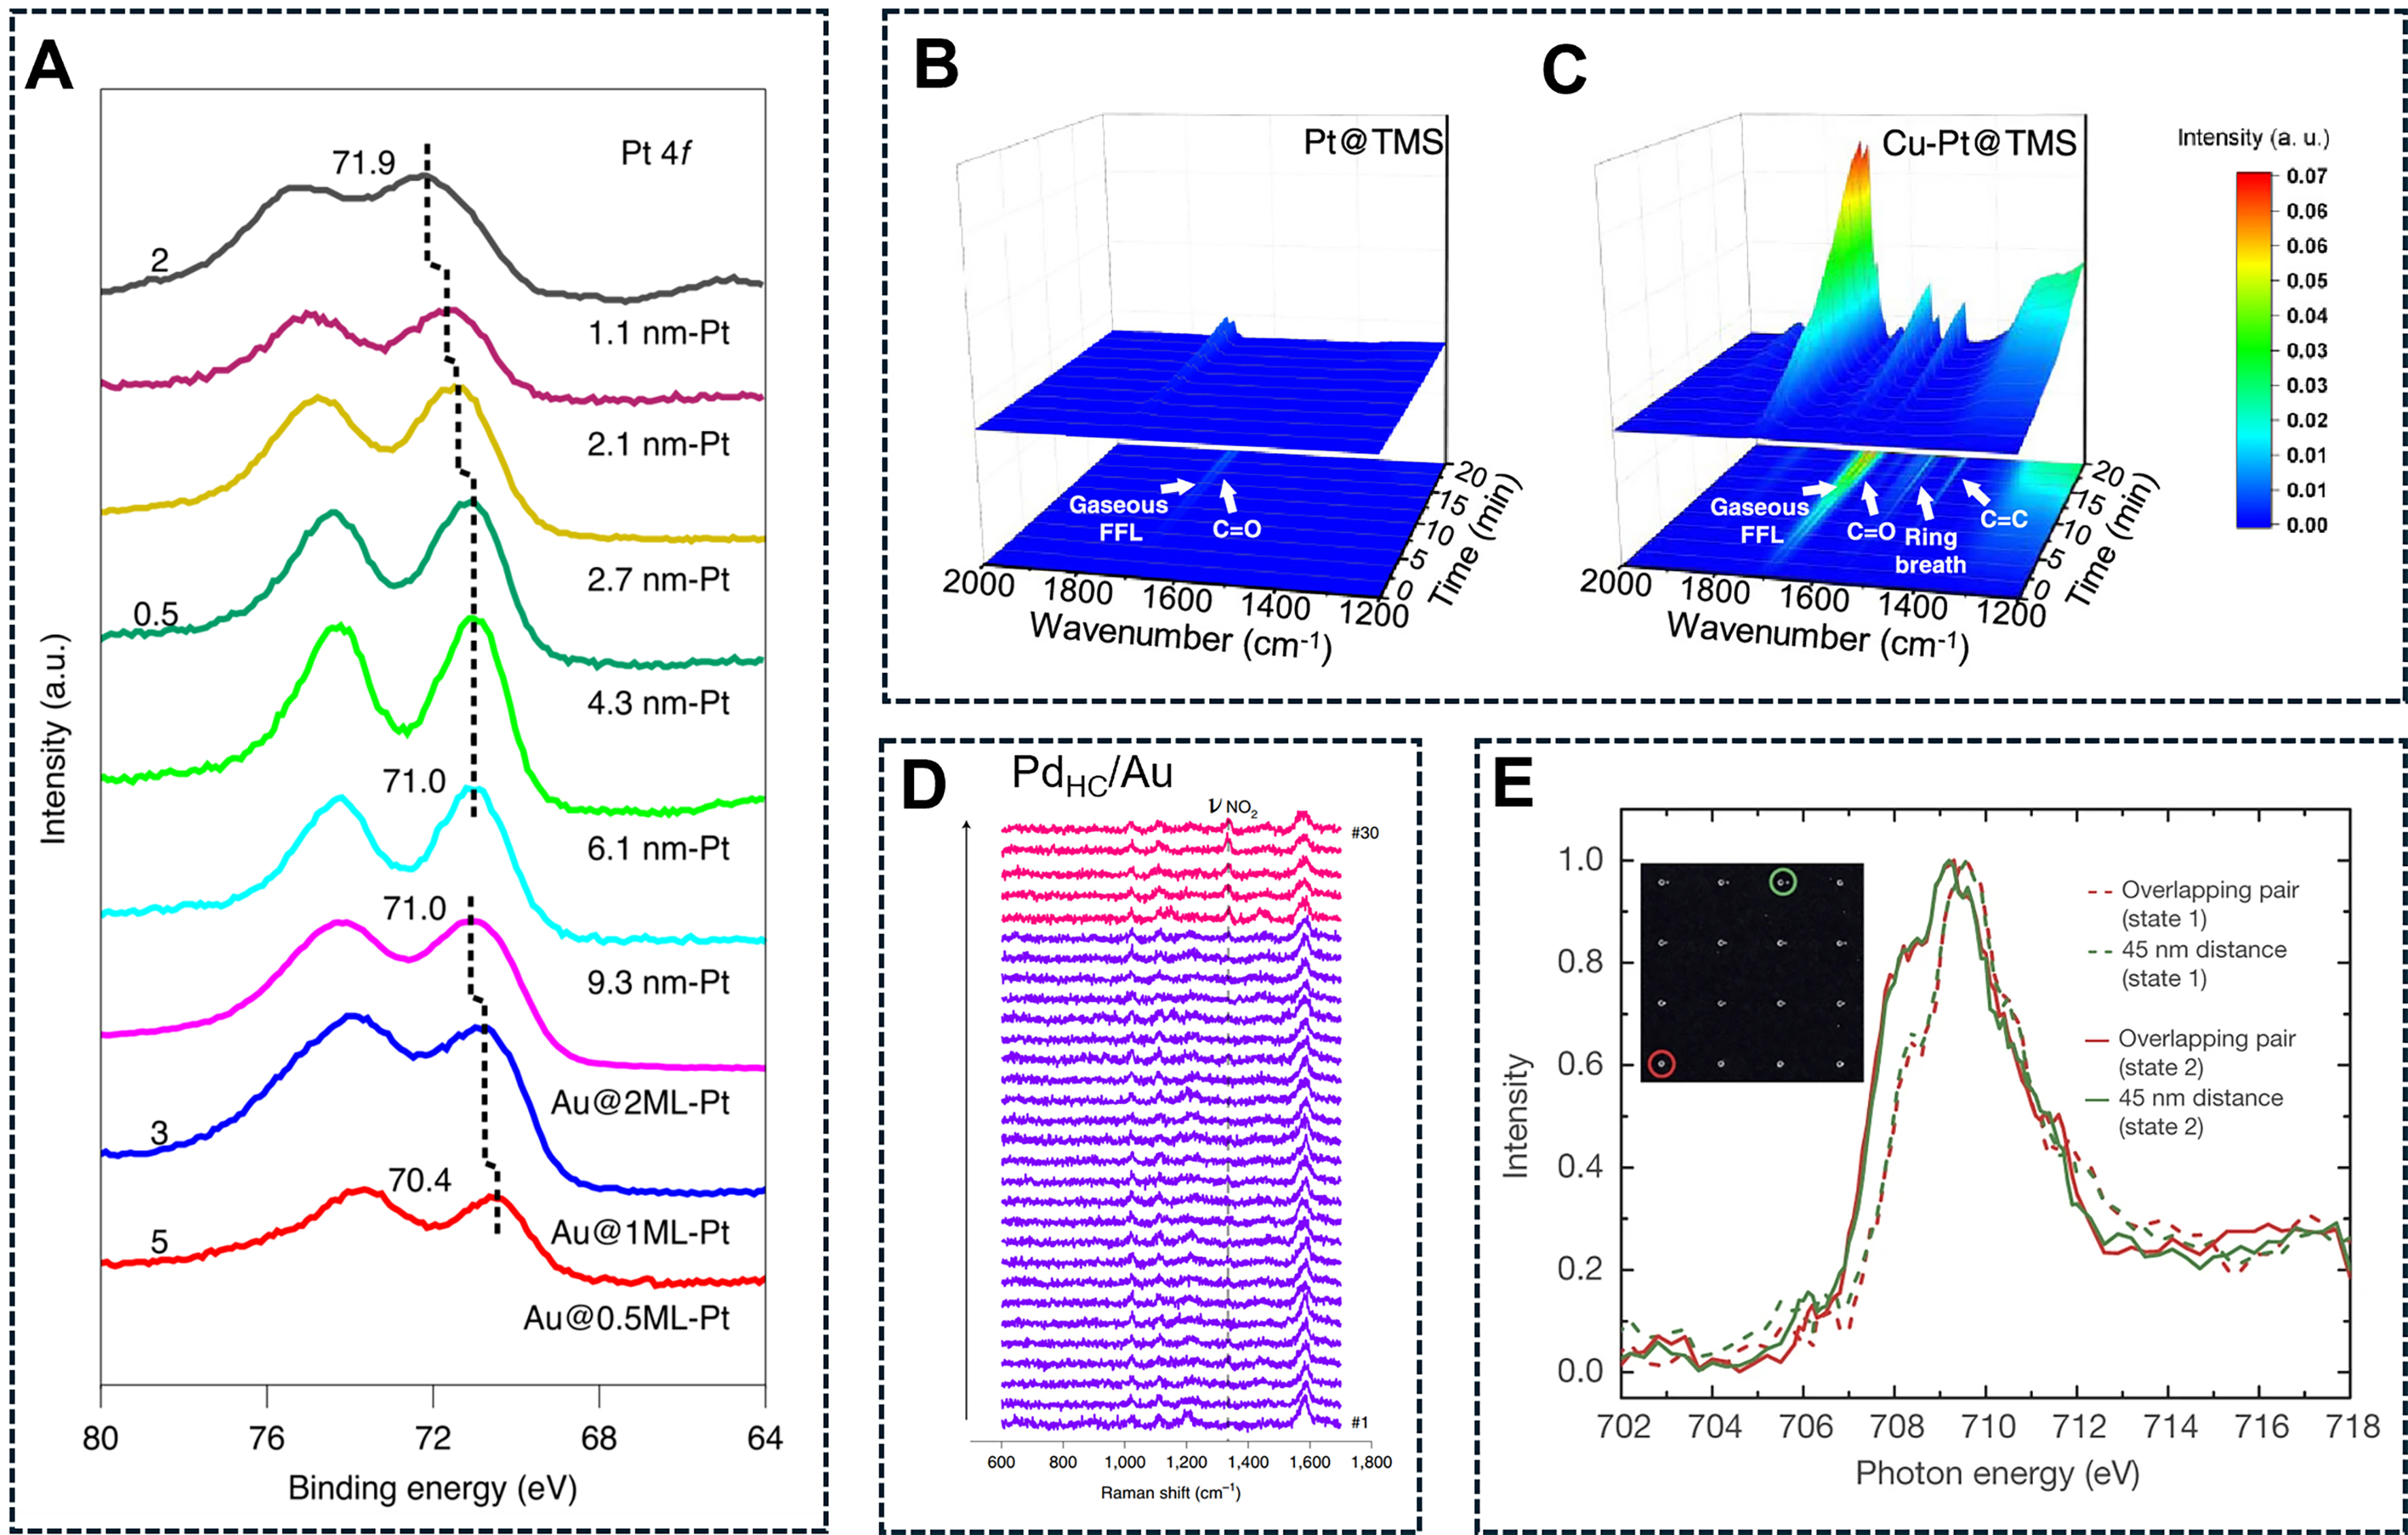
Figure 1. (A) In situ XPS analysis of Pt 4f core level spectra for the Pt and Au@Pt catalysts during reduction process. Reproduced with permission from Ref.[91]. Copyright 2021, Springer Nature; In situ FT-IR spectra of FFL adsorption on (B) Pt@TMS and (C) Cu-Pt@TMS. Reproduced with permission from Ref.[92]. Copyright 2023, American Chemical Society; (D) TER spectra extracted from the TERS maps of CNBT SAMs on PdHC/Au, acquired along the regions in the STM images with a spectrum recorded every 10 nm. Reproduced with permission from Ref.[58]. Copyright 2021, Springer Nature; (E) Fe L3 XAS spectra for the platinum and iron oxide on TiO2 with an interparticle distance of 45 nm and the overlapping pair. Reproduced with permission from Ref.[38]. Copyright 2017, Springer Nature. XPS: X-ray photoelectron spectroscopy; FT-IR: Fourier transform infrared spectroscopy; FFL: fluoroformyl ligand; TMS: titanosilicate molecular sieve; TERS: tip-enhanced Raman spectroscopy; TER: tip-enhanced Raman; SAM: self-assembled monolayer; STM: scanning tunneling microscopy; XAS: X-ray absorption spectroscopy; CNBT: 4-chloro-3-nitrobenzenethiol; PdHC: hydrogen-covered palladium cluster.


