

fig7
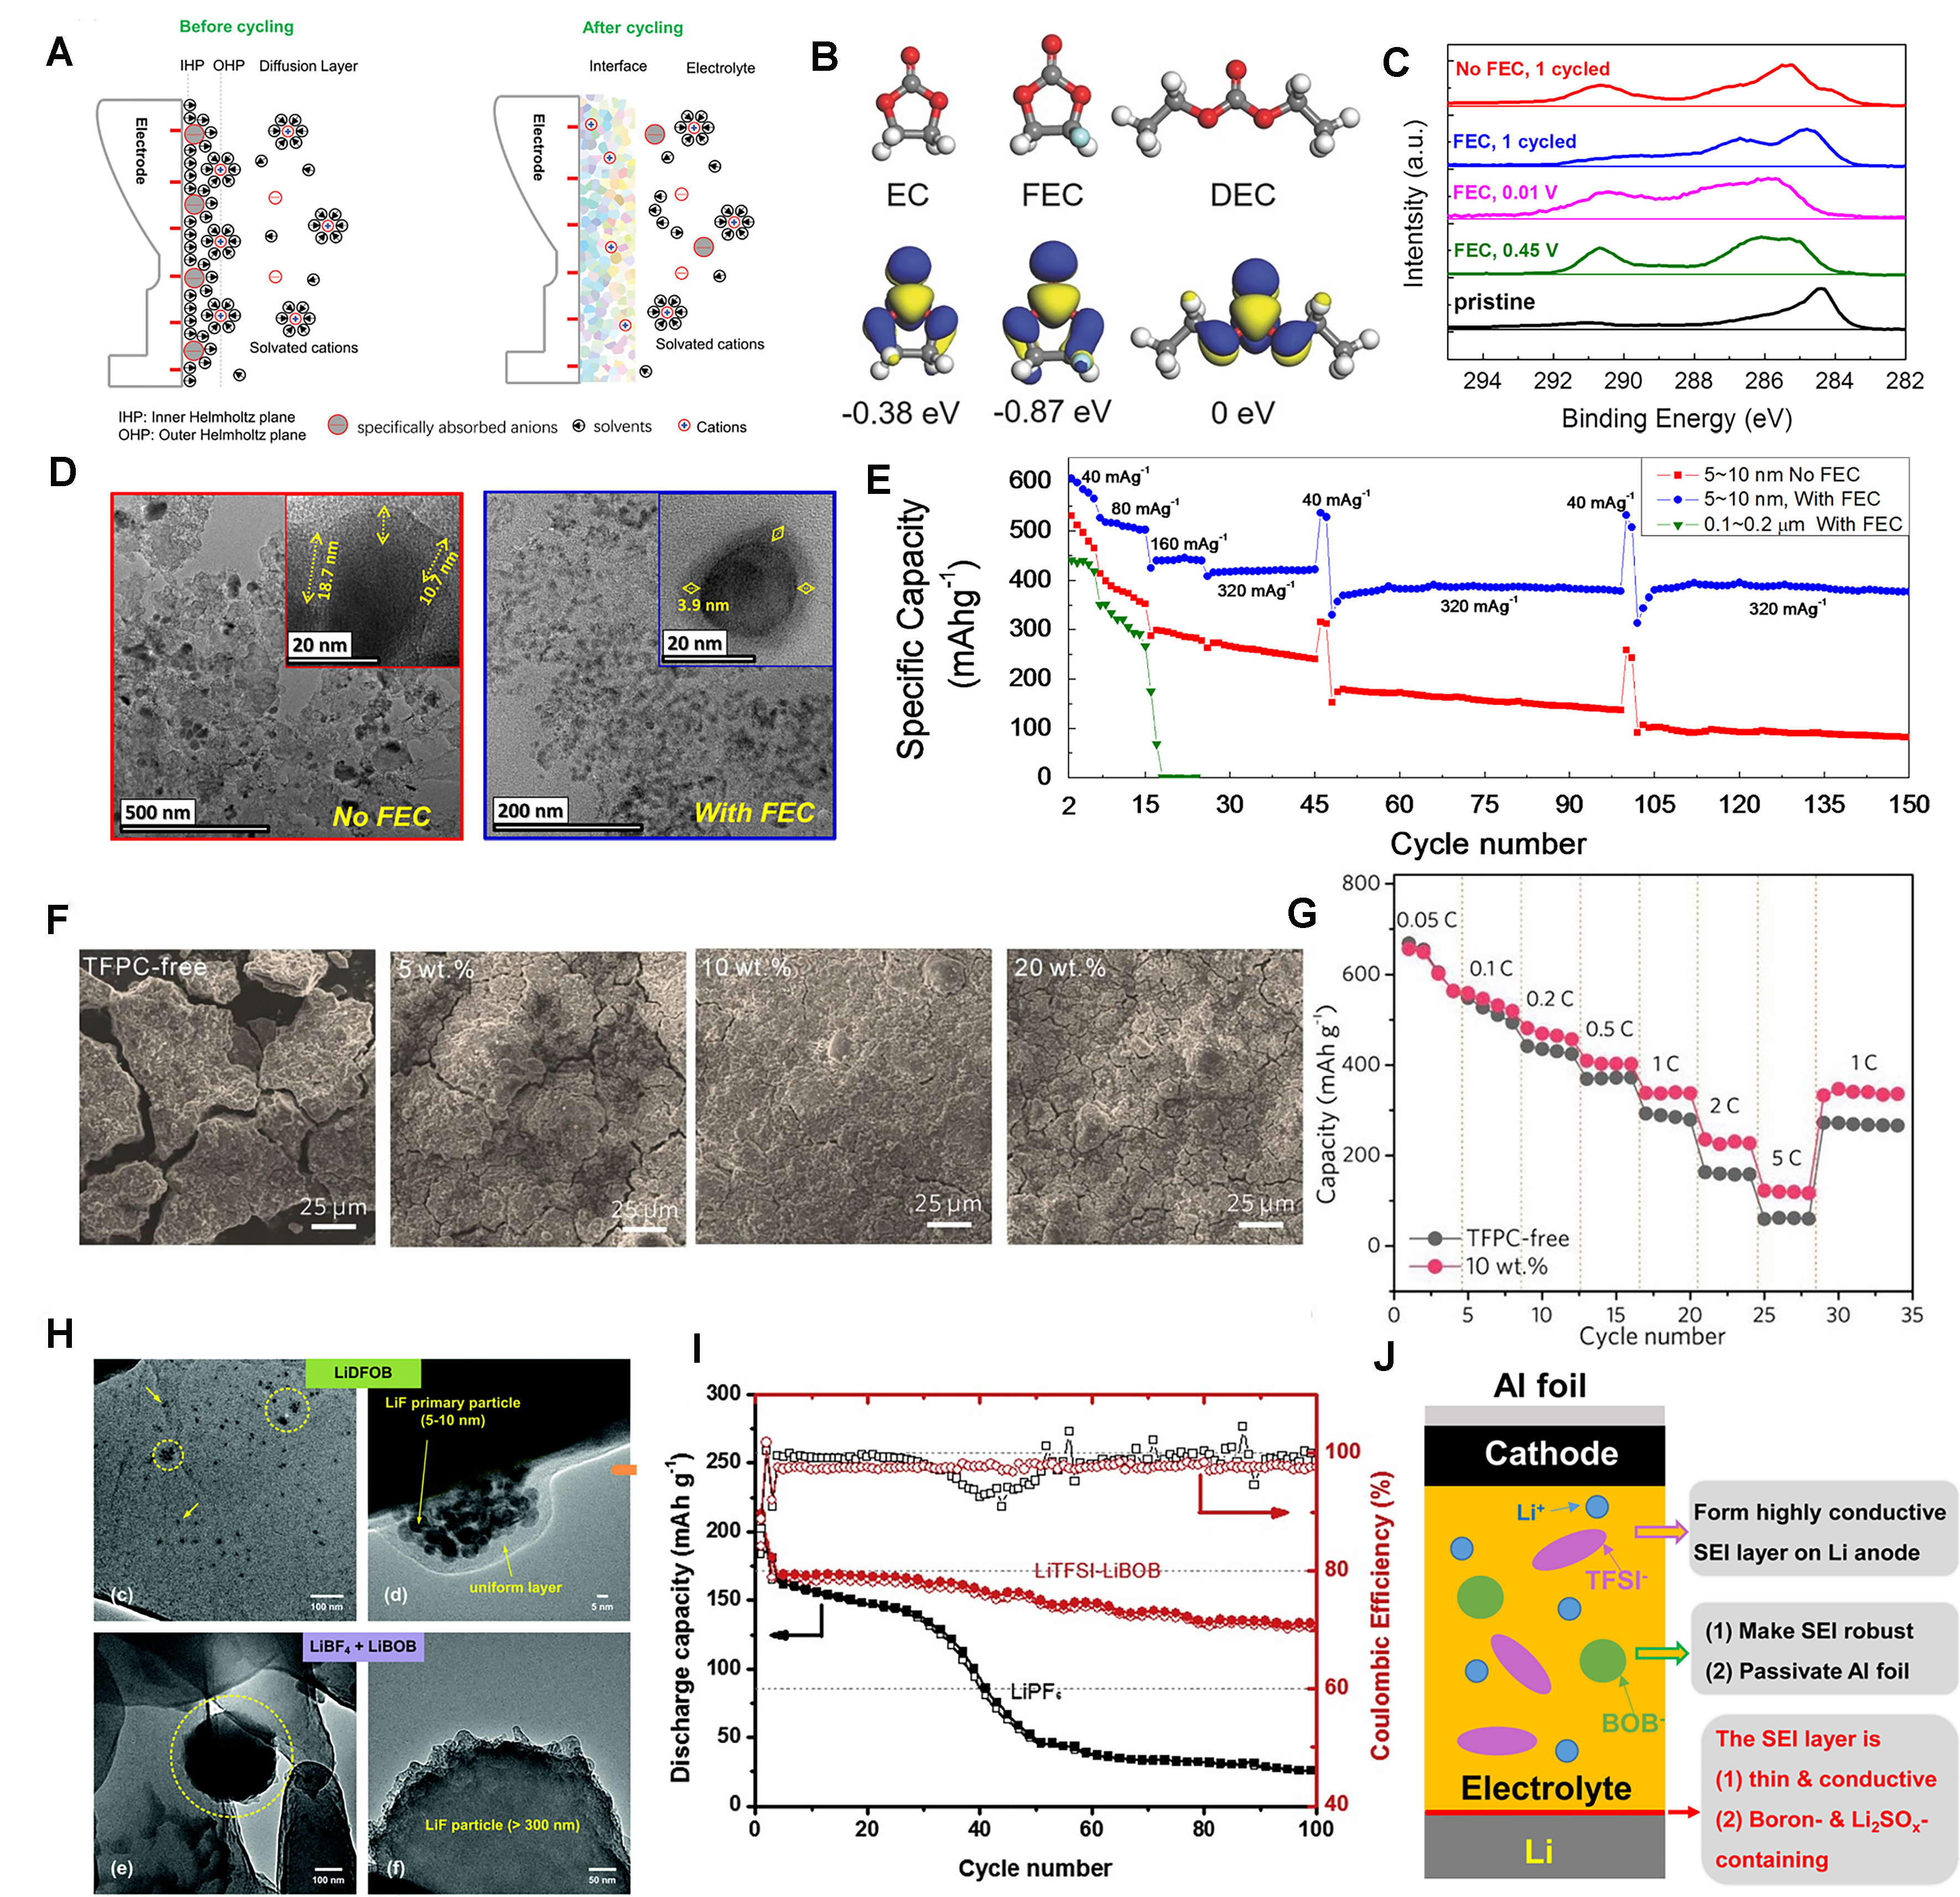
Figure 7. (A) The schematic diagram of the interface formation before and after cycling[97]. Copyright 2020, Wiley-VCH; (B) Molecular structure, visual LUMO and corresponding relative energy of EC, FEC, and DEC[100]. Copyright 2017, Wiley-VCH; (C) XPS C1s peaks of Sn electrode with FEC during 1st formation cycle; (D) HR-TEM images of cycled Sn electrode without FEC and with FEC additive; (E) Rate and cycle performance of Sn electrode without FEC and with FEC additive[101]. Copyright 2015, Elsevier; (F) SEM images of Si electrodes after cycling in the electrolytes containing 0, 5, 10, and 20 wt% TFPC for 50 cycles; (G) Rate capability of Si/C composite electrodes in the electrolytes without and with 10 wt% TFPC at various C rates[102]. Copyright 2019, Wiley-VCH; (H) TEM images of lithium plated from


