

fig1
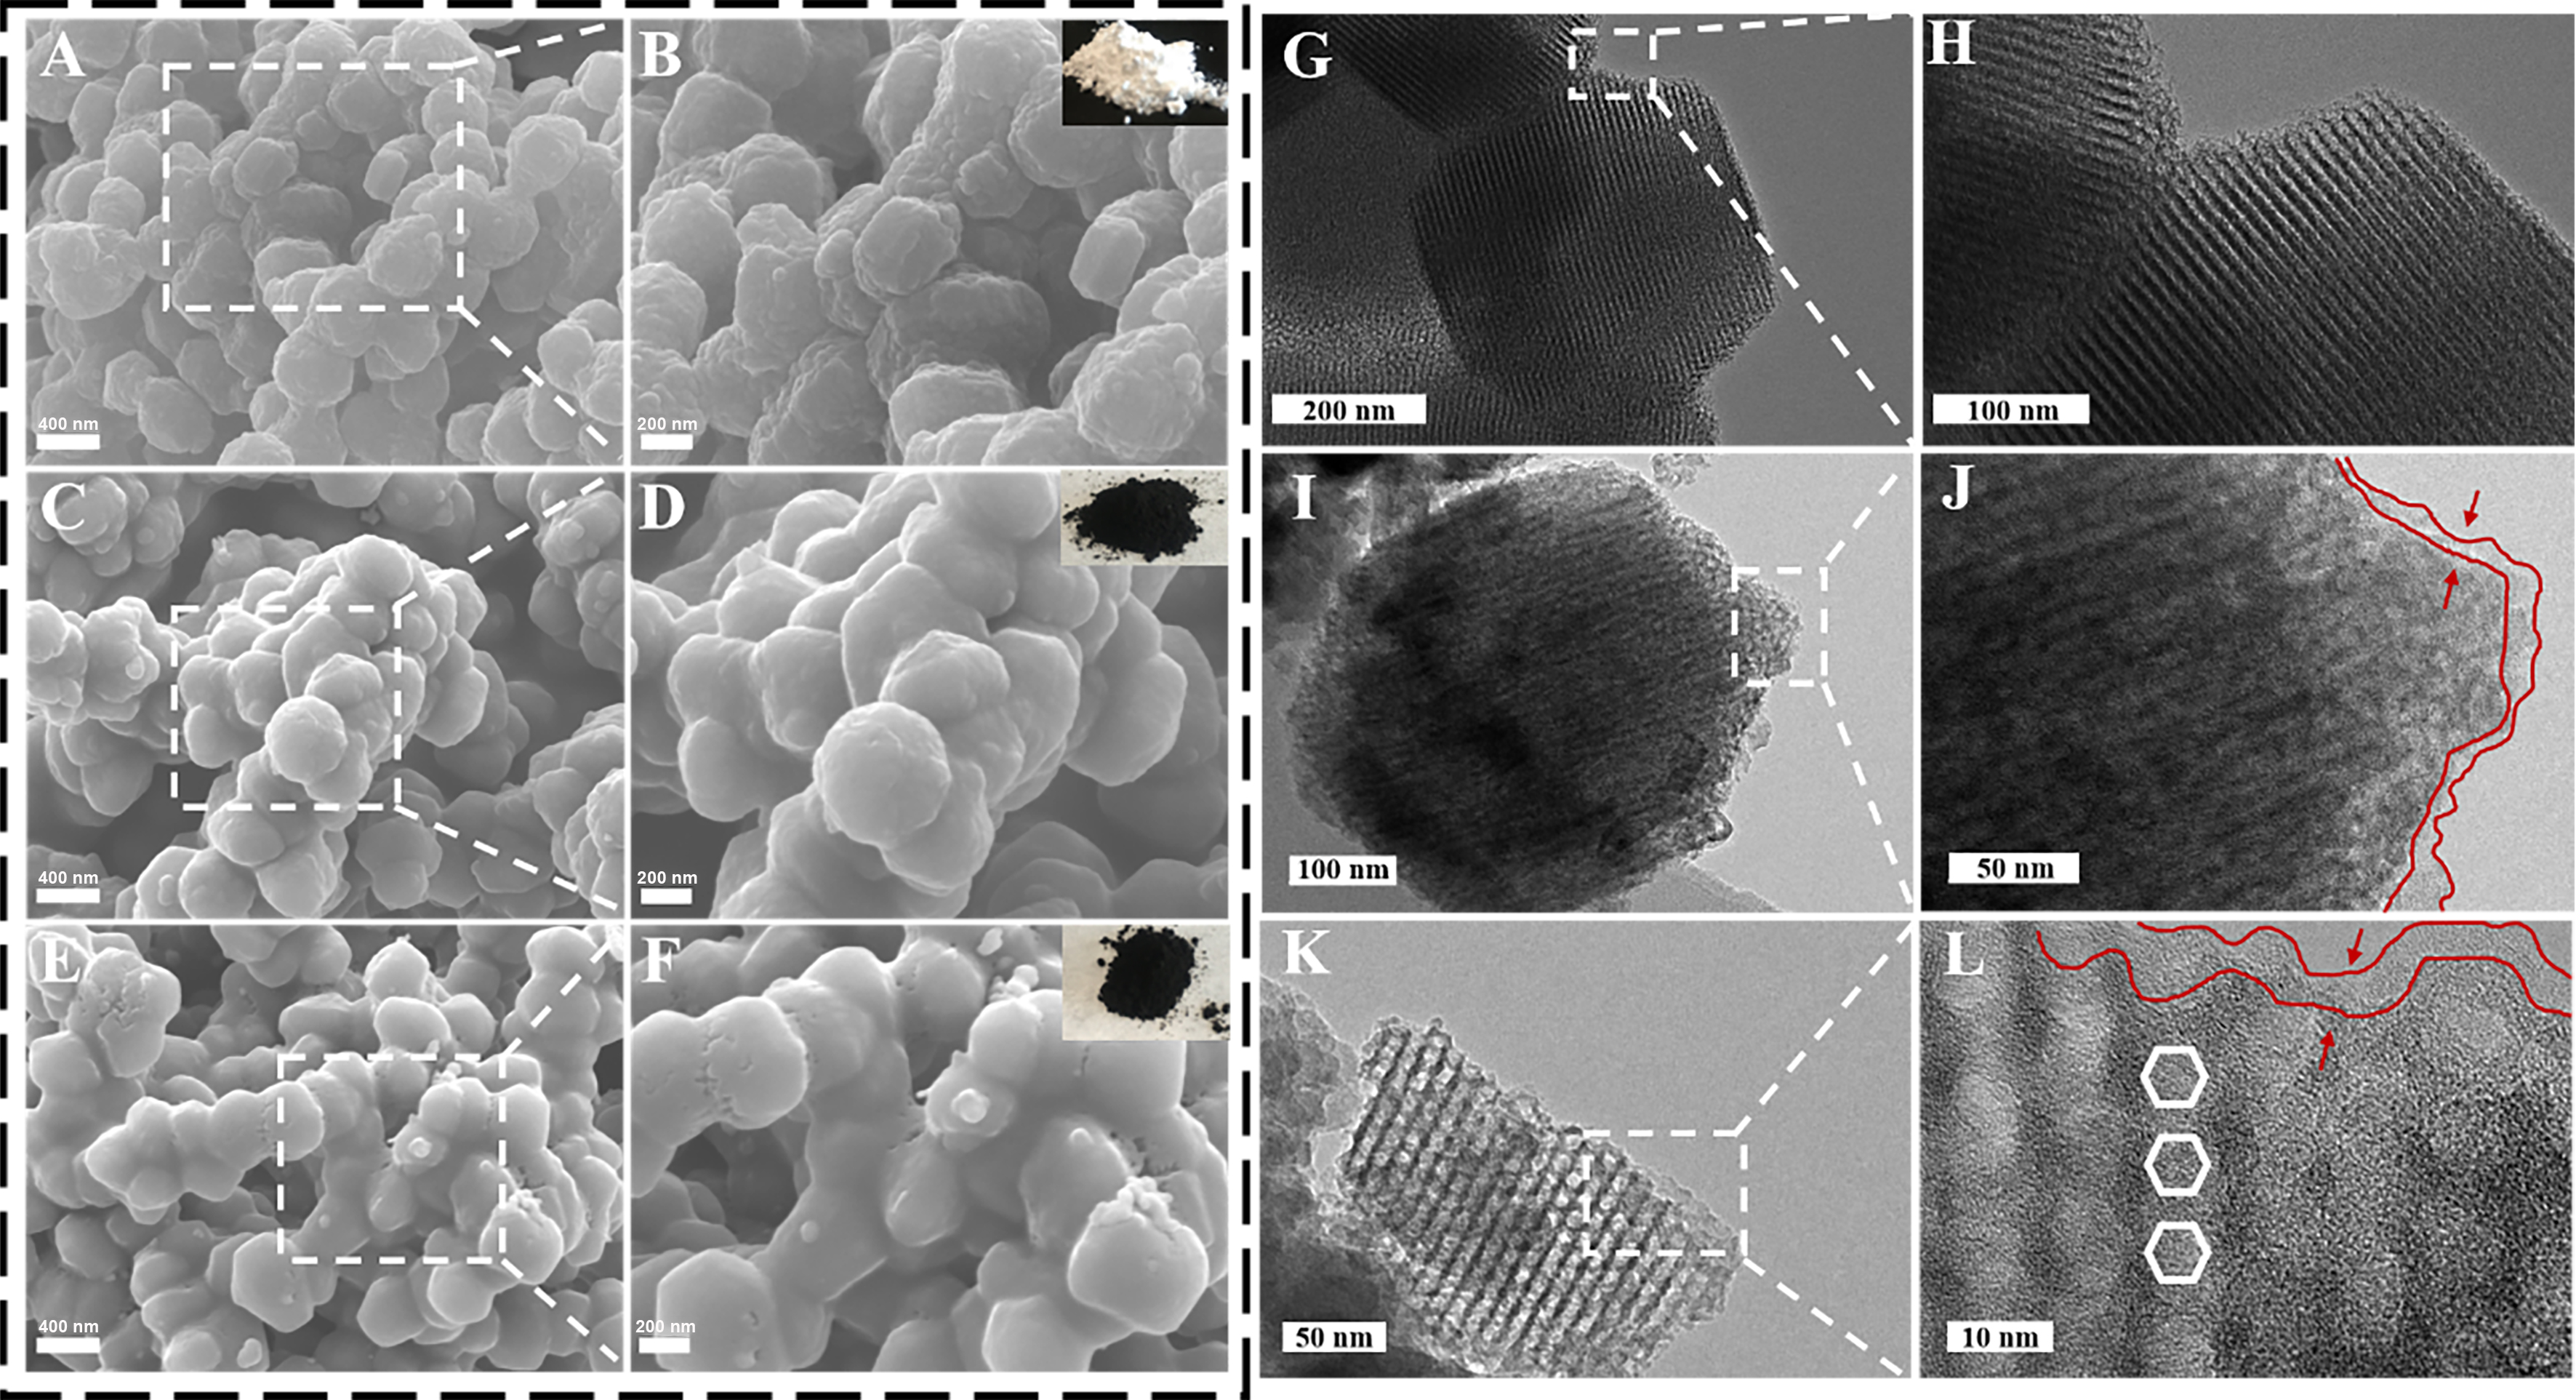
Figure 1. The SEM images depict the morphology of (A and B) ZS, (C and D) Co/N@ZS, and (E and F) Co/N@ZS-PDA. It should be noted that images (B), (D), and (F) provide magnified views of the rectangular regions in images (A), (C), and (E), respectively, with the inset showing a digital photo of the sample; The TEM images of (G and H) ZS and (I-L) Co/N@ZS-PDA are presented, with the magnified images (H), (J), and (L) corresponding to the rectangular regions in (G), (I), and (K), respectively. ZS: Zr-SBA-15; SEM: scanning electron microscopy; PDA: polydopamine; TEM: transmission electron microscopy.


