

fig8
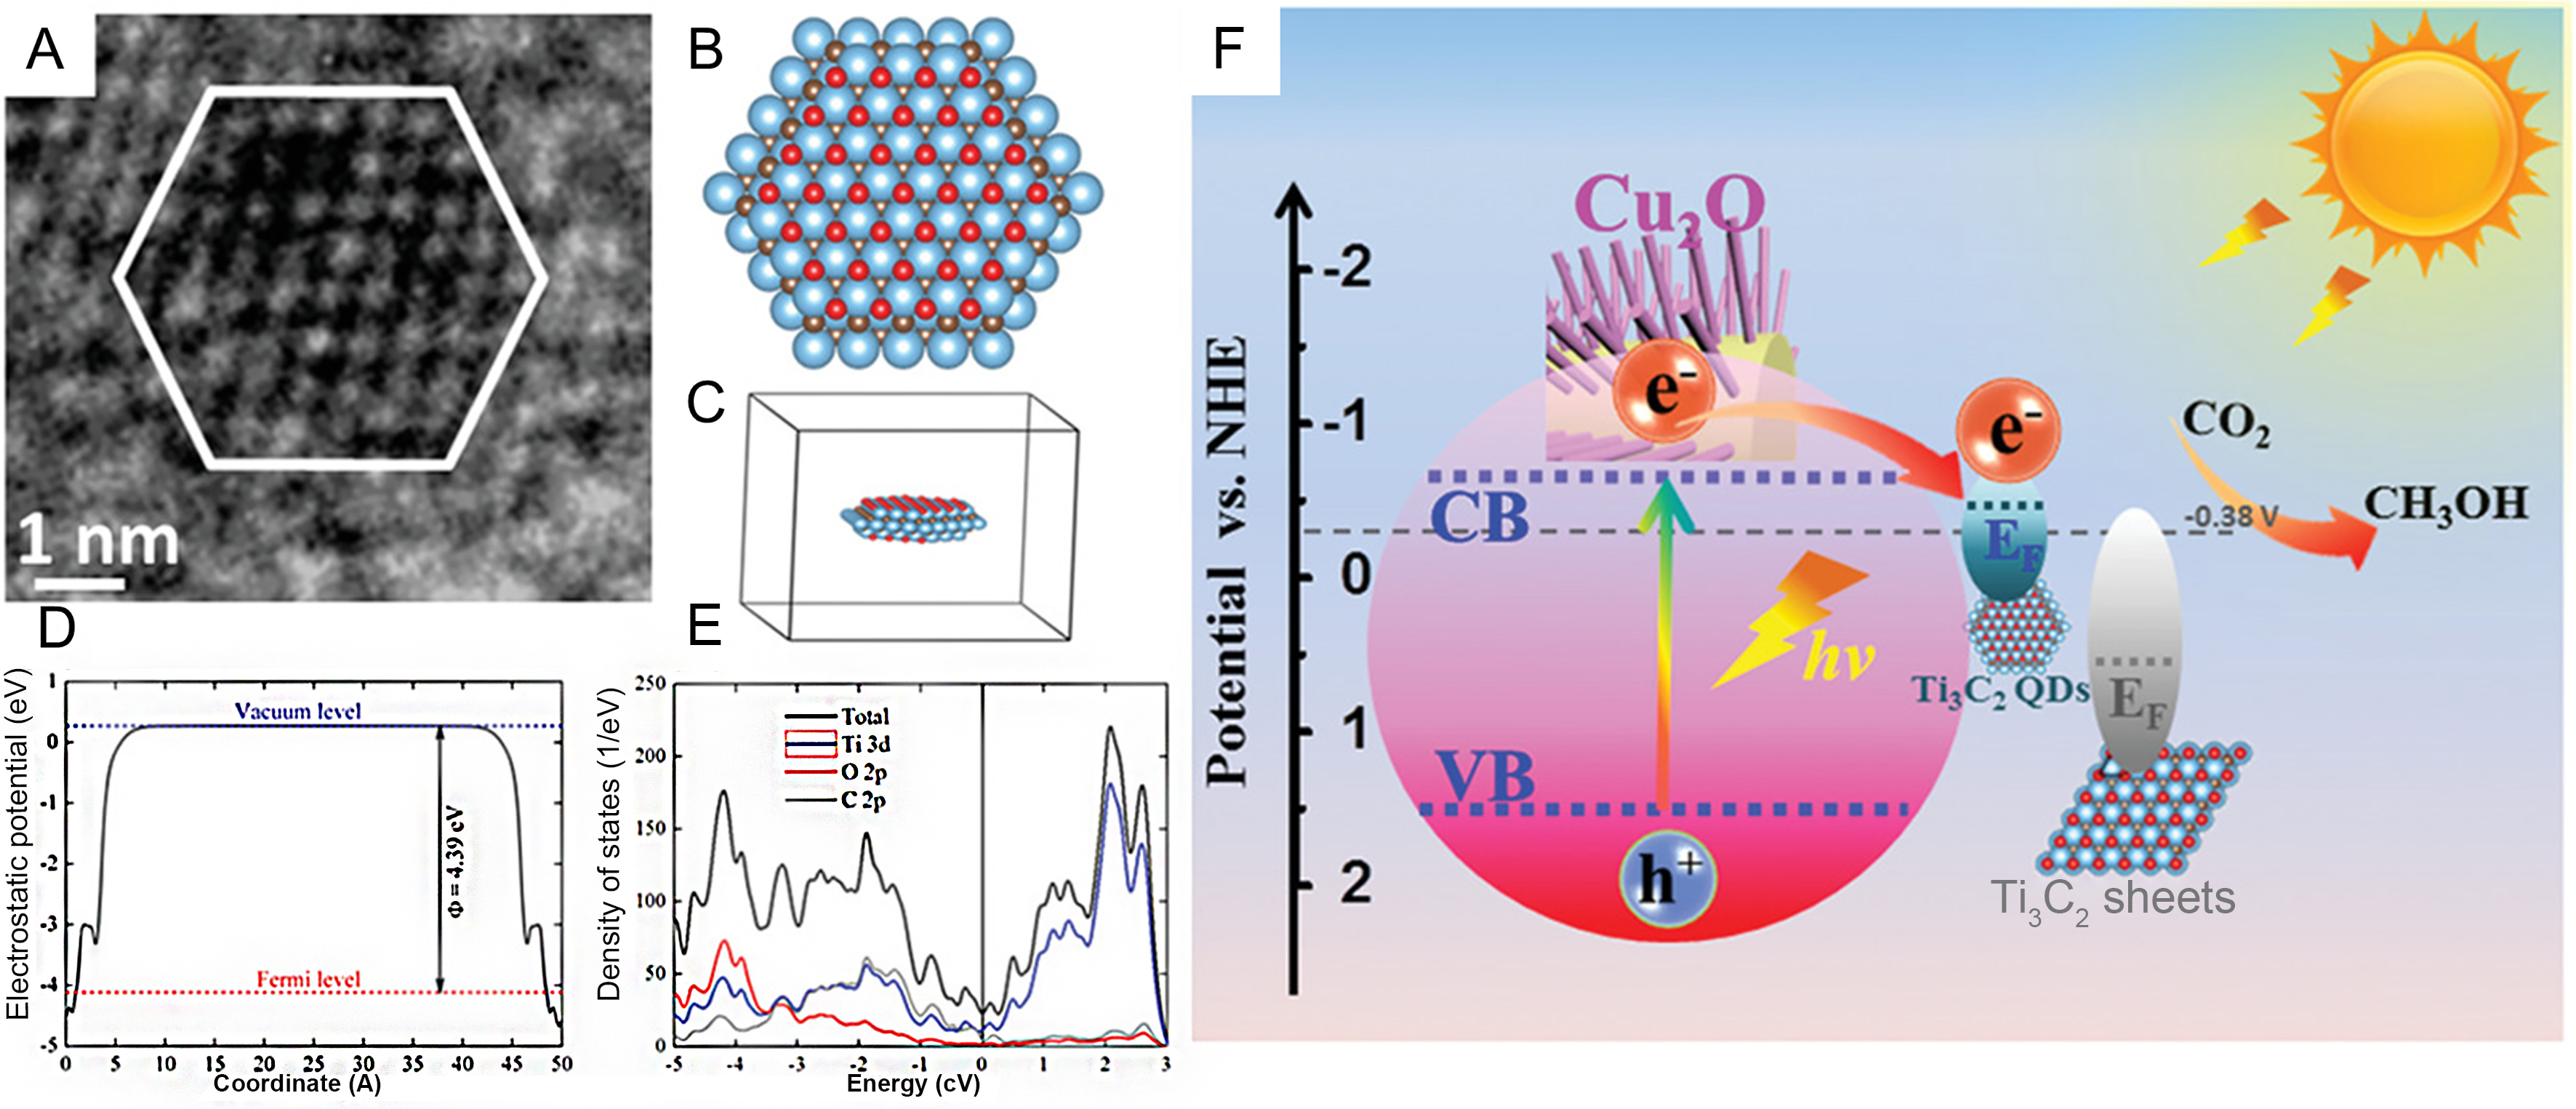
Figure 8. (A) High-resolution TEM image of Ti3C2Tx QDs; (B-E) The top view, side view of the structure, calculated Femi level, and DOS of O-terminated Ti3C2TxQD model; (F) Energy-level diagram of Ti3C2Tx QDs/Cu2O NWs and Ti3C2Tx sheets/Cu2O NWs heterostructures. (A-F) Reproduced with permission[110]. Copyright John Wiley and Sons. DOS: Density of States; TEM: transmission electron microscopy; QDs: quantum dots; NWs: nanowires.


